Bushings are estimated to account for 15-25% of all transformer failures and are typically the leading cause. Utilities therefore look to online monitoring as an effective means to identify their possible degradation early on and thereby avoid catastrophic failure.
For example, C57.143 – IEEE Guide for the Application of Monitoring Equipment to Liquid Immersed Transformers and Components provides a comprehensive list of online bushing monitoring techniques. Most notable among these are the Sum of Currents (SoC) and the Voltage Reference (VR) Methods.
This edited contribution to INMR by Mark Tostrud, Technology Officer at Dynamic Ratings compares these two techniques and gives their pros and cons. Sensitivity, accuracy, implementation complexity, and susceptibility to system disturbances such as harmonics and system unbalance are discussed as well.
Finally, case studies and simulation results are provided that highlight the strengths and limitations of each method. These findings provide additional insight for engineers into the most suitable method to select to enhance utility transformer condition monitoring strategies.


Sum of Currents (SoC)
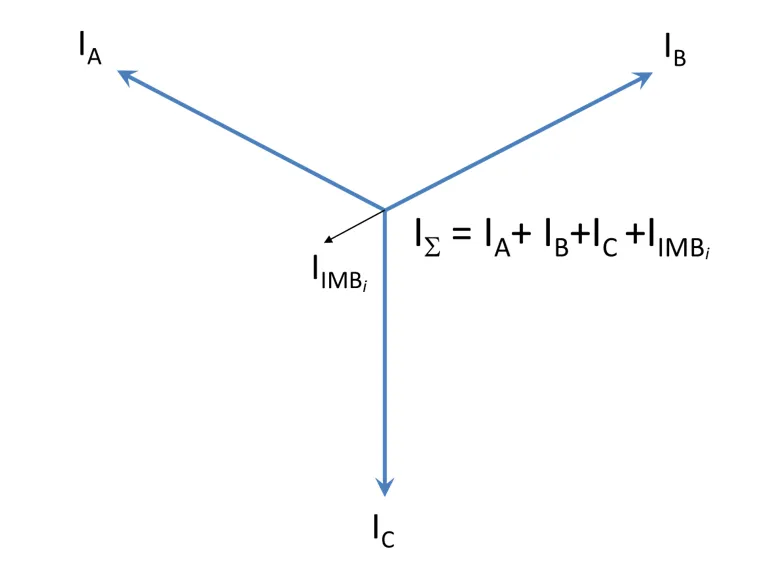
The SoC method relies on Kirchhoff’s current law to detect insulation degradation. The sum of currents is equal to the sum of the bushing leakage current vectors (as shown in Fig. 1). In a perfectly balanced system where the C1 power factor and capacitance values of the bushings are identical, sum of leakage currents will be zero.
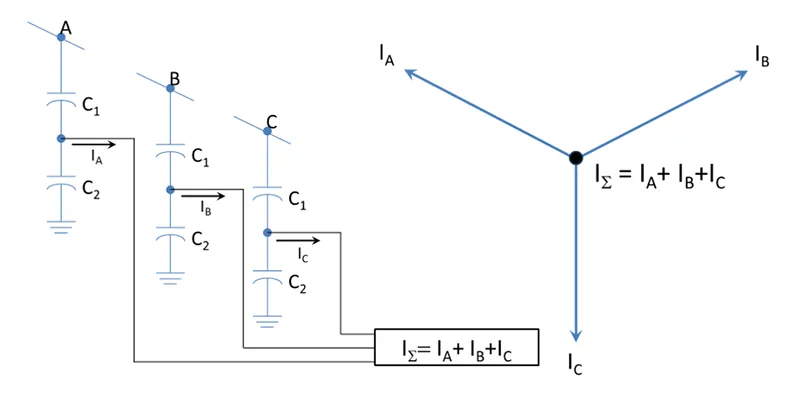
If the system is not perfectly balanced or if the C1 power factor and capacitance values of the bushings are not identical, the equation for the sum of currents must account for some level of imbalance current (as shown in Fig. 2). At time of commissioning, the initial imbalance current is measured by the system and stored.
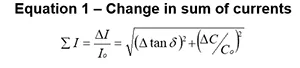
As shown in Equation 1, either a change in the C1 power factor or capacitance will drive a change in the sum of the imbalance current. This change in the sum of the imbalance current can be used to alert the user that a change in the condition of the bushings has occurred.
In a traditional utility system, before renewable generation, the transmission system was typically balanced and rarely deviated since the magnitude and vector angle of the system voltages were tightly regulated by the generator controls. The minor variations in system voltages normally seen on a traditional utility grid are not enough to drive significant changes in the imbalance current so the sum of currents method works very well.
Systems with large amounts of renewable generation or systems with excessive harmonics may have system voltages that are not as balanced and have frequent deviations in system voltage magnitudes and vector angles. If these variations occur at the same time every day or only occur during certain system loading conditions, the system can often be configured to accommodate these variations to prevent false alarms.
However, if these deviations are more random and affect one phase more than another, they can result in false alarms from systems using the SoC method or can result in errors in the calculation of the relative power factor and capacitance values.
The sum of current method requires a signal from each of the bushings being monitored to be wired to a central location. With banks of single-phase transformers, this may be challenging. If the bank of single-phase transformers also includes a spare, the system should be rebalanced if the configuration of the single-phase transformer changes.

Voltage Reference
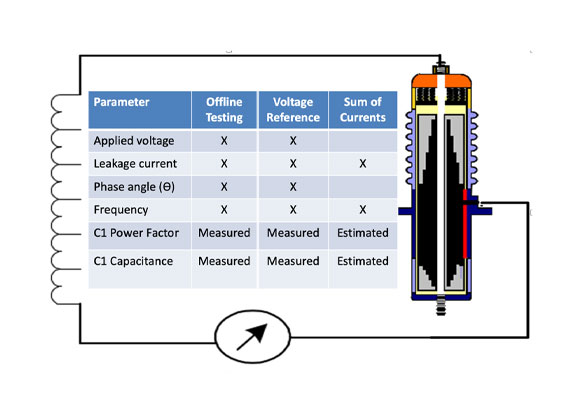
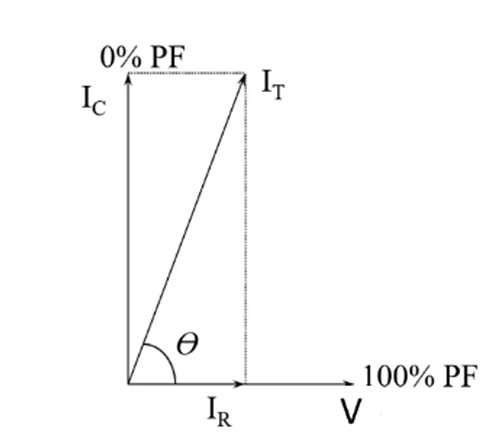
The voltage reference method most closely matches offline power factor and capacitance testing. However, instead of energizing the bushings at 10 kV using a voltage source in the test instrument, the method requires inputs from voltage transformers, potential transformers or CCVTs installed on the same bus as the bushings. The method measures the leakage current of each bushing relative to the voltage at which the bushing is energized. Since both the voltage and current are measured, as well as the phase angle between the voltage and current, the system can directly calculate the actual power factor and capacitance of each bushing. Any voltage deviations are accounted for in the system measurements resulting in an accurate measurement of the resistive and reactive components of the bushing leakage current.
Once these values are known, the actual bushing power factor and capacitance can be directly calculated. Since any system voltage deviations are measured, any changes in the resistive or reactive components of the bushing leakage currents can be attributed to changes in the power factor or capacitance of the bushings.
Although the power factor and capacitance values are more accurate than the relative power factor and capacitance values derived from the sum of current method, the values may still not match offline tests since voltage and temperature dependencies may exist with the bushing power factor measurements. Because of this, when monitoring the bushings continuously online, intermittent changes in power factor and capacitance may occur that offline testing is not able to detect.
When using the voltage reference method, the system can also monitor the health of the CCVTs themselves. Since the design of CCVTs is similar that of bushings, they are prone to similar failure modes. By monitoring the health of the CCVTs, in addition to the bushings, the user can identify which component of the electrical system is degrading. The voltage reference method is also not impacted by system anomalies, harmonic distortion or by changes in the power flow direction making it the ideal method for today’s grid.
To realize the most benefit from the voltage reference method, a reference should be provided for each bushing being monitored. The reference should come from the same bus that the bushing is being energized from. Phase to ground voltage references are preferred. While many voltage reference systems have the capability to phase angle compensate the reference, this should be avoided since it will result in errors in the measurements. On autotransformers without an OLTC, using the same reference for both the high and low side bushings is acceptable. Any phase shift that exists from the HV to LV side of the transformer should be stable and will have minimal impact on the accuracy of the readings.
One of the best applications for the voltage reference method is single phase transformers. Providing a voltage reference for the bushings on single phase transformers may be easier than wiring the bushing currents from each phase to a common location. This is especially true when the bank of single-phase transformers includes a spare as the voltage reference method eliminates the need to rebalance when changes are made to the configuration of the transformer bank.
Case Study #1: 138/69 kV Autotransformer with Rapidly Changing Sum of Currents
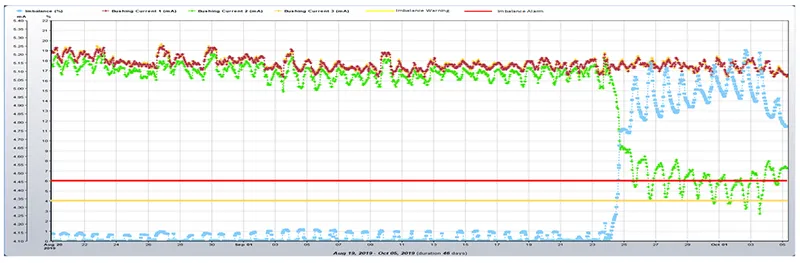
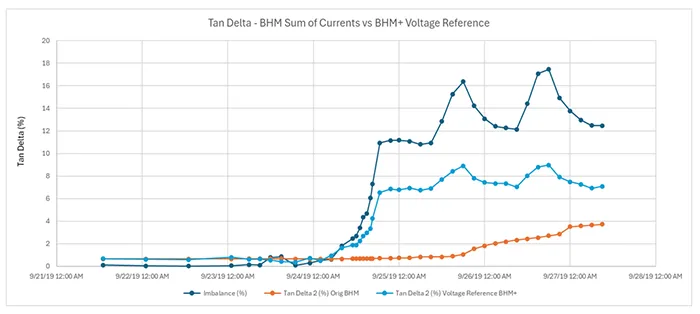
A utility in the U.S. had a 138/69kV autotransformer with oil impregnated paper bushings that suddenly went into alarm due to high imbalance current and high imbalance rate of change. Based on the rate of change shown in the online data, it is unlikely that this problem would have been identified before the bushing and transformer failed. In this situation, the monitoring system had been installed for approximately one year when suddenly, the imbalance % increased dramatically over a few days. Fig. 4 shows that the imbalance current alarm was due to a change in the X2 bushing leakage current.
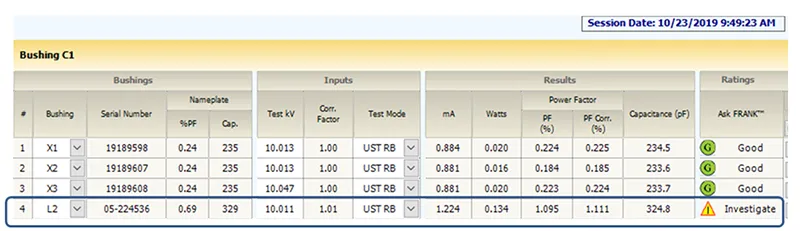
The data was sent to Dynamic Ratings for assistance in analyzing the situation. The detailed analysis identified that the change in the imbalance current was due to a change in the X2 bushing capacitance and power factor as shown in Fig. 5. The 13% change in the bushing C1 capacitance was of particular concern since the most likely cause for a decrease of this magnitude is a loss of oil in the bushing. Based on the large drop in capacitance, DR recommended an immediate inspection of the bushings to look for any signs of low oil or an oil leak.
During inspection, oil was found on the side of the transformer and the X2 bushing was found to be low on oil as shown in Fig. 6. The rapid oil loss in the bushing coincided with a through fault on the transformer during a thunderstorm.
An outage was requested and the transformer was removed from service to perform offline testing. While the offline testing showed a problem with the bushing, the offline tests did not show the urgency of the problem. The C1 power factor had increased to 1.11% since the previous test and the C1 capacitance was slightly lower at approximately 98% of nameplate. This shows the sensitivity of the online bushing monitor vs. offline testing. When testing a bushing under stress, it is more likely to show anomalies. C2 measurements could not be performed on the bushing as the test set would trip out once the tap was energized.
As shown in Equation 1, sum of currents can detect both changes in tan delta (power factor) or capacitance which provides early warning of changes in the health of the bushings. Since the sum of current method does not have a reference voltage for the bushings, the power factor and capacitance of the bushings cannot be measured directly. Rather, the method relies on an analytic in the monitor to calculate the relative tan delta (power factor) and capacitance of the bushings. The analytic uses the imbalance magnitude, imbalance vector, as well as the individual bushing leakage currents to identify changes in the tan delta and capacitance of the bushings.
Relying on only the imbalance magnitude and imbalance vector could result in errors since both an increase or decrease in the bushing leakage currents will drive changes in the sum of currents. Fig. 8 shows the polar diagram of the sum currents for the case study above.
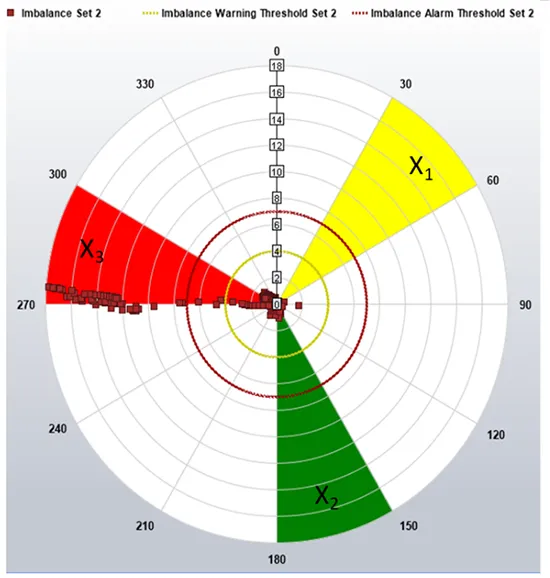
The polar diagram leads us to believe that the X3 bushing is driving the alarms from the monitor. The polar diagram works very well to identify which bushing is degrading when the power factor or capacitance of the bushings is increasing. However, when they are decreasing, the polar diagram can be misleading. Having a clear understanding of what is driving the imbalance current helps with the interpretation. Considering the bushing leakage currents in addition to the sum of currents, it becomes clear that the X2 bushing is degrading and driving the alarms. The analytic for the relative tan delta and capacitance correctly identified that the X2 bushing degrading and that the failure mode was a decrease in the C1 capacitance and an increase in the C1 power factor.
Since the relative values are calculated using a moving average, sufficient data must be collected to accurately calculate the values. Figs. 4 and 5 above show that while the sum of currents (imbalance) and bushing leakage currents show the changes immediately, the changes in the relative tan delta and capacitance values are delayed.

Comparison of Sum of Currents & Voltage Reference Methods
To analyze how the voltage reference method would perform for this failure, a simulation of the failure was performed. With the monitor configured to perform both sum of current and voltage reference measurements, a simulator was used to inject signals into the monitor. A voltage reference equivalent to the nominal output from the secondary of the 69kV CCVTs was wired to the monitor. The simulator was then configured to inject currents equal to the bushing leakage currents recorded during the failure.
Figs. 9 and 10 depict results of the simulation which showed that the voltage reference method will begin to show the changes in C1 power factor and capacitance of the bushings immediately and the changes correlate with the imbalance current from the sum of currents. The voltage reference method also clearly showed the full magnitude of the change as well as the trend of the changes. Whereas the changes in relative tan delta and capacitance for the sum of current method are delayed. Even after the relative measurements begin to show the change, the full magnitude of the change in tan delta and capacitance may not be reflected in the values.
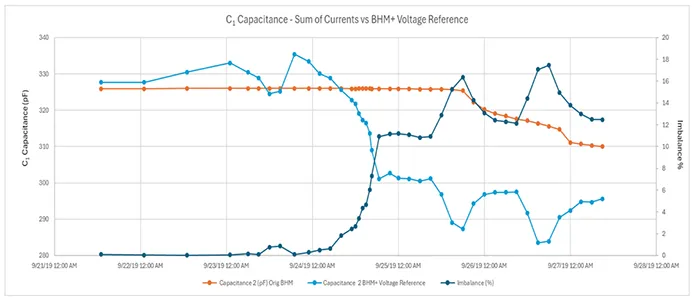
While the sum of current method provided alerts early in the failure process, the method required additional analysis to identify the root cause due to the delays in the reporting of the tan delta and capacitance values. For failures which occur gradually over time, this delay is unlikely to cause problems. For failures that occur quickly, waiting to react to changes in the relative power factor and capacitance could result in catastrophic bushing and transformer failures. When reviewing sum of current data following an alarm, the leakage currents (magnitude and angle) will offer a better correlation to changes in the sum of currents than the relative tan delta and capacitance measurements. With the voltage reference method, both the leakage currents and the power factor and capacitance measurements will have a direct correlation with any changes in the imbalance %.

Case Study #2: 220/69/10 kV Transformer with Erratic Sum of Currents, Power Factor & Capacitance Values
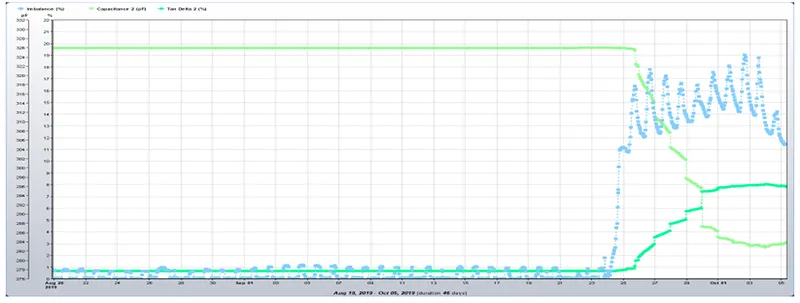
A bushing monitoring system using both the sum of currents and voltage reference method was installed to monitor the 220 kV bushings on a 220/69/10 kV transformer. Prior to the installation, the bushings were power factor tested and found to be in good condition. Shortly after the monitor was installed, the system began to alarm due to changes in the sum of currents and high power factor values. Data was sent to Dynamic Ratings for review and analysisA bushing monitoring system using both the sum of currents and voltage reference method was installed to monitor the 220 kV bushings on a 220/69/10 kV transformer. Prior to the installation, the bushings were power factor tested and found to be in good condition. Shortly after the monitor was installed, the system began to alarm due to changes in the sum of currents and high power factor values. Data was sent to Dynamic Ratings for review and analysis. The polar diagram in Fig. 11 shows that the sum of currents is highly erratic.
When this occurs, analysis of the sum of current data can be difficult since you cannot easily identify whether the erratic imbalance current is due to multiple bushings degrading at the same time or whether system anomalies are driving the erratic readings. Having voltage reference information available makes this analysis much easier. While it is unusual to have three bushings failing on a transformer at the same time, the bushings in this case study are resin bonded paper bushings. High power factors, changes in capacitance as well as partial discharges are very common in this type of bushing.
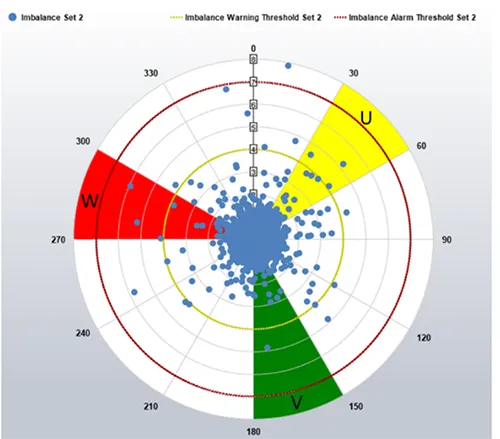
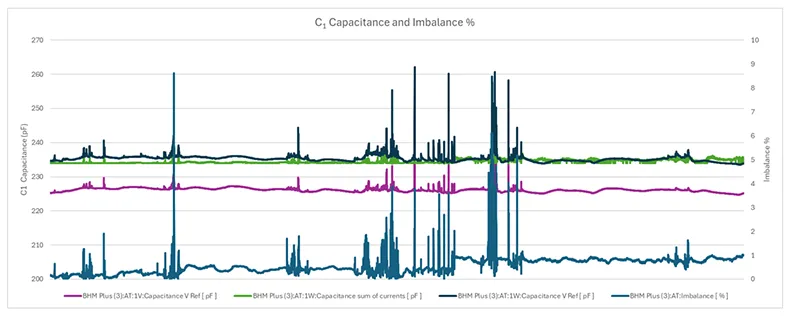
Fig. 12 graphs the sum of currents and the bushing voltage references. The spikes in imbalance % do not show any correlation changes in the voltage references. Since system anomalies can be ruled out, the spikes in the imbalance % can be attributed to changes in bushing power factor and/or capacitance.
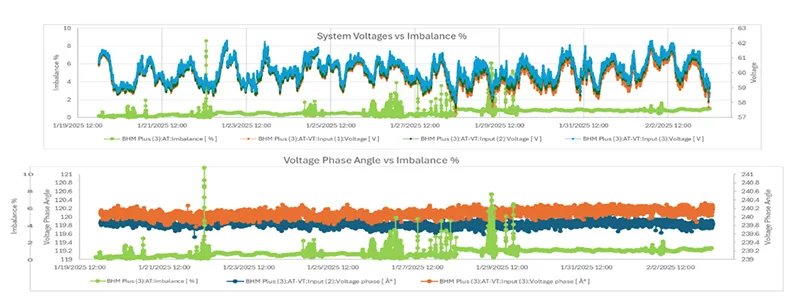
Without the voltage reference signals, it would have been very difficult to conclude this from the sum of currents data alone.
Fig. 13 shows graphs of the power factor values from the sum of currents and voltage reference method. From these graphs it is easy to see that the changes in imbalance current are due to changes in the power factor of all three bushings. As in the case study above, while the sum of currents method show the changes in power factor in the relative tan delta measurements, the voltage reference power factor measurements shows a much stronger correlation.
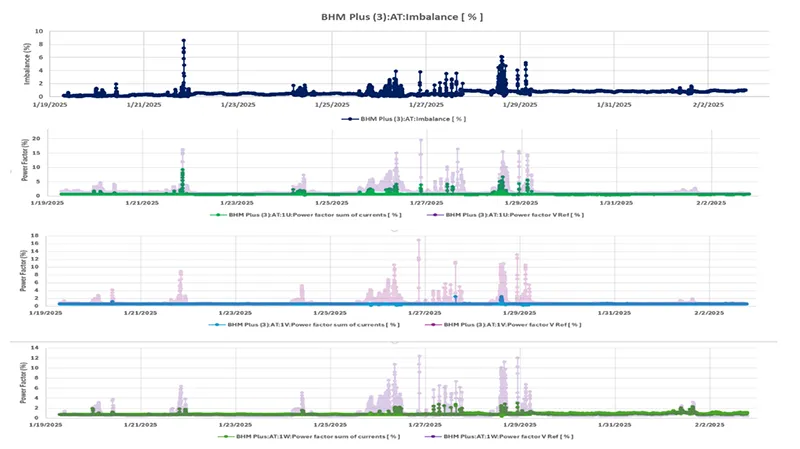
Fig. 14 shows that in addition to the changes in power factor, changes in the C1 capacitance of the bushings are also driving the spikes in the imbalance current.

Conclusions
Bushing failures continue to be one of the leading causes of transformer failures. While certain styles of bushings are more prone to fail than others, failures can occur with any bushing design. Most bushing failures can be detected through continuous online monitoring. When deploying online monitoring, it is important to develop an understanding of the failure modes of the equipment you are trying to monitor as well as how the monitoring equipment will respond to those failure modes.
The sum of current method has been used to successfully identify degrading bushings for over 30 years. There are thousands of installations worldwide utilizing this method. Hundreds of bushings (and transformers) have been saved through the early detection of degraded bushings using this method. All the signals required are available on the transformer, so the installation is more cost effective than other methods, especially on three phase transformers. The method is sensitive to both changes in power factor and capacitance.
While a polar chart view of the sum of currents is an excellent tool for helping to determine which bushing is experiencing problems, the polar chart only works if the power factor and/or capacitance of the bushings are increasing. If the power factor or capacitance of the bushing(s) are decreasing, the polar chart can be misleading. Additional analysis techniques like trending the leakage currents (magnitude and phase angle) along with the imbalance % is the best method to confirm what is being displayed on the polar chart.
The voltage reference method offers the ability to rely solely on the power factor and capacitance measurements of the bushings for analysis. Power factor and capacitance measurements have been used to identify defective electrical equipment for almost 100 years. Hence, it is a proven and well understood way of identifying bushings that are starting to degrade. While the method offers more accurate power factor and capacitance measurements, the values from the online monitor may not match offline tests.
Power factor and capacitance in degraded bushings are often voltage dependent and temperature dependent. The defects are more likely to show when the bushings are under stress, an online monitor will identify defects much earlier than an offline test. Systems with large amounts of renewable generation or systems with excessive harmonics may have system voltages that are not as balanced and have frequent deviations in system voltage magnitudes and vector angles. Since system voltage anomalies could result in false alarms from the sum of currents method, the voltage reference method should be considered for these applications. The voltage reference method should also be considered for single phase transformer applications since it eliminates the need to wire the signals from each single-phase tank to a single location.

REFERENCES
[1] Sokolov, V. and Vanin, B., “Evaluation and Identification of Typical Defects and Failure Modes of 110-750kV Bushings”, Proceedings of the Sixty-Fourth Annual International Doble Conference, 1997.
[2] Sokolov, V. and Vanin, B., “Evaluation and Identification of Typical Defects and Failure Modes of 110-750kV Bushings”, Proceedings of the Sixty-Fourth Annual International Doble Conference, 1997.
[3] IEEE C57.143:2024, IEEE Guide for Application of Monitoring Equipment to Liquid-Immersed Transformers and Components.
[4] Tostrud, M. “Failure Characteristics of OIP vs. RIP Bushings”, Proceedings of the Eighty-Fourth Annual International Doble Conference, 2017.
[5] Tostrud, M. “Why Offline Bushing Tests May Not Confirm Alarms from Online Bushing Monitoring Systems”, TechCon 2017.
[6] Tostrud, M. and Schneider C. “Lessons Learned from Online Bushing Health Monitoring”, TechCon 2020.
[7] Tostrud, M. “Unusual Bushing Failure Modes Detected with Continuous Online Monitoring, INMR 2023.