Bushings are a vital part of high voltage transformers and reactors and all maintenance programs need to include an assessment of their condition. A problem with even a single bushing can result in transformer equipment damage and failure, increased power system disturbance, and loss of load. Indeed, a 2015 CIGRÉ Technical Brochure found that about 20% of transformers fail due to bushing-related issues.
This edited contribution to INMR by Dr. Poorvi Patel of the Electric Power Research Institute (EPRI) in the United States reviews the content of a 2022 IEEE Guide for dielectric frequency response (DFR) on bushings (C57.12.200)*. It also provides testing guidelines for time-based, type-based or phase-based DFR analysis and presents a case study in which DFR helped a utility identify bushings with potential issues.
* REPRINTED WITH PERMISSION FROM IEEE. COPYRIGHT IEEE 2022. ALL RIGHTS RESERVED
Dielectric Frequency Response (DFR), also called frequency domain spectroscopy (FDS), is a diagnostic technology that has been practiced for many years. In mid-1990, the first commercial portable field device was introduced to the market, and the application was mainly to access the condition of paper-oil insulated cables. A few years later, the technology was also used on paper-oil insulated power transformers to measure the average moisture content of transformer insulation. In 2004, CIGRÉ developed Technical Brochure 254, “Dielectric Response Methods for Diagnostics of Power Transformers”, which focused on three dielectric response techniques: return voltage measurements (RVM), dielectric spectroscopy in time domain (TDS), and dielectric frequency domain spectroscopy. As DFR became more frequently used in the field to assess transformer insulation moisture, a Guide specific to this technology was needed.
In 2010, CIGRÉ published Technical Brochure 414, “Dielectric Response Diagnoses for Transformer Windings”, which combined acquired practical experience with the mathematical modelling approach to determine testing best practices. The document covered the fundamentals of the insulation model, measurement configurations, test performance, and a comparative analysis using Karl Fisher titration to validate using dielectric response methods to detect moisture estimation in solid insulation. In 2018, IEEE published C57.161 “Guide for Dielectric Frequency Response (DFR) Test Methods of Liquid Immersed Transformers”. The Guide was focused on how DFR could be used to estimate insulation moisture. However, at this time, there was more knowledge of DFR cases from the field, in which this technology was showed to be sensitive to insulation contamination such as carbon contamination and corrosive sulphur (Cu2S). The Guide presented a few such cases in the Annex.
Moreover, bushings are a vital part of high voltage transformers and reactors. It is important that all maintenance programs need to include bushing condition assessment. A problem with a single bushing can prevent the transformer/reactor from returning to service. CIGRÉ’s 2015 Technical Brochure 642 – “Transformer Reliability Survey” found that about 20% of transformers fail due to bushing-related issues. A bushing failure can result in equipment damage, increased system disturbance, and loss of load. The failure of an oil-filled bushing can be more problematic than dry-type bushings and can cause substantial collateral damage. Like transformer insulation or paper-oil cables, bushing insulation of oil-filled bushings is mainly paper and oil. Thus, DFR could also be used for condition assessment of bushings. Not limited to oil-impregnated paper (OIP) bushings, DFR can also be applied to resin-impregnated paper (RIP), resin impregnated synthetic (RIS), and resin bonded paper (RBP) bushings. Bushings could also be wall-type bushings or roof-type bushings, there is limited knowledge how DFR could be applied and analysed on these types of bushings today.
Performing DFR on capacitance graded bushings in the field is not as prevalent as performing DFR on transformers/reactors; however, it is gaining popularity. Significant research, lessons learned, and knowledge sharing from the field are needed to understand the value of this technology. Today, primary diagnostic testing on bushings is 50/60 Hz power factor and capacitance testing. Reviewing 50/60 Hz power factor and capacitance may not reveal developing condition degradation of the bushing prior to failure. The goal of DFR testing is to identify problematic bushings in early stages, as this technology measures the insulation power factor and capacitance over a frequency band.
In 2018, the IEEE entity group in China, together with the IEEE Transformer Committee, established a Guide for DFR on bushings. IEEE C57.12.200 was published in 2022. This Guide provides guidelines for performing DFR measurement of various types of condenser bushings (capacitance graded bushings) either in the field or in the factory. The Guide does not cover gas-insulated bushings but covers measurement technique, measuring equipment requirement, and interpretation of results based on comparisons. The Guide also covers theory related to DFR, such as temperature correction using the Arrhenius equation, the influence of surface creep currents, and the influence of voltage. The Annex describes a few DFR bushing case studies.
IEEE C 57.12.200, while not complete, is a step forward to guide testers and enable them to begin measuring and analysing bushing DFR. Future updates to this Guide need to collect more data and case studies to improve understanding of the value of the technology as well to better understand the types of abnormalities in early stages this technology can diagnose that other technologies cannot diagnose.

Performing DFR Testing
Just as with the 50/60 Hz power factor capacitance test, DFR is a nonintrusive, non-destructive off-line testing technique. Measurements are obtained in the frequency domain. The results can be displayed as capacitance and power factor as a function of frequency. The power factor reflects loss characteristics determined by polarization and conduction phenomena of insulating materials. On power transformers, the DFR measurement could be used to determine average moisture content of solid insulation and conductivity of liquid insulation. If contamination of transformer or reactor insulation is suspected (i.e., carbon contamination of corrosive sulphur contamination), the DFR has been quite successful at detecting such anomalies.
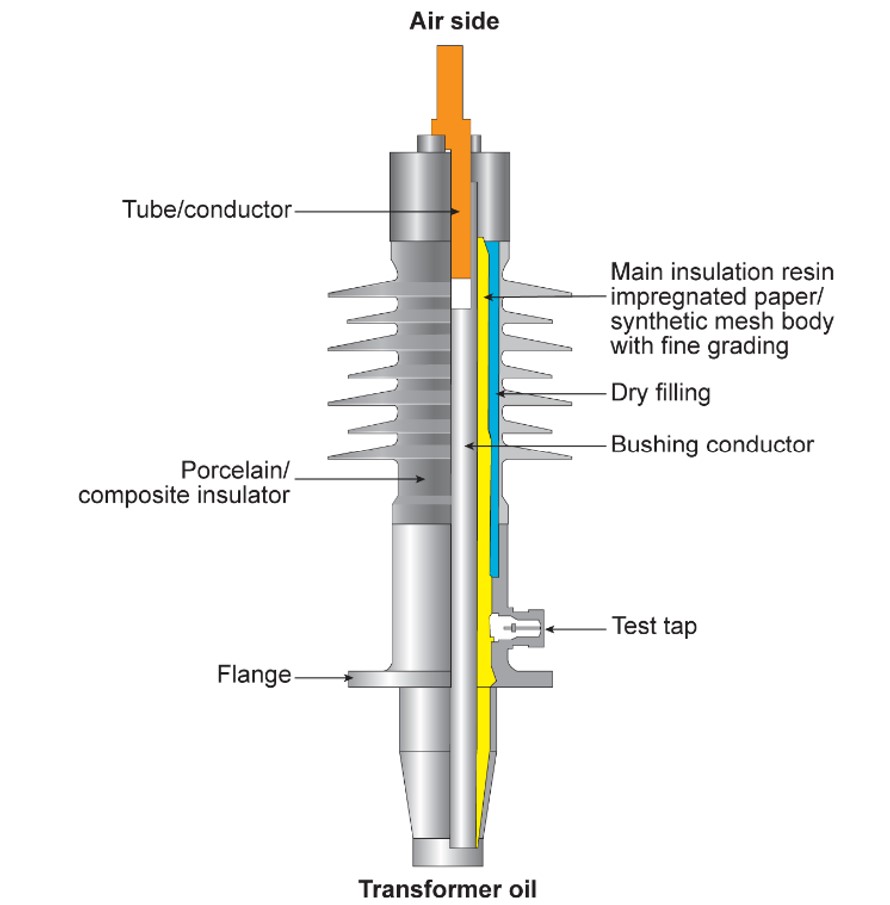
The use case for DFR measurement on bushings remains unclear. In several cases, where the dielectric losses at lower frequencies are higher on one bushing compared to similar bushing installed on the same transformer with identical bushing type, rating, and manufacturer (i.e., sister bushing units). When inspecting the problematic bushing, an abnormality such as contamination has been found. Using DFR on the transformer, the analysis provides an average moisture value, while for bushings, the proper algorithms are not available. If a bushing has higher moisture content compared to its sister bushings, it may be detected by comparing the DFR traces. The bushing insulation system (capacitance graded bushing insulation) consists of a composite dielectric media, OIP, RIP, or RIS (see Fig. 1). Most DFR testing on problematic bushings has been performed on OIP-type bushings. Testing on OIP bushings has shown that DFR can detect bushings that are in poor condition. However, more testing is required for other types of bushings such as RIP, RIS, and RBP bushings.
Test Set-up
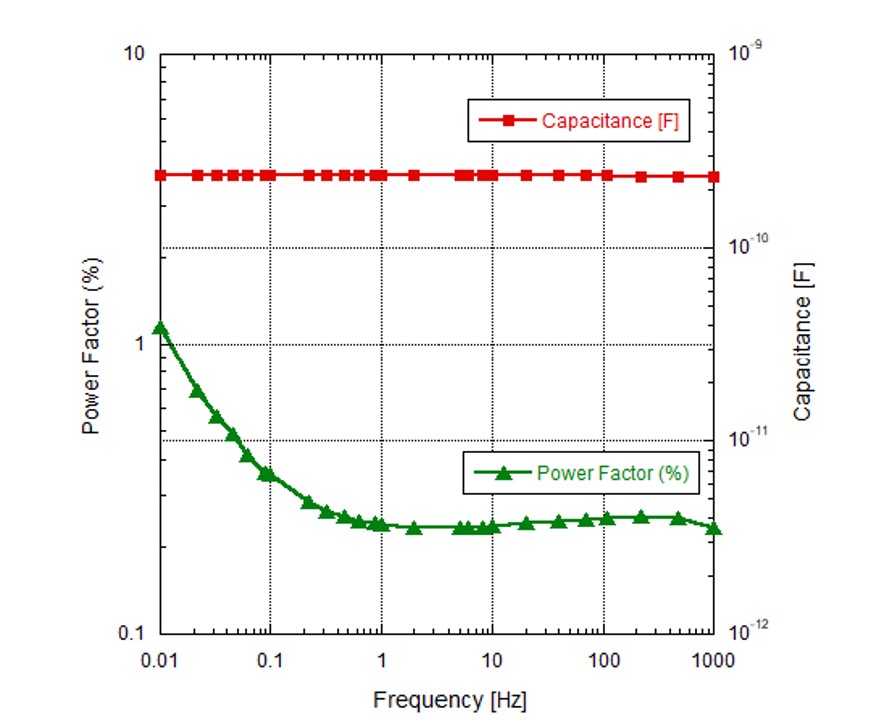
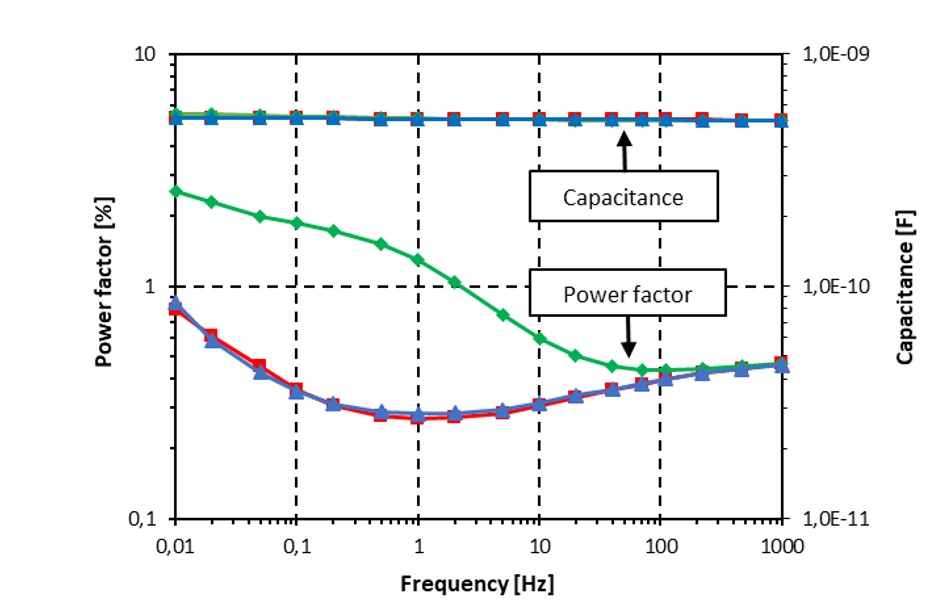
The set-up and procedure of the DFR measurement is like the power factor measurement at power frequency described in IEEE Std 62-1995. The most common testing performed is the C1 capacitance and power factor testing. Fig. 2 shows the capacitance and dielectric loss trace of a bushing in good condition. Losses are typically quite low for a new bushing or a service-aged bushing with no issues.
The measurement can be performed on all types of bushings with test or voltage taps. Comparison with the reference can reveal the change in overall insulation condition. The impact of contamination and degradation is more prominent in the low-frequency range for bushings with paper insulation.

Temperature is a key factor that influences DFR traces, hence, it is very important to record the ambient temperature before testing. If the bushing is mounted on a transformer or other oil-filled apparatus, the top oil temperature should be recorded as well. Furthermore, the surface condition can also affect DFR traces. The traces can exhibit a different appearance, depending on whether the surface is wet or dry. Thus, cleaning the bushings before testing is needed for both C1 and C2 testing (see definitions below). The environmental conditions such as humidity and weather (if the measurement is performed outside) are also important to record.
Before testing, all the windings on which the tested bushings are installed, including the neutral if available, need to be short-circuited. All other windings accessible through bushing terminals should also be shorted and grounded. As an example, if a high-voltage (HV) side bushing is being tested on a two-winding transformer, the HV side needs to be shorted, and the LV side needs to be shorted and grounded. For an autotransformer, windings that have internal electrical connections should be shorted together. Failure to short the windings properly could introduce interference or resonance effects that can lead to erroneous results.
In some cases, the DFR testing is performed before installation on a transformer or in a storage facility. In these cases, the bushings can be tested in an oil-filled tank (to minimize surface leakage current on the oil side) or mounted on a grounded metallic rack. The bushing flange should be grounded to a solid ground.
Bushings should not be tested in the shipping container. The reason is that the DFR could consider the shipping cage, especially a wooden container, to be part of the bushing insulation. In any case, contacting the bushing manufacturer for more guidance before performing testing is advisable.
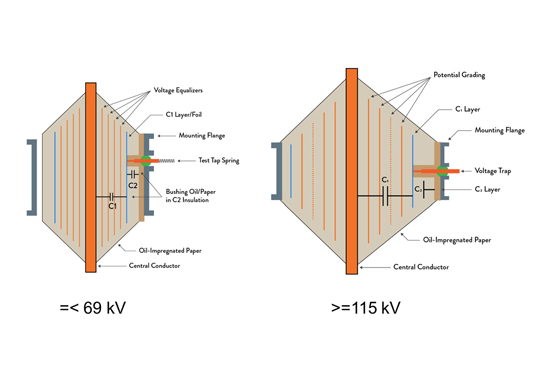
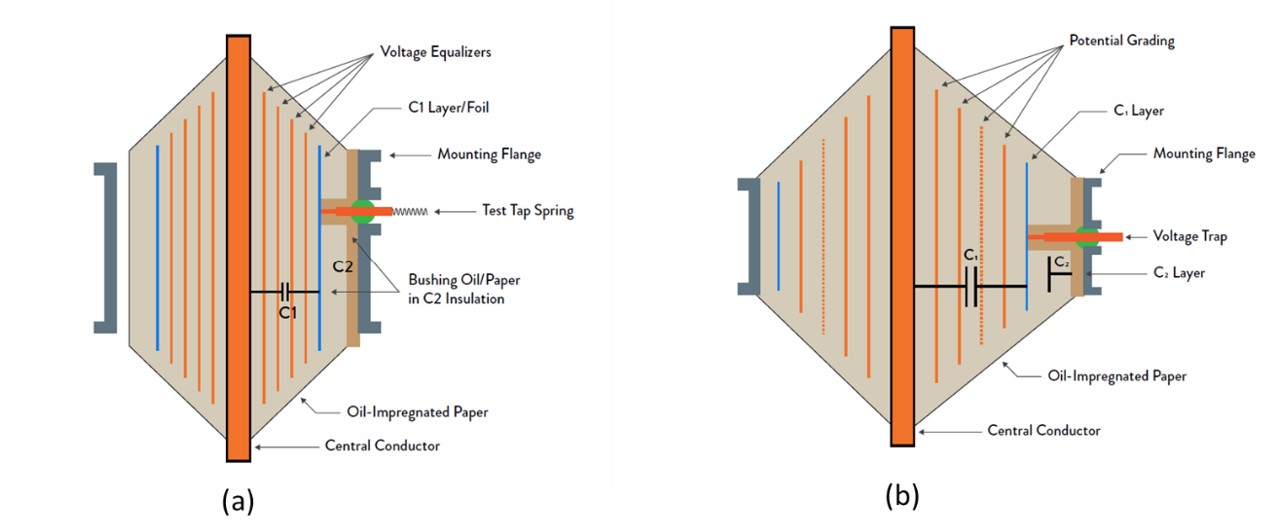
The C1 capacitance is the main bushing insulation measured from the conductor to the bushing tap (see Fig. 3). The C2 capacitance is the insulation/oil from the outermost capacitance layer to ground. Bushings rated up to 69 kV, on the other hand, have a built-in C2 capacitance that is dependent upon outer layers of paper with glue and an oil gap (Fig. 3a). This C2 capacitance could be influenced by external factors such as insulator surface contamination, and air and oil surrounding the bushing. Bushings rated at 115 kV and above have C1 and C2 capacitance that are influenced mainly by on the bushing condenser paper, which leads to more reliable capacitance and power factor test results (Fig 3b). If time is limited for the testing, the C1 DFR capacitance and power factor testing should always be performed.
Test Lead Connections for C1 DFR Testing
To perform C1 capacitance and power factor DFR testing of a bushing that is not installed on a transformer, the HV supply lead should be connected to the conductor, and the current measuring lead should be connected to the test tap or voltage tap (see Fig. 3). The ground lead of the test instrument should be placed on the same ground as the bushing flange ground.
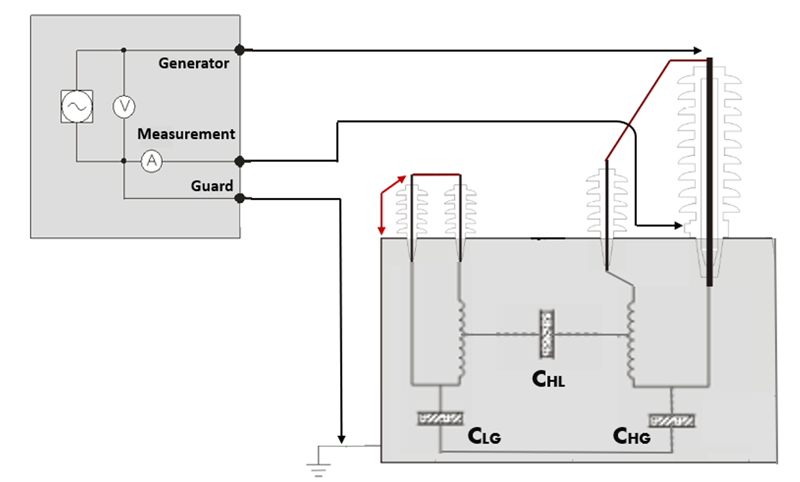
For a bushing installed on a transformer, the connections are similar to when it is not installed. The HV lead should be connected on the conductor, and the current measuring lead should be connected on the test or voltage tap (see Fig. 4). However, in this case, the windings on which the tested bushings are installed, including the neutral if available, should be shorted (Fig. 4). The Figure shows an example for a two-winding transformer. All other bushings that are not tested should be shorted and grounded.
Test Lead Connections for C2 DFR Testing
Performing C2 capacitance and power factor testing for bushings above 115 kV may be worthwhile, as these bushings have a defined insulation path (see Fig. 3b). To perform C2 capacitance and power factor DFR testing of a bushing that is not installed on a transformer, the HV supply lead should be connected to the test or voltage tap, Fig. 3 and the current measuring lead should be connected to the conductor. The guard lead should be connected to the flange.
For a bushing installed on a transformer, the connections are similar to when it is not installed. The HV lead should be connected on the test or voltage tap, the current measuring lead should be connected on the conductor, and the guard lead should be connected to the ground. Also, in this case, the windings on which the tested bushings are installed, including the neutral if available, should be shorted. All other bushings that are not tested should be shorted and grounded.
Testing Mode & Steps to Take Before Starting Test
Before starting the testing, the bushing surface should be cleaned with plain rags. If a cleaning solution is used, ensure it does not leave a slight film residue on the bushing surface that could influence the testing results. Consult with the bushing manufacturer for recommended cleaning solutions. In most cases, using a clean, dry rag is sufficient. Furthermore, the ambient temperature should be recorded, and if the bushing is installed on a transformer, the top oil temperature should be recorded. The bushing temperature can then be calculated as the average of the top oil temperature and ambient temperature, as shown in Eq.1;
![]()
where,
Tbody is the bushing temperature;
Tamb is the ambient temperature;
Ttopoil is the top oil temperature of the transformer in which the bushing is installed.
The instrument settings for C1 testing should be Ungrounded Specimen Test mode “UST” and for C2 testing, should be Grounded Specimen Test “GST” mode.
The voltage for C1 testing is 200 V or 140 V RMS. If the testing is conducted in an electrically noisy environment (e.g., high levels of EMF), such as near energized equipment or a high-voltage, direct current substation, a higher voltage (e.g., 2000 V or 1400 V RMS)—may be needed. To supply a higher voltage, a voltage amplifier needs to be connected to the DFR measuring equipment.
When measuring DFR on a transformer, the recommended frequency band is typically 1000 Hz to 1.0 mHz. For bushings, the optimal best practice for a stop frequency is uncertain. If sufficient time is available, conducting the testing from 1000 Hz to 1 mHz for bushings is recommended. The IEEE C57.12.200 states that the frequency band should be at least from 1000 Hz to 10 mHz.
<p=class_1>

DFR Bushing Analysis
In one sense, analysis of DFR on bushings is similar to sweep frequency response analysis (SFRA). Both diagnostic technologies are based on the comparable trace method. The major difference is that SFRA compares impedance traces between 10 Hz and 2.0 MHz, while DFR on bushings compares the power factor traces (dielectric losses) typically between 1000 Hz and 10 mHz.
The bushing DFR trace analysis can be conducted by comparing the following:
• Time-based comparison. Compare measurement traces with a factory baseline or with results from previous routine testing on the same bushing—per IEEE C57.12.200*.
• Type-based comparison. Compare measurement traces with a baseline from the same type of bushing measured in the factory—per IEEE C57.12.200*.
• Phase-based comparison. Compare measurement traces with sister bushings installed on the same transformers—per IEEE C57.12.200*.
Typical Bushing Abnormalities Detected by DFR Measurements
DFR measurements on transformer insulation has been very successful in detecting abnormalities such as high amounts of insulation moisture or contamination. However, abnormalities found by conducting DFR on a bushing, whether it is oil filled or non-oil filled, remains in an exploration phase. More use cases from the field need to be conducted to understand the types of early signs of bushing issues that could be detected. Several users have reported certain types of faults and issues, such as X-wax contamination or shorted capacitive layers.
Assuming a valid C1 DFR measurement, several abnormalities could lead to unusual DFR traces*:
• High moisture content in solid insulation;
• High oil conductivity due to aging or overheating;
• Insulation deterioration (e.g., X-wax and carbon tracking);
• Excessive surface leakage current or badly deteriorated C2;
• Shorted capacitive layers.
Temperature Correction Using Arrhenius Equation
Since insulation properties are dependent on temperature, DFR results need to be normalized to a common temperature, which is recommended to be 20°C for comparison and analysis. If the trace shape does not change over time, the bushing is in good condition. For DFT traces, the equation used for temperature shifting is called the Arrhenius equation (see Eq. 2). Correction from temperature T1 to temperature T2 could be achieved by shifting the frequency on a logarithm scale by factor L , which can be expressed by:
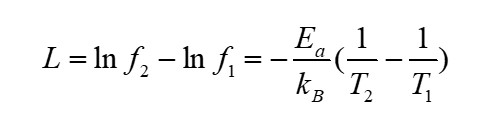
Where:
Ea is the activation energy of the insulation material in eV;
kB is the Boltzmann constant (8.617× 10⁻⁵ eV/K);
T is the temperature (°K) of the object.
Temperature correction is necessary for all three types of analyses: time-based, type-based, or phase-based. If all three bushings on a transformer are tested at about the same time, the phase-based approach may not require a temperature correction for proper analysis.
<p=class_1>
Time-Based Comparison
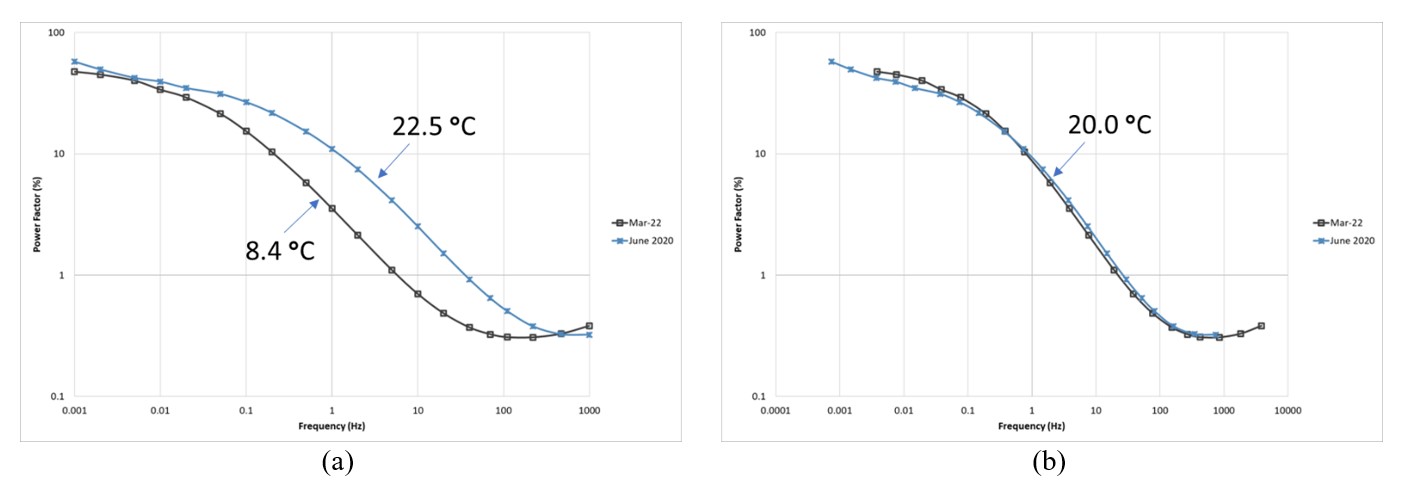
To perform a time-based comparison analysis, proper baseline DFR capacitance and power factor traces are needed. Time-based comparisons are made by comparing the DFR traces with baseline DFR measurement results. The baseline measurement can be obtained from a factory test or previous routine testing. Before a time-based analysis is performed, the measurements need to be corrected to 20°C using the Arrhenius Equation (Eq. 2). Fig. 5 shows power factor (PF) measurements of a 138 kV OIP bushing. The first routine testing of the bushing was made in June of 2020. The average temperature (calculated according to Eq. 1) at the time of the testing was 22.5°C. This test may be considered the baseline measurement for all future DFR testing comparison. In March 2022, the testing was repeated on the same bushing, and the bushing temperature was 8.4°C. A comparison of the DFR power factor (PF) traces measured in June 2020 and March 2022 without temperature correction as shown in Fig. 5a, seems to indicate that the bushing has undergone a significant change in its condition. However, Fig. 5b shows the traces corrected to the reference temperature of 20°C, which indicates the bushing condition has not changed since June 2020.
A general rule is that if the bushing condition is stable and its mounting condition has not changed, the capacitance and power factor curves will remain stable over time, as shown in Fig. 5b.
Type-Based Comparison
If the baseline measurements for the bushing tested are not available, a comparison can be made using DFR measurements from a bushing of identical design and rating type by the same manufacturer. The mounting condition also needs to be similar. A discrepancy may occur if a bushing installed on a transformer is compared with a similar type, manufacturer, and design of bushing, but the bushing is not installed on a unit. Also, for the type-based comparison, the temperature compensation to reference temperature 20°C prior to performing the analysis is important. Fig. 6 shows DFR power factor traces of two 245 kV, 600 A oil-filled bushings. It is noted that even if the voltage and current ratings are the same for the bushings, but the design is different, the DFR traces are not comparable. Fig. 7 shows a case where twelve 34.5 kV RIS bushings were measured. All the bushings are identical bushings from the same vendor. In this case, all the DFR PF traces are aligned.
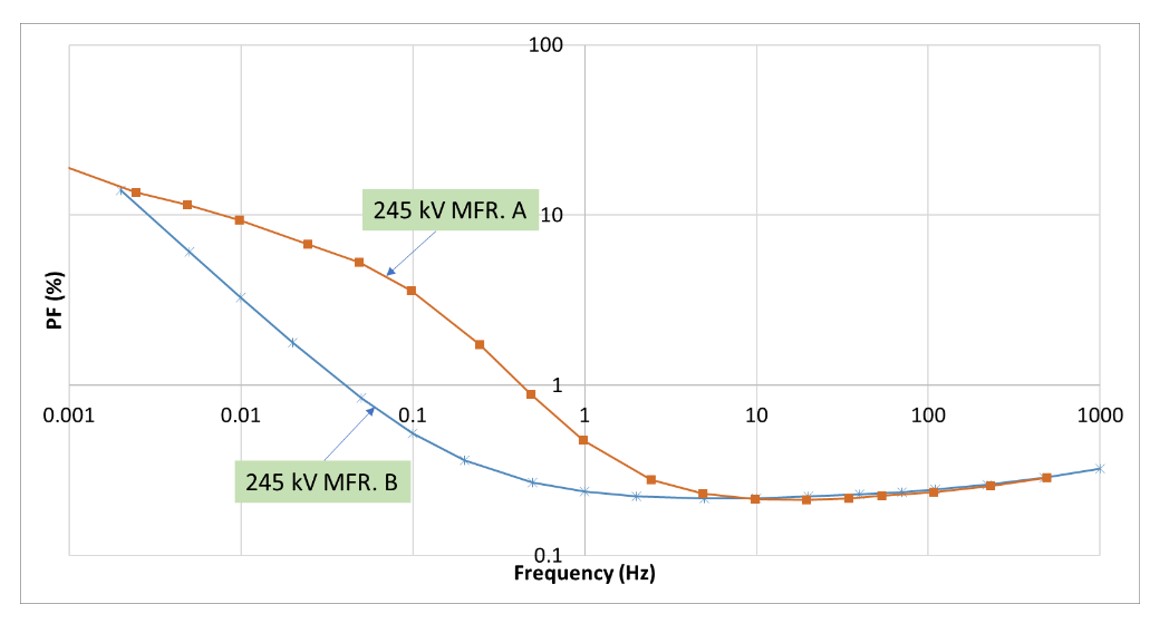
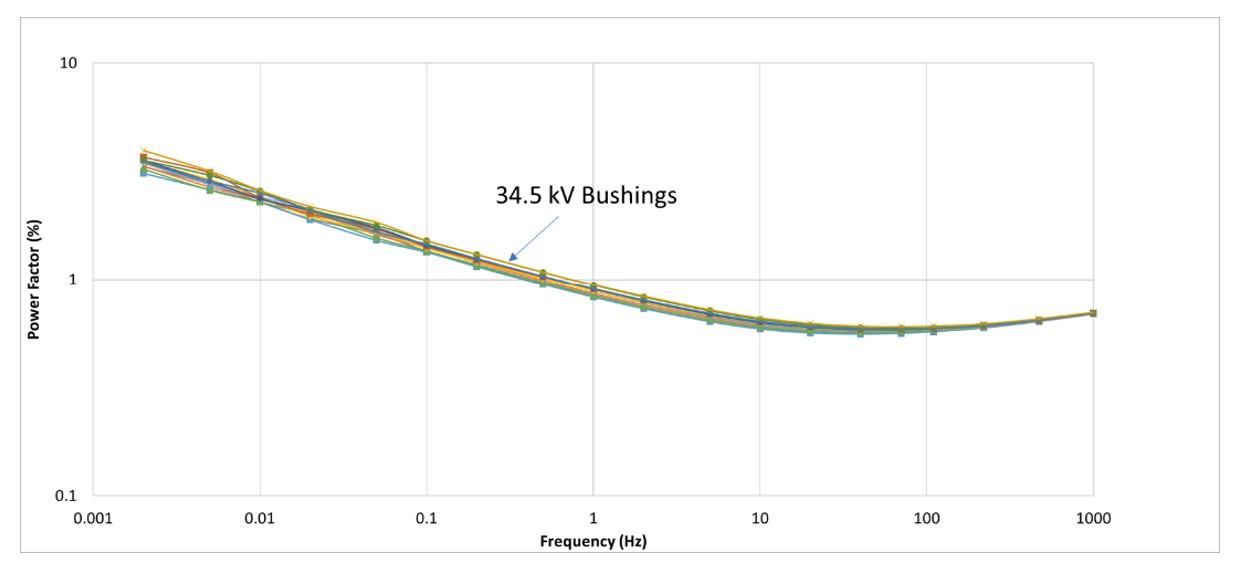
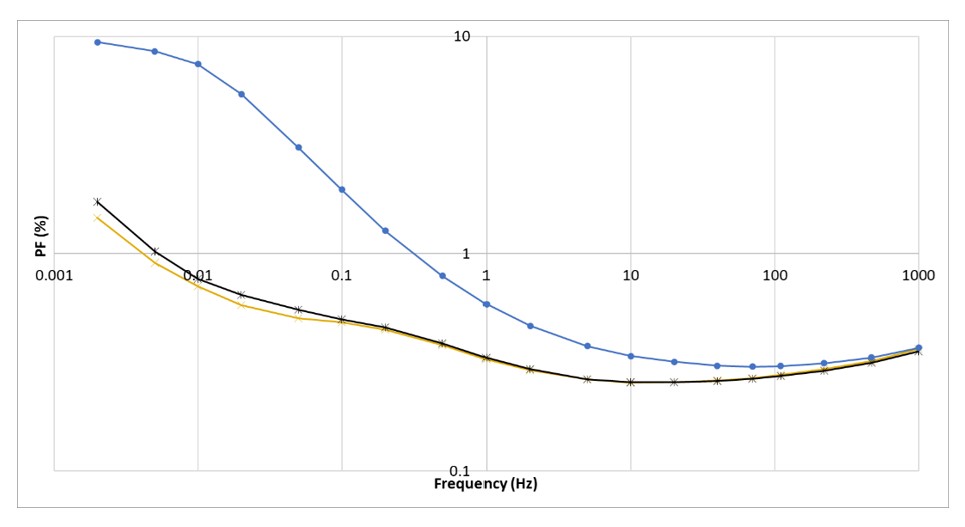
Fig. 8 shows three power factor traces of 115 kV OIP bushings of the same type and manufacturer. The figure shows that two of the traces are aligned, while the third trace exhibits much higher losses. This could be due to bushing abnormalities such as higher moisture or contamination. In this case, closer investigation or replacement of this bushing would be recommended.
Phase-Based Comparison
If all the bushings on a three-phase unit, or three single-phase units (transformers or shunt reactors), are measured, then a phase-to-phase comparison can be performed. If the bushings are measured in the same testing occasion, the analysis could be performed without the need of temperature correction, as the three bushings probably operate at a similar temperature. The phase-to-phase comparison method (also called the phase-based comparison) is a variation on the type-based comparison. The bushings of the transformer or shunt reactor need to have an identical design and similar mounting condition before the analyses are performed. Fig. 9 shows three RIP bushings with the same design and manufacturer installed on a three-phase transformer. All traces are aligned, indicating no deterioration of the bushings.
![]()

Impact of Stray Currents on Bushing Surface
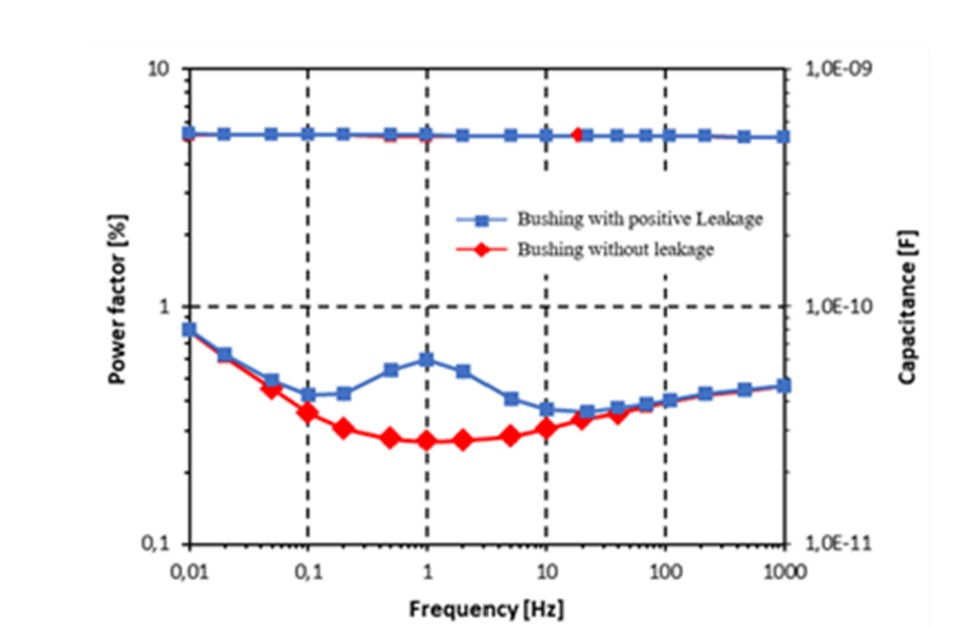
In some cases when performing C1-DFR testing on a bushing installed in a transformer, the traces become negative after a certain frequency (see Fig. 11). This behavior could be due to the influence of surface creep currents on the DFR results. These creep currents or surface leakage currents on bushing surfaces can affect the measured capacitance and power factor at line frequency and/or at lower frequencies. The effect of creep current can be minimized by cleaning the bushing on the air side (porcelain surface), but this may not resolve the issue. In some cases, it may be beneficial to measure the bushing when the bushing temperature is higher than the ambient temperature (i.e., at a higher transformer oil temperature).
Creep currents can also be present on the liquid side of bushing, along the surfaces of the part immersed in the insulating liquid of the transformer (see Fig. 12).
Three different effects are possible*:
• The creep current on the air side top part (T) of the bushing surface, that flows through RT and CT, adds a loss current, leading to the addition of a positive loss peak to the PF trace (Fig. 13).
• The creep current on the air side bottom part (B) of the bushing surface, that flows through RB and CB, adds a loss current, leading to the addition a of a negative loss peak to the PF trace (Fig. 11).
• The creep current on the liquid(oil) side (O) of the bushing surface, that flows through RO and CO, adds a loss current, leading to addition of a negative loss peak to the PF trace (Fig. 11).
Case Study
This case study was discussed in Annex G of IEEE C57.12.200 guide [1,12]. This case involves 25 OIP U-type bushings that were tested for 50/60 Hz power factor, DFR, and dissolved gas analysis (DGA). The testing was performed to identify deteriorating bushings, as many bushings of this type had begun to fail. Before the analysis was conducted, all the data was corrected to a reference temperature of 20°C. Moreover, all the bushings are installed on single-phase shunt reactors. This utility used the following guideline: if the bushing capacitance compared with both nameplate and previous tests has increased by 5%, the bushing should be further investigated or replaced due to possible insulation deterioration. All the DFR measurements were performed at 2.0 kV (1.4 kV RMS).
Fig. 14 shows that 60 Hz power factor testing of four of the 25 tested bushings was normal (green in the figure). However, the DFR traces showed that one of the bushings (OIP 2-green line) was in poor condition, and two of the bushings (OIP 13-blue curve and OIP 14-red curve) are in an initial phase of deterioration.
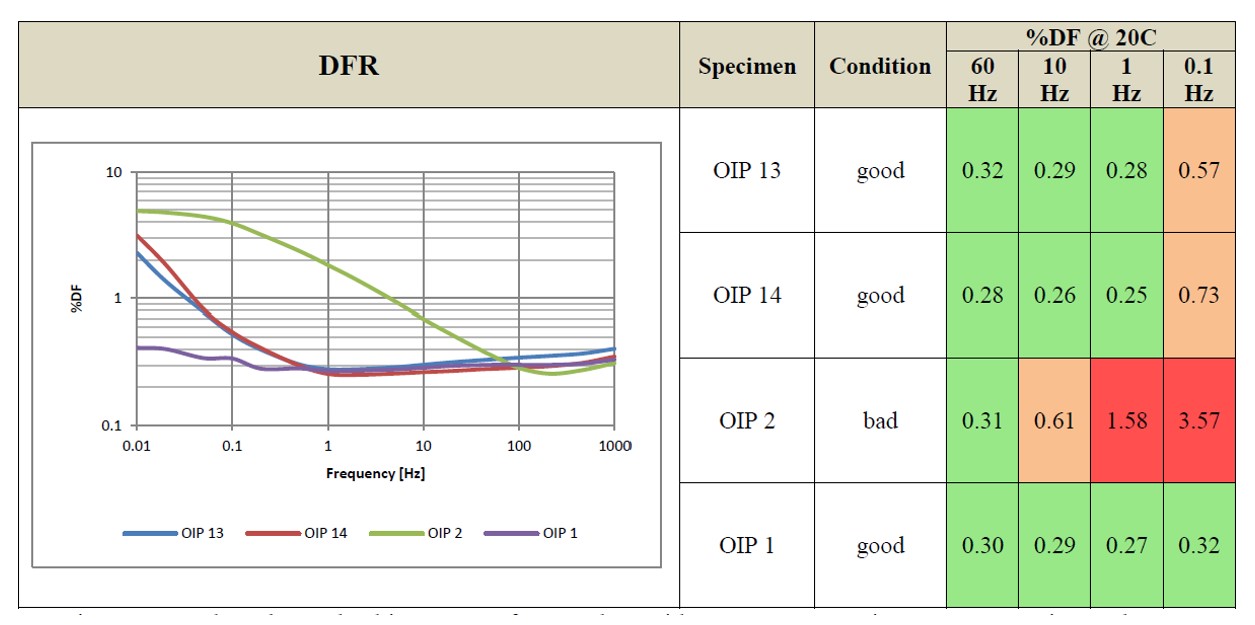
Fig. 15 shows the DFR power factor traces for all 25 bushings. Three out of the 25 bushings are in very poor condition and DGA of the oil also indicates that these bushings have a higher level of hydrogen.
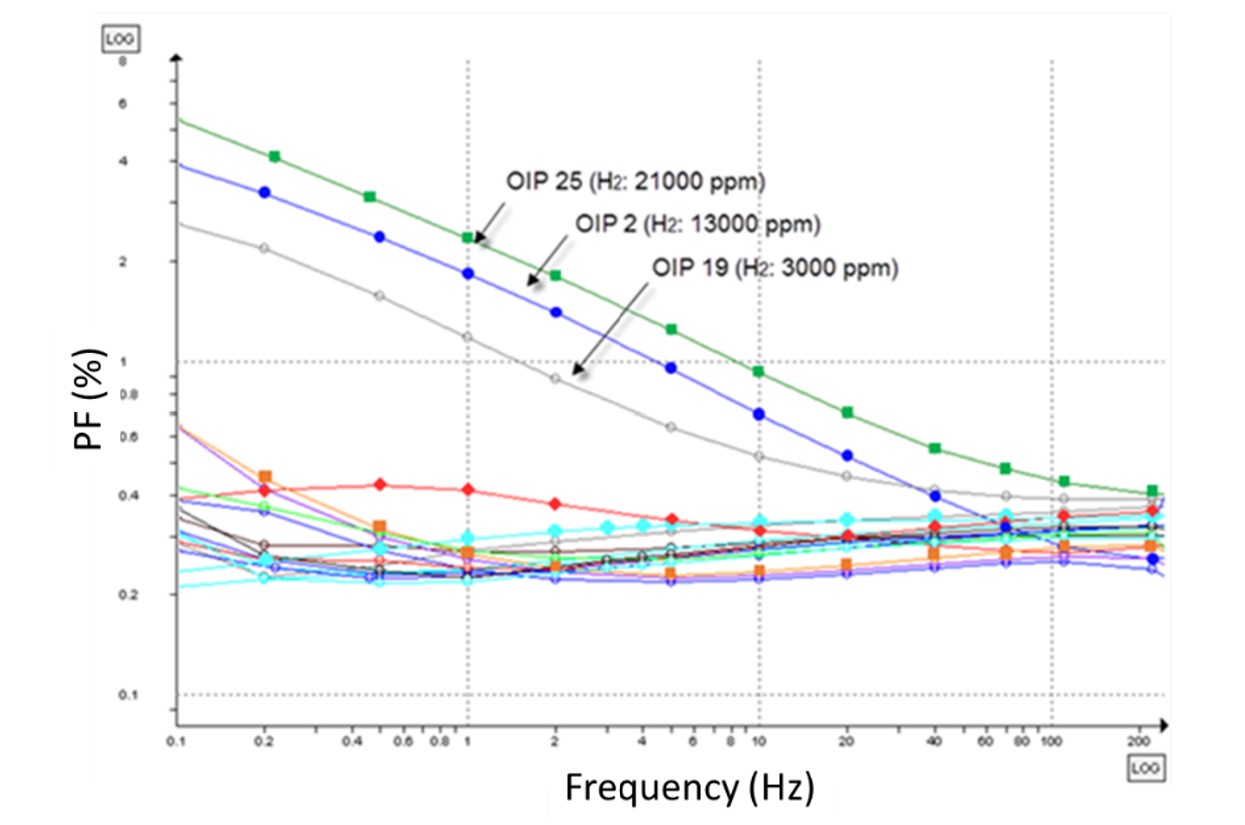
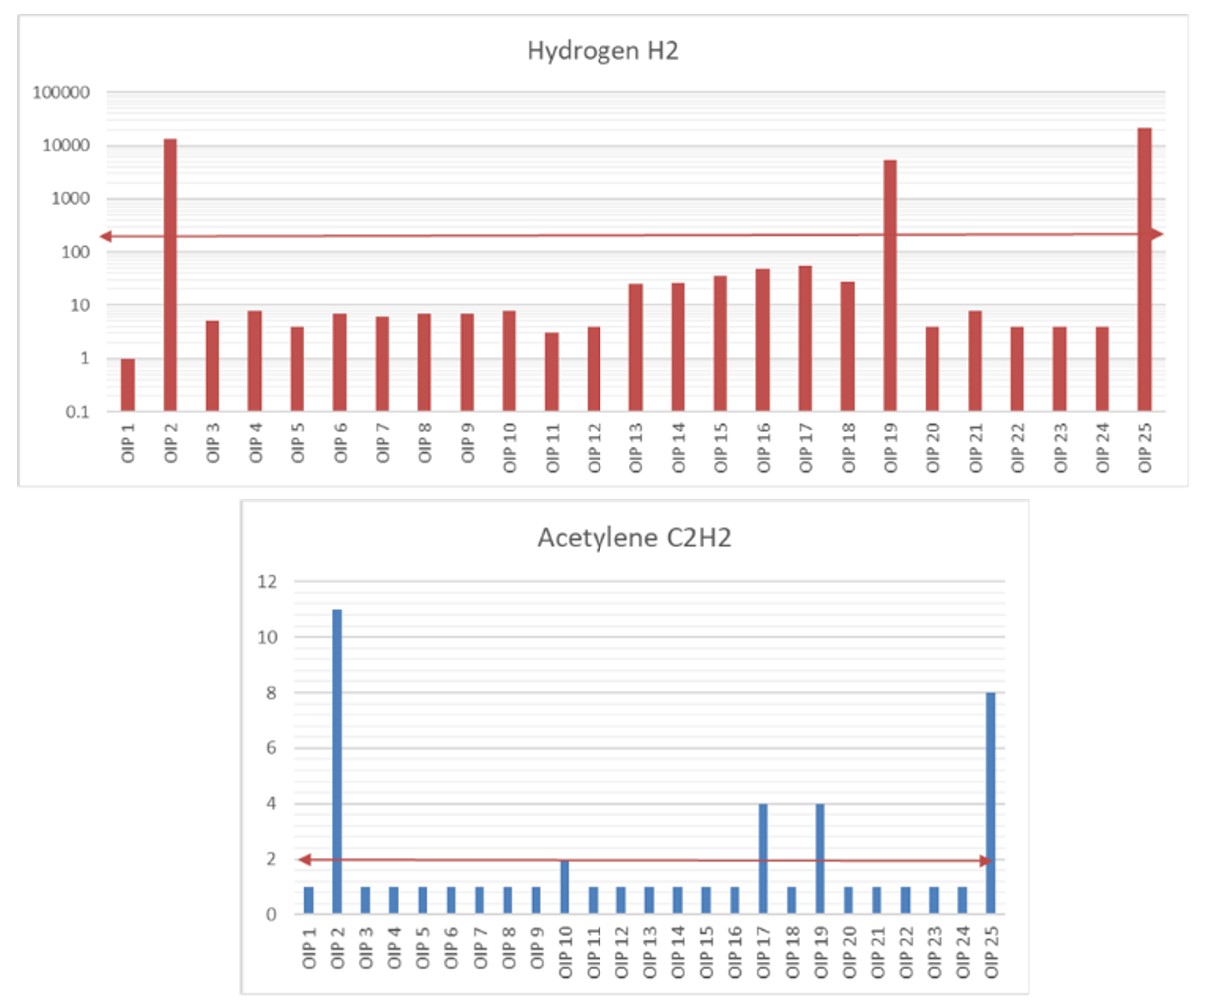
Fig. 16 shows the hydrogen and acetylene (C2H2) levels of the 25 bushings. The three bushings (OIP 2, OIP 19 and OIP 25) have a higher level of hydrogen as well as C2H2. Figs. 15 & 16 indicate that one of the bushings is in its initial stage of deterioration, i.e. OIP 17. This bushing seems also to exhibit higher-level acetylene generation.
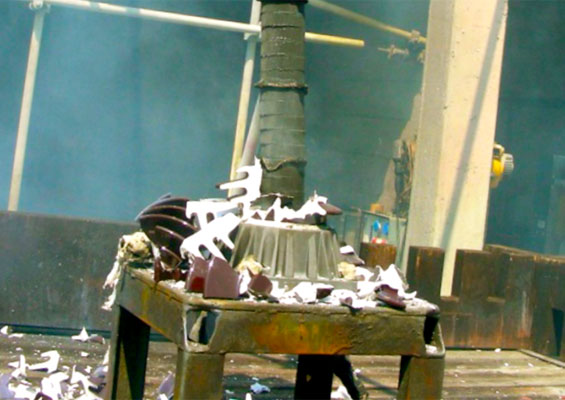
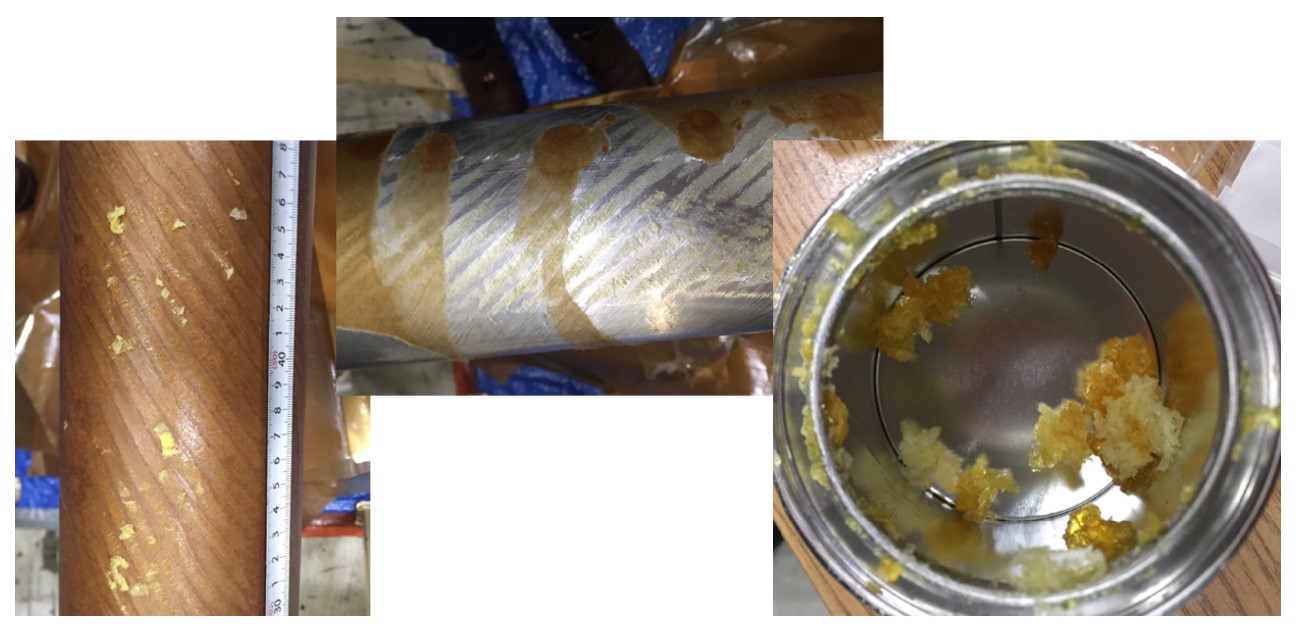
Forensic analysis of the bushings with the highest hydrogen level indicated that the bushings had a deposit of X-wax contamination (a yellowish deposit, shown in Fig. 17). X-wax is a by-product caused by partial discharge activity, generating a higher level of hydrogen and reacting with mineral oil to form solid particles of carbon and hydrocarbon polymers.
Summary
Dielectric Frequency Response (DFR) on bushings is here to stay. In 2022 an IEEE Guide C57.12.200 (2022) describes methods for the gathering of DFR measurements for bushings and various methods of performing the analysis.
The discussion above highlighted points from the Guide and described an example in which DFR testing helped a utility make decisions on what bushings to replace and helped the utility diagnose a bushing that was in good condition. As this testing is becoming more prevalent, more experience and case studies are needed in which different types of abnormalities have been detected and reported. While the average moisture content of insulation in transformers can be determined, this is not currently possible for DFR testing of bushings. The DFR analysis for bushings is more of a comparative method, which can be conducted via a time-based, type-based, or phase-based analysis. The time-based and type-based require temperature correction using the Arrhenius methodology before the analysis is performed. For a phase-based comparison, temperature correction is not necessary if all the bushings have been tested at the same testing occasion.
More experience is also needed to determine the appropriate stop frequency for the testing. In the guide, the stop frequency was set to 0.01 Hz, but this may not provide sufficient data for proper analysis. Several cases have been reported in which DFR detected X-wax type of contamination inside the bushing. In a few cases in which DFR was performed, the traces appeared abnormal, but forensic analysis of the bushings revealed a puncture on a capacitive layer. Most of the reported cases re OIP-type bushings. Additional information is needed on failure modes that can be detected for RIP/RIS bushings by performing DFR. The critical question that needs to be answered is whether DFR can detect bushing problems in an early stage compared to conventional 50/60 Hz capacitance and power factor testing. Based on today’s knowledge, in most cases, the answer is ‘yes’.
Abbreviations & Acronyms
CIGRÉ Conseil International des Grands Réseaux Electriques
(Council on Large Electric Systems)
DFR dielectric frequency response
DGA dissolved gas analysis
EPRI Electric Power Research Institute
IEEE Institute of Electrical and Electronics Engineers
OIP oil impregnated paper
PF power factor
RBP resin bonded paper
RIP resin impregnated paper
RIS resin impregnated synthetic
RMS root mean square
SFRA sweep frequency response analysis
REFERENCES
1. IEEE Guide for the Dielectric Frequency Response Measurement of Bushings, IEEE C57.12.200, 2023. https://ieeexplore.ieee.org/document/10026269.
2. CIGRÉ. Dielectric Response Methods for Diagnostics of Power Transformers. Technical Brochure 254. Paris: CIGRÉ, 2004. https://cigreindia.org/CIGRE%20Lib/Tech.%20Brochure/254%20Dieelctric%20Response%20Methods%20for%20diagnostic%20of%20power%20transformers.pdf.
3. CIGRÉ. Dielectric Response Diagnoses for Transformer Windings. Technical Brochure 414. Paris: CIGRÉ, 2010. https://cigreindia.org/CIGRE%20Lib/Tech.%20Brochure/414.Dielectric%20dianost%20ses%20for%20Transformer%20windings.pdf.
4. IEEE Guide for Dielectric Frequency Response Test, IEEE C57.161, 2018. https://ieeexplore.ieee.org/document/8571325.
5. CIGRÉ. Transformer reliability survey. Technical Brochure 642. Paris: CIGRÉ, 2015. https://e-cigre.org/publication/642-transformer-reliability-survey.
6. IEEE Guide for Diagnostic Field Testing of Electric Power Apparatus – Part 1: Oil Filled Power Transformers, Regulators, and Reactors, IEEE Std. 62-1995 (Revision of IEEE Std 62-1978), 1995. https://ieeexplore.ieee.org/document/467562.
7. IEEE Standard General Requirements and Test Procedure for Power Apparatus Bushings, IEEE Std C57.19.00-2004 (Revision of IEEE Std C57.19.00-1991), 2004. https://ieeexplore.ieee.org/document/1440990.
8. IEEE Standard Performance Characteristics and Dimensions for Outdoor Apparatus Bushings, IEEE Std C57.19.01-2000 (Reaffirmed 2005), 2000. https://ieeexplore.ieee.org/document/836386.
9. IEEE Standard Performance Characteristics and Dimensions for Power Transformer and Reactor Bushings, IEEE Std C57.19.01-2017 ((Revision of IEEE Std C57.19.01-2000), 2018. https://ieeexplore.ieee.org/document/8410922.
10. IEEE Guide for Application of Power Apparatus Bushings, IEEE Std C57.19.100-2012 ((Revision of IEEE Std C57.19.100-1995), 2013. https://ieeexplore.ieee.org/document/6469143.
11. Peter Werelius, Mats Ohlen, Jialu Cheng, and Diego M. Robalino, “Dielectric frequency response measurements and dissipation factor temperature dependence,” 2012 IEEE International Symposium on Electrical Insulation, San Juan, PR, 2012, pp. 296–300, doi: 10.1109/ELINSL.2012.6251476. https://ieeexplore.ieee.org/document/6251476.
12. Diego M. Robalino, Ismail Güner, and Peter Werelius, “Analysis of HV bushing insulation by dielectric frequency response,” 2016 IEEE Electrical Insulation Conference (EIC), Montreal, QC, 2016, pp. 571–575, doi: 10.1109/EIE.2016.7548667. https://ieeexplore.ieee.org/document/7548667.
13. Peter Werelius, Matz Ohlen, and Joacim Skoldin, “Dielectric Frequency Response Measurement Technology for Measurements in High Interference AC and HVDC Substations,” in Techcon Asia-Pacific, 2011.
14. Guidelines on Specification and Maintenance of Polymer Bushings–2022. EPRI, Palo Alto, CA: 2022. 3002024619. https://www.epri.com/research/products/000000003002024619.
15. E. Ermakov, L. Jonsson, L. Melzer, “Approach to DFR analysis for condition assessment of 400 kV transformer and shunt reactor OIP bushings,” International Colloquium on Power Transformers & Reactors, Overhead Lines; and Materials and Emerging Test Techniques, November 2019, New Delhi, India.