Transformer bushings are vital components in high voltage power equipment, serving as the electrical and mechanical interface between transformer windings and external conductors. Reliability of these bushings is essential for safe and efficient operation of power systems. Bushing failures, often due to insulation degradation, moisture ingress, or oil contamination, can lead to catastrophic transformer faults, prolonged outages, and significant financial losses.
This edited contribution to INMR by Alfonso Ambrosone and Christopher O’Donnell at GE Vernova highlights the critical role of advanced online monitoring systems, enabling real-time assessment of bushing health, facilitating early detection of emerging faults and supporting condition-based maintenance (CBM) strategies. Online bushing monitoring systems provide continuous, real-time diagnostics that significantly improve visibility into a transformer’s internal state. By utilizing sensors that track essential parameters such as capacitance and Power Factor (tan delta), these systems offer early detection of insulation degradation, moisture ingress, and thermal anomalies issues that typically evolve gradually and evade detection through periodic assessments. This proactive monitoring approach results in enhanced reliability, reduced unplanned outages, and more accurate performance benchmarking across the transformer fleet.
Three case studies are also discussed which show how trending of online data helped trigger alarms and then to actionable offline test data for pro-active bushing replacement. Such enhanced visibility enables better integration of operational information, empowering Operations Managers to make more informed decisions and significantly reduce risk of major failures.

Key Failure Mechanisms of Condenser Bushings
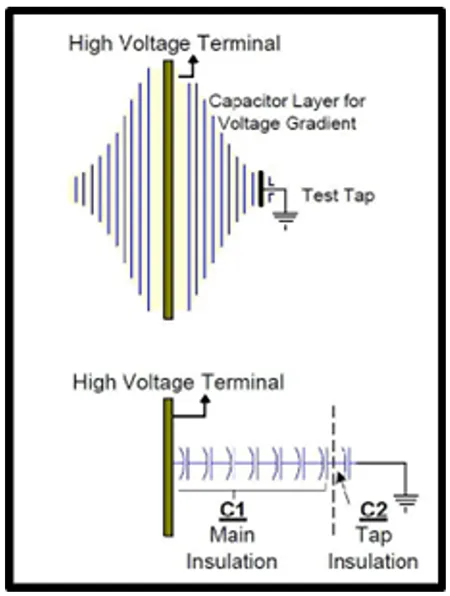
Oil-Impregnated Paper (OIP) condenser-type bushings are widely used in high-voltage transformers due to their excellent dielectric properties and long service record. They are composed of a central conductor wound with alternating layers of paper insulation and conductive foil, forming condenser or capacitive layers. These layers are housed within a protective weather-resistant casing, typically porcelain, and impregnated with insulating oil to enhance dielectric strength. Within the bushing, two primary capacitances exist, designated as C1 and C2 (see Fig. 1). C1 represents the total capacitance between the central conductor and the test tap, which is connected to the outermost capacitive layer and serves as the primary measurement point during diagnostic testing. C2 denotes the capacitance from the test tap to ground and is not part of the active circuit during normal bushing operation.
The capacitive layers are engineered to ensure uniform voltage distribution across the bushing by functioning as a voltage divider. Still, despite their robustness, OIP bushings are susceptible to certain failure modes (typically associated with moisture ingress, oil degradation and seal failure), which can compromise reliability and lead to catastrophic equipment failure if undetected:
• Moisture Ingress:
Degraded seals or malfunctioning breathers can permit ambient moisture to enter the bushing, leading to increased dielectric losses and a rise in the dissipation factor (tan delta). Moisture ingress is one of the primary contributors to accelerated ageing in OIP bushings since it significantly diminishes the insulating properties of the oil-impregnated paper system.
• Oil Degradation:
Over time, thermal ageing and oxidative processes can degrade the insulating oil, resulting in formation of acids and sludge. These by-products reduce dielectric strength of the oil and can create conductive paths, increasing risk of electrical breakdown.
• Partial Discharge (PD):
Presence of moisture, voids, or contaminants within the insulation system can initiate partial discharge activity. PD is characterized by localized electrical discharges that do not immediately bridge the insulation but gradually erode it, potentially leading to complete dielectric failure if left unaddressed.
• Thermal Runaway:
Elevated dielectric losses (often triggered by moisture ingress) can lead to localized heating within the bushing. This internal heat accelerates insulation degradation in a self-reinforcing cycle that can ultimately result in thermal runaway and catastrophic failure.
• Mechanical Cracking:
External mechanical stress, environmental exposure, or manufacturing defects can cause cracks in the porcelain housing. Such damage can result in oil leakage and expose the internal insulation to air and moisture, further compromising the bushing’s electrical and mechanical integrity.

Online Bushing Monitoring
Offline or time-based testing programs for bushings provide only periodic snapshots of their condition, offering no assurance that faults or catastrophic failures will not occur between testing intervals. This inherent limitation calls for re-evaluation of reliance on traditional time-based diagnostic testing as the sole method for assessing bushing health.
On-line bushing monitoring in power transformers based on continuous measurement and phasor analysis of test tap leakage current has been around for 50 years. In recent years, due to an increase in substation monitoring, online bushing monitoring is also growing. This real-time approach is based on the principle of capturing and tracking high-resolution magnitude and phase data of leakage currents, enableing real-time monitoring of C1% and Relative Power Factor changes.
This methodology can be made more accurate by having an external voltage reference. The types of bushing fault conditions that can be detected include (but are not limited to): grading layer failure (C1% increase); moisture ingress (PF% increase); and the results of internal discharge (affecting both C1% & PF%).
These electrical characteristics serve as sensitive indicators of changes within a bushing’s dielectric system, enabling timely identification of deviations from nominal performance. By maintaining constant surveillance, online monitoring systems can effectively capture subtle shifts that may indicate the onset of degradation.
Measurements
The online bushing monitoring system involves the addition of high-resolution and high-precision ammeters at each bushing’s test tap, positioned between pin and earthed flange of the bushing. These ammeters measure currents that are directly proportional to the line voltage at the bushing, thereby providing crucial data on the condition of the insulation. The further chapters describe one of the standard methods of bushing monitoring and the measurements possible by using the total leakage current, measured at the test tap. Fig. 1 shows a typical condenser bushing’s C1 electrical structure that has a physical layer for C2 (controlled C2) by design of the bushing manufacturer. In this design the bushing monitor would be connected to the voltage tap and key electrical parameters monitored are capacitance (C1) and dissipation factor (tan δ), both of which provide insight into condition of the insulation system.

Dissipation Factor – DP (Tan Delta)
Dissipation factor, also known as tan delta, is one of the key parameters used to assess insulation health. This dimensionless quantity represents the phase angle difference between the applied voltage and resulting current in an insulating material, offering insight into dielectric losses.
Ideally, in a perfect insulator, current leads the voltage by 90°, implying no power loss. However, real-world insulators are not perfect and exhibit small amounts of leakage and dielectric loss. Capacitive current ID, resistive current IR, and total leakage currents can therefore be represented in a phasor triangle.
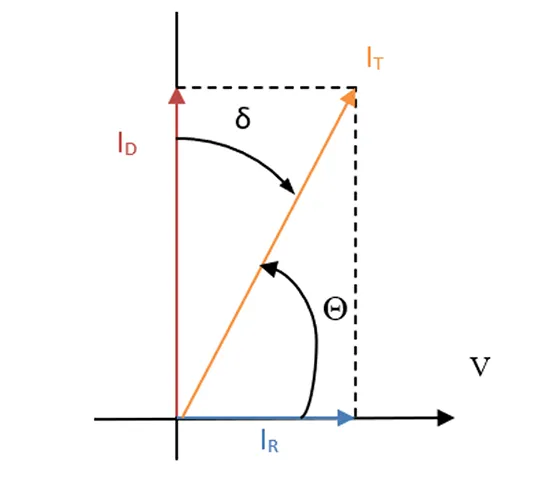
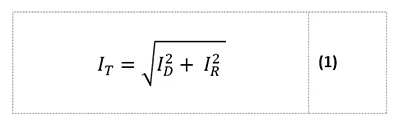
When measuring current at the bushing test tap, total leakage current is acquired, which is the vector sum (hypotenuse) of the capacitive (displacement) and resistive leakage currents “(1)”.
where:
– IR: resistive current (in phase with voltage)
– ID: capacitive current (leads voltage by 90°)
– IT: total leakage current – the vector (phasor) sum (measured at the test tap)
Extracting the resistive component (IR) from the total measured IT in online bushing monitoring systems is challenging since it typically constitutes less than 1% of total leakage current. To measure a bushing’s absolute energy dissipation, the main lead voltage phase would be required, which is not measured in the approach described here. However, the phase between two test tap currents can be measured between phases A and B and A and C.
Measured current inter-phase angles at the test taps provide information on the relative change of δ; if both δA and δB increase by the same amount, the relative change will not alter. The relative change of each δ (A, B, and C) can be calculated from the measured angles in an arbitrary frame of reference.
In addition to the challenges stated above, it must be considered that ambient and operating temperatures will affect readings by causing fluctuations, especially of the resistive component. To allow accurate online tan delta monitoring of bushings, temperature compensation algorithms may be applied, referencing a baseline at 20°C, which helps ensure reliable analysis.
Change in Bushing Capacitance
Dielectric strength of a bushing is defined by the C1 capacitive layers, consisting of paper and foil meticulously wrapped around the central bolt conductor. Integrity of these layers is crucial for maintaining proper insulation properties. If a foil layer fails, the C1 capacitance would increase, leading to a corresponding rise in leakage current at the bushing test tap. This increase signals a potential degradation in a bushing’s dielectric properties.
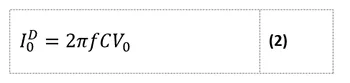
Continuous bushing monitoring, based on measurement of bushing leakage current at the test tap, enables detection of changes in the capacitive layers. The amplitude measured at the bushing test tap can be approximated to that of the displacement current amplitude. Thus, for a given nominal operational voltage in the main lead of the bushing, the Capacitance C1 can be calculated using the calculated formula “(2)”.
where:
– ID0: capacitive displacement current (ideal behaviour)
– f: nominal operational frequency
– C: nominal capacitance
– V0: nominal grid operational voltage
Since the ID is directly proportional to line voltage, small fluctuations in system voltage will cause proportional changes in the leakage current. Additionally, capacitance values might change slightly with temperature, especially in oil-impregnated paper bushings, which adds fluctuations to the measurement.
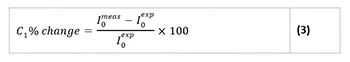
Alternatively, the expected test tap current amplitude can be calculated using the operational voltage, nominal frequency, and the bushing’s nominal C1 again using “(2)”. The percentual measured current amplitude difference relative to the expected value can then be easily calculated. For a given nominal voltage V0 and constant frequency f, this is also the C1 percentage change relative to its nominal value, allowing for the relative change of bushing capacitance to be easily calculated “(3)”.
Polar Plot
The polar plot is a 2D representation of a 3D set of variables using a nonorthogonal basis defined by three normalized vectors at 0°, 120° and 240°; i.e. it is the vector sum of three vectors of length 1 pointing at 0° (A), 120° (B) and 240° (C) each multiplied by its associated parametric value.
Thus, variations common to the parameter set of all 3 bushings, such as temperature fluctuations or power grid irregularities described earlier, are geometrically removed when plotted in the polar plot. However, if one of the 3 parameters changes with respect to the others, this will show in the Polar Plot and angle of the vector sum will indicate which value changed with respect to the others.
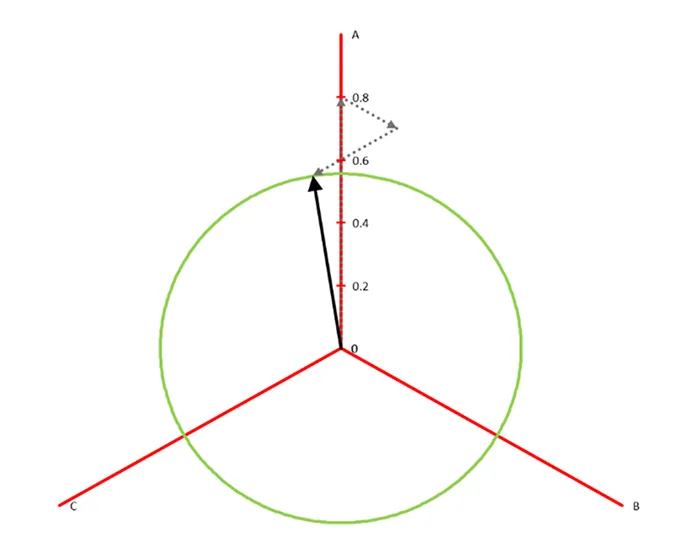
The polar plot approach is a highly effective tool for online bushing monitoring, offering a clear, relative, and intuitive view of the condition of 3-phase bushings by tracking phase angle and current vector changes over time. It is less sensitive to load and voltage changes, since it is based on relative deviations that are often more reliable versus looking at absolute values. At same time it provides a clear visualization of imbalance, indicating the affected phase and provide good tracking as the affected bushing’s vector moves outward (increased magnitude) and shifts in phase clearly visible on the plot.
Field Experience / Case Studies
The following presents customer case studies that illustrate the continuous and dynamic assessment of bushing health while the transformer remains energized.
Case 1: Bushing Power Factor Change
This case illustrates progressive insulation degradation, accurately detected by the online bushing monitoring, and clearly visualized using the Polar Plot.
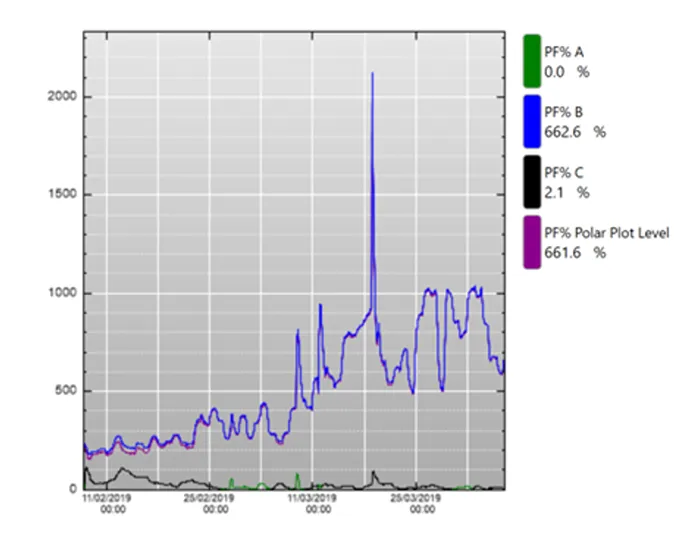
This online bushing monitoring system was monitoring a 50 MVA Generation Transformer at a Solar Power Plant. In early 2019, online monitoring data revealed within a period of a month an increasing trend in the relative dissipation factor (tan delta) for one of the bushings on a three-phase transformer. This significant change of >1000% (relative value!) was visualized through both a time-domain trend and a polar plot, signaling the need for immediate investigation.
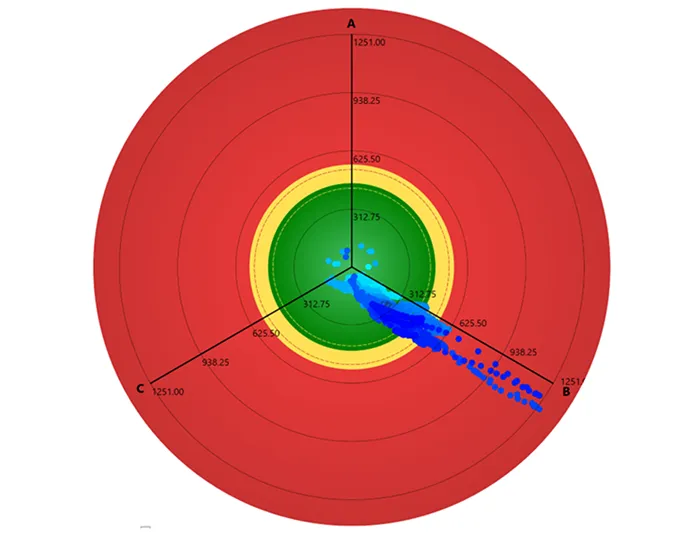
The rising trend in relative dissipation factor for Phase B, LV-side indicated increasing dielectric losses, most likely due to insulation aging, contamination, or moisture ingress. The change was significant compared to the other phases, ruling out system-wide environmental factors and confirming a localized issue. The polar plot confirmed this diagnosis visually, with Phase B clearly deviating from the cluster, reinforcing that the issue was confined to that specific bushing as shown in Fig. 4.

The line chart shows the evolution of the relative dissipation factor over time for all three phases (A, B, and C). Phase B (blue line) exhibits a significant and steady increase in dissipation factor beginning mid-February 2019, with sharp spikes peaking in March as per Fig. 5.
This case demonstrates the effectiveness of online dissipation factor monitoring as a predictive maintenance tool. By detecting subtle but critical changes in insulation condition, the utility was able to take pre-emptive action, replacing the degraded bushing before failure and thereby avoiding unplanned downtime and potential equipment damage.
Case 2: Relative Change in Bushing Capacitance
The following case shows a bushing save detected by the online bushing monitoring and clearly visualized on the Polar Plot.
The online monitoring system detected a sudden change in C1 capacitance of one of the bushings in the primary side of a 220 kV Generation Transformer.
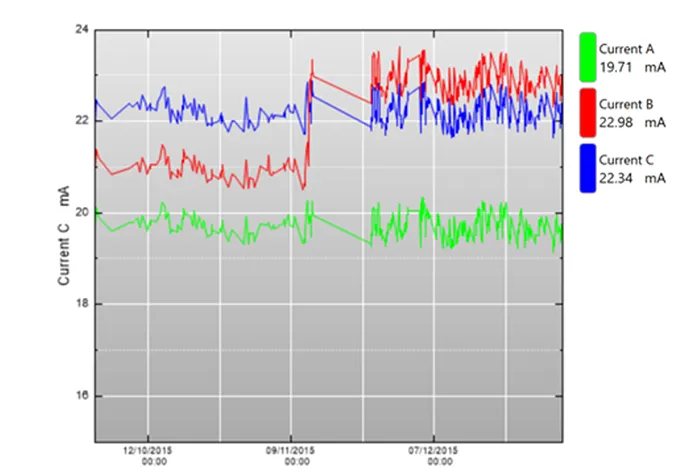
Fig. 6 shows the time-series chart of the total leakage current IT with stable baseline values across all three phases until beginning on November, when the measured current of phase B (green line) showed significant increase.
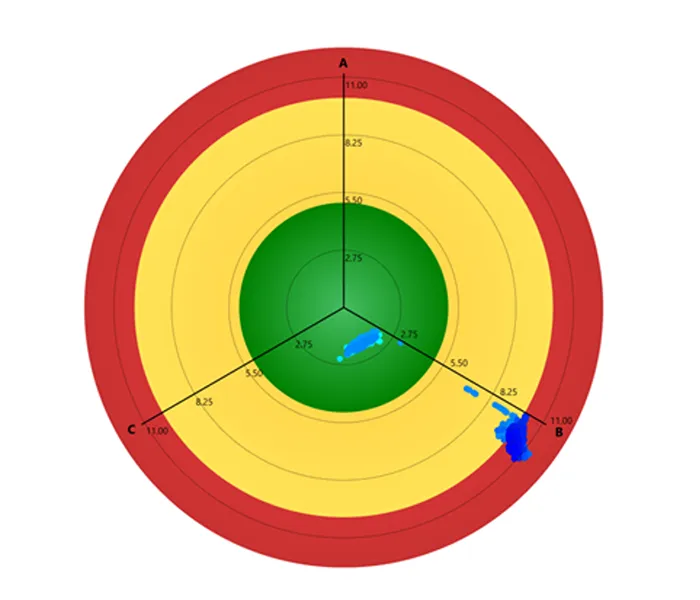
Fig. 7 shows the clear indication of the phase B bushing capacitance change by more than 10% without further necessity for the operator to analyze trend lines. Subsequently a controlled shutdown was scheduled to inspect the transformer and the suspect bushing.
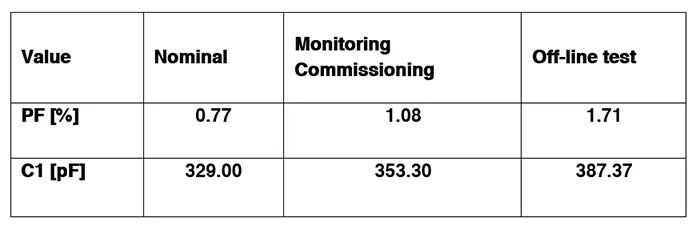
Offline testing at 10kV confirmed abnormal capacitance levels for HV B phase bushing with a C1% increase of 17% from the FAT, respectively 9% change from the latest measurement during commissioning of the monitoring system, as shown on the Table 1.
Thanks to real-time monitoring and clear visualization of the capacitance trend, the utility avoided a potentially catastrophic failure. There was no unexpected service interruption, and the transformer remained in operation for an additional year before planned corrective actions, including a scheduled outage and bushing replacement program, were carried out.

Case 3: Bushing Power Factor Change
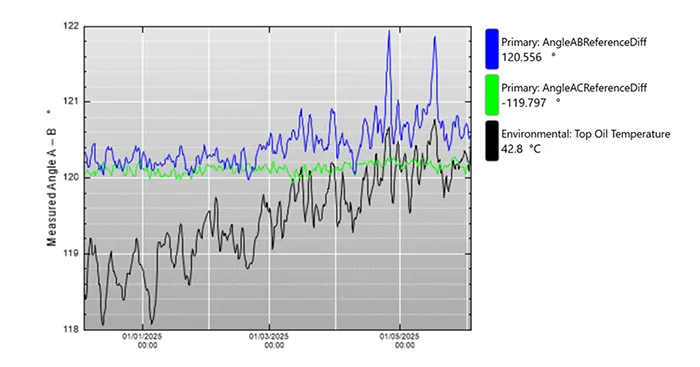
This case study examines the early stages of power factor degradation in a 364 kV substation transformer. The high voltage B phase bushing exhibits a noticeable change in relative dissipation factor (tan delta). Fig. 8 illustrates the increase in relative power factor, from 300% to 1200%.
Temperature dependency is a critical factor when assessing changes in the relative power factor of bushings during online analysis. As the insulation of bushings degrades from its original factory condition due to ageing, moisture, or other influences, there is often a noticeable correlation between rising temperatures and an increase in relative power factor.
In Fig. 9, trend lines of measured inter-phase angles indicate that AB measured value exhibits a stronger temperature dependency in relation to the top oil temperature (transformer load). This is clear that AB inter-phase angle trend line shows increased separation from other at elevated temperatures, and this behavior has been linked to B phase.
Conclusions
Bushing faults are inherently unpredictable unless subjected to regular monitoring. To mitigate this issue, implementation of online monitoring systems provides a proactive and continuous solution. These systems facilitate real-time observation of insulation performance without necessitating equipment shutdowns or manual interventions.
A notable advantage of online monitoring is its capability to identify slowly developing faults, which traditional periodic inspections often overlook. Issues such as gradual moisture ingress or localized overheating tend to evolve incrementally, potentially eluding detection until they reach advanced stages. Continuous monitoring enables the early identification of such trends, thereby supporting predictive maintenance strategies and minimizing the risk of catastrophic failures. As a result, online bushing monitoring signifies a critical advancement in enhancing the resilience and intelligence of asset management practices for high-voltage equipment.
Moreover, when integrated into substation SCADA or asset management platforms, online monitoring plays a pivotal role in digital substation and smart grid initiatives. It bolsters reliability centered maintenance (RCM) efforts and aids in reducing unplanned outages.
Bibliography
[1] Kane, C ; Golubev, A (2005) On Line Monitoring of bushing on large power transformers
[2] Cigre W.G A2.43 (2019) Transformer bushing reliability
[3] Picher, P ; Rajotte, C (2007) Cigre Field Experience with on-line Bushing Diagnostics to improve Transformer
[4] W. A2.34, TB445, “Guide for transformer maintenance,” Cigre, 2011
[5] IEEE Std C57.143-2012, IEEE Guide for Application for Monitoring Equipment to Liquid-Immersed Transformers and Components, IEEE Power & Energy Society, 2012
[6] K. Elmer, J. Lapworth, and M. Ryder, “Transformer bushing monitoring: Implementation and benefits,” in Proceedings of the IEEE International Conference on Condition Monitoring and Diagnosis (CMD), 2008
[7] R. Hartingsveld and P. van der Wielen, “Transformer Bushing Monitoring by Power Factor and Capacitance,” in TechCon North America, 2009
[8] H. Borsi and E. Gockenbach, High Voltage Engineering: Testing and Diagnosis, Springer, 2010
[9] J. D. Belanger and J. Jalbert, “On-line monitoring of high-voltage equipment: Practical implementation and case studies,” IEEE Transactions on Power Delivery, vol. 20, no. 1, pp. 425–432, Jan. 2005
[10] A. Behrendt, B. Harnisch, and M. Krüger, “Modern techniques for continuous monitoring of bushings and tap changers,” in CIGRÉ Session, Paper A2-104, Paris, 2006
[12] R. Brown, Electric Power Distribution Reliability, CRC Press, 2008
[13] Dr. D. Robalino, “Accurate Temperature Correction of Dissipation Factor Data for Oil-Impregnated Paper Insulation Bushings: Field Experience,” 2011