As composite insulators have matured into a mainstream choice on overhead lines, one of the strategic issues for transmission system operators is how best to manage their condition and risk at a fleet scale.
This edited contribution to INMR by Kübranur Varli of Amprion in Germany as part of a European R&D consortium led by I2G and 11 utilities, aims to answers the following key questions:
• how to collect and analyze service experience to trigger appropriate maintenance actions;
• what types of maintenance composite insulators require; and
• how to evaluate the remaining service life and decide on corresponding interventions.
The end goal is to define optimal corrective maintenance procedures, developed through a structured, multi-step program.
The work first establishes practical, standardized guidance for collecting and interpreting field data to support maintenance decisions. It defines typical failure modes (e.g. pollution-induced flashover, flashunder, bird-induced flashover, electrical ageing including corona-driven mechanisms, and mechanical failure). It also offers advice on diagnosing these, starting with basic records and on-site visual observations and progressing to confirmation of root causes of possible failures and related actions.
Building on this foundation, the project identifies infrared, ultraviolet, and visual inspections as presently being the most effective diagnostic approaches, reflecting the prominence of flashunder caused by weak core-to-housing adhesion and/or inadequate rod quality. Such internal defects accelerate under elevated electric fields and therefore must be verified.
These methods were validated through ground-based inspections of more than 500 insulators across 3 countries, covering 1 to 30 years in service, clean and polluted environments, AC and DC applications, and voltage levels from 110 to 500 kV, thereby providing further input to corrective maintenance decisions.
In its final phase, the project linked condition assessment to actionable maintenance through laboratory investigation of 33 composite insulators representing 8 designs in the 66–400 kV classes, with service histories up to 40 years. A comprehensive post-service test matrix—comprising visual inspection, pollution parameters, hydrophobicity, hardness, core-to-housing adhesion, dye penetration, sealing cross-sections, and corrosion of fittings and seals—revealed clear differences between insulator batches and supported practical recommendations for corrective maintenance.
The outcome is an optimized after-service test matrix that underpins asset management strategies and, ultimately, a maintenance guide structured around condition-based maintenance.
Amprion Overview
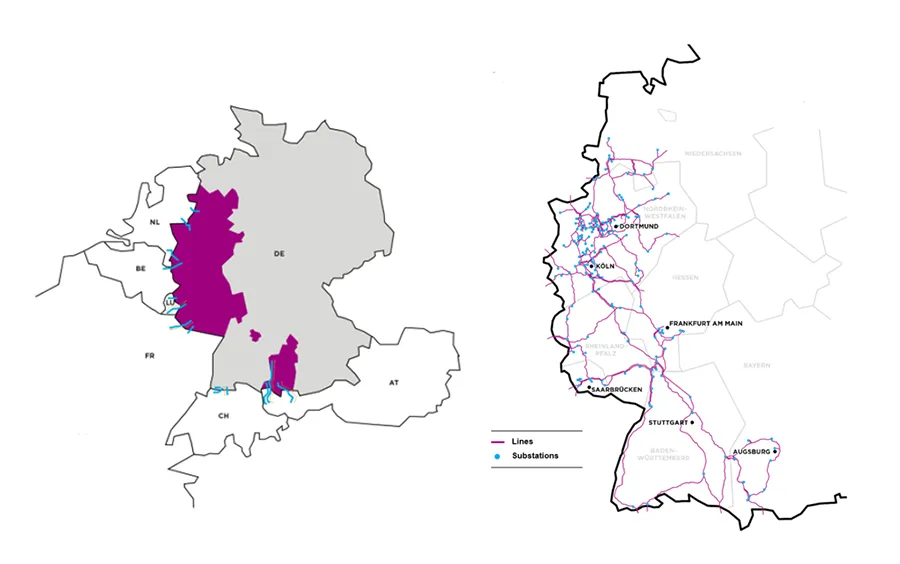
Amprion is one of Germany’s four transmission system operators, responsible for the long distance transport of electricity at extra high voltage. Its 11,000 kilometre grid stretches from the North Sea to the Alps, serving around 29 million people in a region that generates about one third of Germany’s economic output. Within this legally defined control area, Amprion plans, expands, and maintains the grid, operates the system, and safeguards overall power system stability—acting as a vital backbone for society and industry.
To enable energy transition and support industrial decarbonization, Amprion will invest approximately €36.4 billion in grid expansion through 2029. About 3100 employees are delivering a program to upgrade and extend some 9300 kilometers of transmission infrastructure, strengthening security of supply and creating capacity for renewables. The network is closely integrated with neighboring countries via interconnectors to the Netherlands, Belgium, Luxembourg, France, Austria, and Switzerland (see Fig. 1). These “power bridges” enhance system security and lower overall electricity costs in Europe. Among Germany’s TSOs, Amprion operates the most interconnectors.
Composite Insulators at Amprion
Since 2008, Amprion has exclusively used composite insulators for every new construction and refurbishment project, creating a large installed base and gaining expanded operational experience. Today, Amprion has approximately 60,000 composite insulators in its network. Confidence in their performance grew to the point that, in 2019, Amprion introduced a new tower framework family tailored to composites, moving away from designs that retained the option to revert to ceramics. This technology offers clear benefits: smaller towers that require reduced rights of way, facilitating easier permitting and improving public acceptance; lighter components that streamline logistics and installation; and enhanced durability that boosts reliability while reducing lifecycle costs. At the same time, the sheer number of units now in service makes effective maintenance strategies essential: even low individual failure rates can translate into material fleet level risk if not managed proactively.
Maintenance of Composite insulators
To enhance understanding of maintenance procedures for composite insulators under varying requirements and service conditions—and to use optimal maintenance strategy and technical specifications—Amprion participated in the R&D consortium project “Maintenance of Composite Insulators”. This was led by Independent Insulation Group (I2G) along with 11 European TSOs and DSOs: 50 Hertz (Germany), APG (Austria), Energinet (Denmark), E.ON (Germany), Fingrid (Finland), Red Electrica (Spain), RTE (France), Statnett (Norway), Svenska Kraftnät (Sweden), and TenneT (Germany). This consortium provided an effective forum for a broad and open exchange of experiences, as well as a solid foundation for collecting diverse samples for testing.
Goal
The consortium project aimed to deliver optimized maintenance procedures for composite insulators and was supported by two earlier projects that enabled improved purchase specifications, better selection of suitable insulator designs, verifying manufacturing quality, and better management of storage and installation. With large, diverse fleets already in service, the remaining needs are.
1. to standardize how service experience is collected and analyzed;
2. to define appropriate maintenance actions, and
3. to evaluate residual service life to support timely interventions.
The project was organized into 3 parts:
Part 1 establishes principles and recommendations for collecting and analyzing service experience to identify dominant field issues and their root causes, providing a structured evidence base for maintenance decisions.
Part 2 reviews and benchmarks contemporary diagnostic methods for condition assessment, with emphasis on the dominant failure mechanism and evaluates each technique by detection effectiveness, degree of standardization, required operator skills, and suitability for deployment from the ground, a tower, a drone, or a helicopter.
Part 3 analyzes results from after-service tests and proposes a practical after-service testing program, including a test matrix for the maintenance guide, to assess condition and remaining life effectively and to trigger the appropriate maintenance actions. Together, these deliverables provide a coherent framework for condition-based maintenance and life-cycle management of composite insulators.

Failure Mode Analysis & Corrective Maintenance Actions
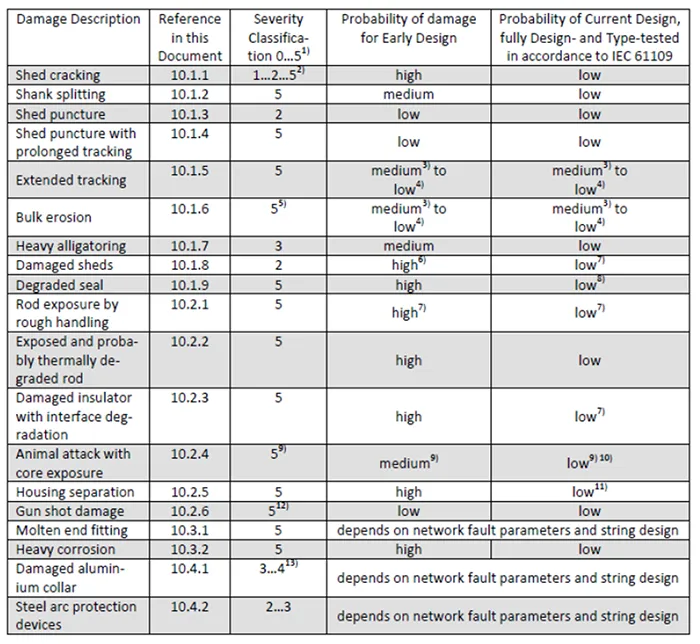
The first part of the project set out recommendations for systematically collecting and analyzing service experience to support maintenance decisions on composite insulators. It identified 6 recurrent failure modes:
• pollution-induced flashover,
• flashover of unknown origin,
• flashunder,
• bird-induced flashover,
• electrical (corona-induced) ageing, and
• mechanical failure
and provides practical guidance for diagnosing each. The approach leads practitioners from assembling basic event information and in-service visual observations, through targeted checks to confirm the root cause, to the corresponding corrective or preventive actions. This is provided in the format of pictorial guidelines.
Three of these guidelines are presented below:
1. Flashunder
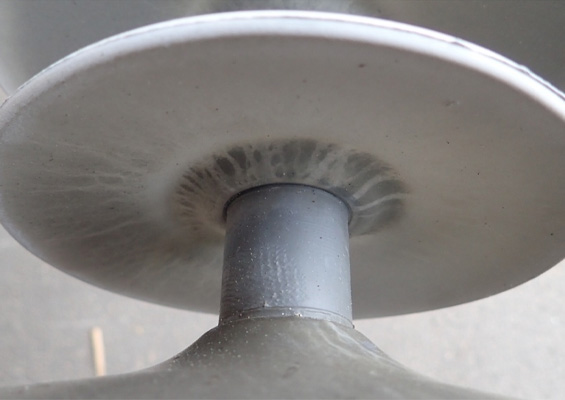
Based on service experience and recent after-service tests, flashunder has been identified as the dominant failure mode for composite line insulators. It initiates as a dielectric breakdown at the core-housing interface, typically due to poor adhesion, with moisture condensing in interfacial voids and partial discharges propagating as a semi-conductive path. Depending on rod quality, this develops as interfacial tracking or progresses to semi-conductive rod erosion and, in severe cases, decay-type fracture. As the path advances, corona raises surface fields, hydrophobicity degrades locally, punctures appear, and the final breakdown transitions to an external flashover.
Analysis proceeds from field evidence to confirmation. Visual cues include localized whitening/hardening of silicone near the high-voltage end and small housing punctures. Infrared thermography is the primary confirmation method, preferably during or after humid periods; the temperature rise, and profile indicate defect location and progression. UV imaging complements IR by revealing intense corona and punctures. Root-cause verification relies on adhesion assessment: quick field checks (stripe or shear-strip) to distinguish cohesive from adhesive separation, followed by more accurate laboratory methods (water-diffusion preconditioning with AC withstand and a pull-off strength test), and a dye-penetration test to screen possible rod porosity. Because overstress accelerates degradation, 3D electric-field calculations should be used to verify grading and, if needed, to optimize corona/grading rings.
Actions prioritize safety and fleet risk: remove units with punctures, rapidly growing IR hot spots, or confirmed poor adhesion; quarantine affected batches and test samples; increase IR patrols in humid seasons; retrofit grading hardware where fields are high; and, if batch-level adhesion issues are confirmed, plan staged replacement, and engage the manufacturer. All observations, measurements, and decisions should be recorded in the database to refine thresholds and replacement criteria across the fleet.
2. Electrical Ageing, Corona-Induced Ageing
Ageing-related deterioration of composite insulators is divided into corona-induced and environment-induced mechanisms, and analysis proceeds from concise context capture to targeted confirmation and proportionate actions.
Assessor documents are timestamp and weather (humidity/wetting), service voltage and loading, site pollution indicators, insulator type and geometry, and clear photographs. For suspected corona-induced ageing, visual checks focus near the high-voltage end fitting and metal parts for localized whitening/hardening of silicone, pitting or burn marks, and tracking aligned with field stress, typically where corona/grading rings are absent, undersized, or mispositioned.
Confirmation relies on daylight UV imaging and 3-D electric-field calculations including insulator, fittings, rings, tower, and conductors, benchmarked against common limits (<18 kV/cm on rings/fittings and <4.2 kV/cm tangential on the housing, averaged over 10 mm as per the latest IEC 61109), with a water-drop corona test used where needed.
Recommended actions are to correct grading hardware (add/reposition rings, smooth edges), replace units with deep erosion or tracking, and verify mitigation with follow-up UV patrols in wet seasons. For environmental-induced ageing, broader exposure-driven changes are sought—chalking or color fading, surface roughening, biofouling, hydrophobicity loss, and tracking/erosion along leakage paths (shed lips, trunk); confirmation includes prompt Hydrophobicity Class measurement (IEC 62073, Method C), pollution measurements, infrared thermography if internal heating is suspected, and, where recovery is slow, a simple dynamic hydrophobicity test to compare material families.
Actions are graded: leave or monitor when ageing is cosmetic and hydrophobicity remains high; investigate further when evidence is mixed; replace or correct when tracking/erosion progresses, hydrophobicity is persistently low, or geometry/creepage is inadequate. Recommended mitigations include washing or cleaning, upgrading to profiles compliant with higher USCD requirements per IEC 60815-3, and selecting more robust silicone material families.
All observations, measurements (UV/IR, HC, ESDD/NSDD), calculations, and decisions are recorded in a database to track trends, benchmark mitigation effectiveness, and refine maintenance strategies.

3. Pollution-Induced Flashover
A balanced procedure for assessing suspected pollution induced flashovers begins with compiling the basic event record (timestamp, location, service voltage, and on site observations) and applying IEC 60815 1 to frame the problem.
Service evidence is then used to test plausibility: inspect insulator for leakage current traces that follow the surface path to distinguish pollution events from lightning; check time of day correlations (in Europe, events often occur at night or early morning under high humidity); and cross reference the outage time with weather data for coincident wetting (dew, fog, drizzle, light rain, wet snow, conductive rain) and pollution drivers (onshore sea salt transport, local industrial sources, etc. Consult lightning detection data, noting that in Europe lightning typically peaks later in the day and leaves characteristic marks.
Design adequacy is then verified against IEC 60815 3 by checking the unified specific creepage distance (USCD) against site pollution severity (SPS), with altitude and diameter corrections, as required. If SPS is unknown, it can be estimated using IEC 60815 1 guidance.
Material and surface condition should also be assessed. Measure Hydrophobicity Class (IEC 62073, Method C) promptly after de energization to limit bias from rapid recovery and document any biological growth that can depress hydrophobicity locally. Quantify contamination by measuring ESDD/NSDD on top, bottom, and trunk at several positions, recording both weighted averages and maxima. Observe discharge activity during humid or windy periods with UV imaging or visually; blue/violet corona indicates low current activity, whereas yellow/orange partial arcs on NaCl contaminated surfaces signal a pre flashover state.
Actions flowing from the findings are:
• upgrade under dimensioned strings to higher USCD, IEC compliant profiles and correct marginal geometries;
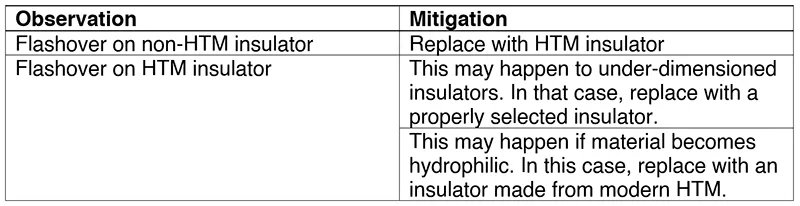
• clean or replace units with persistently low hydrophobicity or poor recovery (consider more robust HTM families);
• schedule targeted inspections and washings for high risk weather windows (e.g. coastal spray seasons);
• deploy permanent pollution monitoring to refine SPS; and
• document all measurements, images, and conclusions in a database to enable correlation studies and condition based fleet planning.

Summary of Part 1
In summary, a structured framework for collecting and analyzing service experience to guide maintenance of composite insulators has been delivered, covering 6 recurrent failure modes: pollution induced flashover, flashover of unknown origin, flashunder, bird induced flashover, electrical (corona induced) ageing, and mechanical failure. It standardizes workflows from basic event capture and visual inspection to targeted confirmation and actions. All evidence is logged in a database to enable benchmarking and condition based fleet planning.
Comparative Assessment of Diagnostic Techniques
The second part of the project surveyed modern diagnostic methods for evaluating composite insulators. Findings from a comprehensive literature survey were converted into critical review on all diagnostic techniques. Each method was judged by its likely detection performance, degree of standardization, required operator expertise, and how practical it is to use from the ground, a tower, a drone, or a helicopter.
There are presently no IEC documents dedicated to diagnostic methods for composite insulators. CIGRE first consolidated practices in 1996, listing visual inspection (including hydrophobicity assessment), infrared (IR) thermography, ultraviolet (UV) detection, combined IR/UV, electric field (E field) measurements, and a then new high frequency high voltage tool.
CIGRE TB 545 (2013) concluded that fundamental principles had not changed materially since, and summarized comparative experience from several laboratories (RSE, EPRI, EGU, STRI, CEPEL) across 3 typical fault types: hidden conductive defects at the core-housing interface, the same with housing puncture, and external surface defects. The review shows that visual inspection is limited to detecting surface deterioration or damage, while UV imaging can reveal internal problems mainly once the housing has been punctured.
Infrared thermography and electric-field probes can identify hidden internal defects; however, E-field probes generally require close access and are difficult to deploy remotely. Acoustic emission offered little added value because corona sources can be directly imaged, and ambient noise undermines measurement reliability. The high-frequency high-voltage tool was considered too immature at the time to assess.
The EPRI “Violet Reference Book” (2017) distilled primarily North American experience and reports that EPRI’s program focused largely on ground-based inspection techniques, with the notable exception of power frequency electric field measurements conducted from a sky lift. It states that visual inspection and corona/UV imaging serve as practical first line, ground based tools; IR can provide supportive evidence in select cases, while E field measurements and leakage current monitoring have more restricted applicability.
Below, a modern critical review is summarized on all diagnostic techniques.
1. IR Thermography
IR thermography operates in the infrared band (longer wavelengths than visible light) and produces images based on temperature. Because defects in composite insulators often dissipate heat, IR can reveal abnormal thermal signatures that indicate underlying issues. IR is widely used and well established for substations, conductor joints, and insulators. For overhead lines it can be deployed from the ground (e.g., bucket trucks), from towers (rare), by unmanned aerial vehicles (UAVs/drones), and by helicopters.
Using the maximum recorded temperature alone as a pass/fail criterion is misleading. The position of the temperature maximum along the insulator is more diagnostic: if the peak occurs away from the end fitting, the high voltage potential has shifted via a semi conductive internal path, indicating a locally short circuited section—especially under humid conditions. In the MCI database, IR findings are captured as maximum overheating (°C) and the length of the overheated section as a percentage of insulator length. Software enables drawing a longitudinal “temperature profile/signature” for trend analysis.
2. UV Cameras
UV imaging operates at shorter wavelengths than visible light and uses bi-spectral imaging to overlay corona emissions onto a visible scene. A UV beam splitter creates two channels: one passes through a solar-blind filter and an image intensifier to a CCD sensor to capture corona, while the other follows a standard video path. The two streams are then combined so operators can precisely locate corona on insulators, structures, conductors, and fittings, i.e. an indication of local electric-field enhancement.
In terms of defect progression, internal semi-conductive defects at the core-housing interface or within the core can, in the early stage, produce external corona even before any housing puncture occurs. There are only a few daylight UV camera manufacturers. Models differ mainly in the visual channel, number of sensors (and gain/enhancement options), and the ability to adjust settings (lowest cost models are often fixed). Some sources advocate “photon count” as a condition metric; this is only valid as a comparative indicator and should not be used as a standalone assessment criterion.
While UV is generally less sensitive than IR for detecting internal defects, it is an essential tool for locating corona. Persistent corona at service voltage often indicates design or assembly issues—e.g., missing or misoriented grading rings, improperly bent split pins—and can be intense due to direct energy supply from metal end fittings.
3. Standard Cameras for Visual Inspections
Standard photo cameras operate in the visible band, between the ultraviolet and infrared regions of the spectrum, and provide valuable complementary evidence for diagnosing internal defects in composite insulators. While they do not “see” heat or corona directly, their images can flag developing issues when certain surface indicators are present, such as localized loss of hydrophobicity (up to hydrophilic behavior), disappearance of biological growth in specific patches, whitening of the housing rubber, or the appearance of surface cracks. In combination with UV imaging, standard cameras are also important for distinguishing water drop corona on the housing from corona originating at metal parts, where UV alone may show only discrete ‘bulbs’ of activity.
4. Measurements of Electric Field
When a composite insulator develops an electrical defect – including internal defects – the local electric field is altered around the faulty zone. To capture this, a portable, in service, manually operated diagnostic probe was developed from an earlier version used on cap and pin insulators and has been applied in the field. The probe measures and records the AC axial electric field along the insulator; conductive or semi conductive defects are identified by comparing the measured field “pattern” with a reference fingerprint from a sound unit. However, its sled construction prevents measurements closer than roughly 15 cm from corona ringed end fittings (approximately the first four sheds at each end), limiting detection of low severity defects near fittings. A further limitation is its performance under polluted, humid conditions.
5. Acoustic Methods
Acoustic diagnostic methods for composite insulators fall into two main categories: measuring acoustic emissions with directional detectors such as parabolic microphones and detecting radio interference using various antennas.
A fundamental limitation is the difficulty of pinpointing the exact source of discharge activity. This can lead to ambiguous assessments—for example, strong emissions from nearby hardware (often not critical) may mask weaker but more consequential activity on an insulator sheath. The long standoff distances typical in field inspections exacerbate this issue. Consistent with earlier investigations, various antennas and “sniffer” devices were found unsuitable for objective evaluation. In practice, these techniques are generally restricted to ground-based use and are better suited to laboratory or substation environments rather than overhead line inspections.
Summary for Part 2
The comparative evidence shows that, despite nearly 3 decades since the first CIGRE reviews, the fundamentals have not changed: the most effective approach remains infrared (IR), and ultraviolet (UV) inspections supported by visual checks. IR and UV address internally driven, electrically stressed defects, while visual inspection corroborates surface condition. By contrast, E field probes are not suitable for remote use and require physical contact and force; no practical field experience is available for the high frequency high voltage tool; and acoustic methods do not provide reliable, objective evaluations on overhead lines. A clear recent trend is the deployment of all three primary techniques—visual, IR, and UV—from drones, coupled with growing use of AI to analyze inspection results and compare condition over time, as reflected in recent CIGRE publications and discussions.
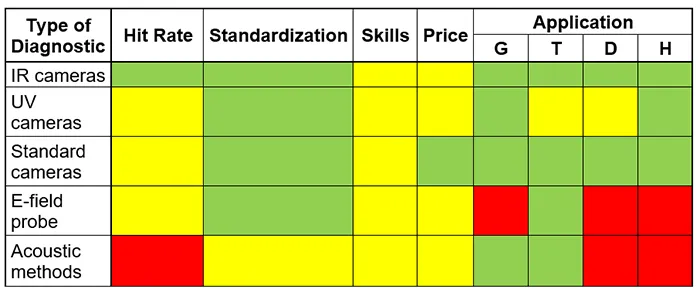
Table 3 summarizes the advantages and limitations of all methods using a traffic light scheme, where green indicates fully acceptable, yellow acceptable, and red not acceptable. Platform abbreviations denote the inspection vantage point: G for ground, T for tower, D for drone, and H for helicopter.
Three optimal diagnostic techniques (infrared, ultraviolet, and visual inspections) were practically tested during ground inspections of more than 500 insulators in 3 countries.
After Service Tests: Linking Condition Findings to Maintenance Decisions
In the third part of the project documented procedures and results of laboratory tests on composite insulators. Tests were performed on 33 composite insulators from eight manufacturers, removed from operational overhead lines with service times ranging from 2 to 42 years (and potentially up to about 55 years). The samples were provided by project participants and were not randomly selected; rather, they were likely chosen based on observed field behavior. This selection bias helps to explain the unusually high incidence of failures linked to poor rod quality identified by the IEC dye penetration test. Based on the findings, a two tier test concept was developed: a basic test matrix and a tailored test matrix. The basic matrix substantially reduces the number of required tests while still effectively identifying units with underlying quality issues, and its effectiveness was corroborated by reviewing comparable historical results from a separate project. The recommended basic set comprises visual inspection in accordance with CIGRE Technical Brochure 481; adhesion testing between core and housing, including water diffusion and pull off methods recently incorporated into the updated IEC 61109; and the IEC 61109 dye penetration test to detect internal rod defects, which may also be considered as a future sample test. Depending on service experience, inspection outcomes, or the visual condition of insulators removed from service, the basic matrix can be expanded into a tailored matrix. Using the basic matrix, an updated benchmarking of the tested insulators was performed; however, these results should be regarded as indicative rather than fully representative, since many samples were withdrawn under suspicion of degraded performance and therefore likely reflect worst case scenarios.
Test Program
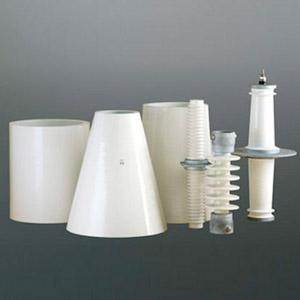
To assemble the test samples, each of the eleven participating utilities was initially asked to provide three insulators, targeting a maximum of 33 units. Following consortium discussions, a few insulators were exchanged to broaden the range of designs represented while keeping the total at 33. This approach ensured a diverse sample set that may reflect slightly different specifications. The test array spans eight manufacturers and multiple design variants—standard, alternating, and under-rib shed profiles, with differing fittings and sealings—and includes line suspension insulators, interphase spacers, and two station support units. Service time covers a wide range from 2 to 42 years (and possibly up to 55 years), with housings made from HTV silicone rubber, RTV silicone rubber, liquid silicone rubber (LSR), and EPDM. The set also spans voltage classes with Um 123 kV, 145 kV, 245 kV, and 420 kV, and mechanical classes from 100 kN to 400 kN SML.
The test program was as follows:
• Visual inspection
• Pollution parameters (ESDD/NSDD)
• Hydrophobicity level
• Hardness
• Hydrophobicity transfer
• Adhesion core/housing
• Dye penetration
• Inspection of cross section of sealings
• Corrosion and saltwater boiling test of fitting/sealing
Visual Inspection
Three internationally recognized guidelines are currently used to evaluate the visual condition of composite insulators: CIGRE’s damage rating in Technical Brochure 481, STRI’s Guide for Visual Inspections, which ranks deterioration and damage, and EPRI’s Guide for Visual Inspection. All three were applied in the earlier assessment [5], and the comparison showed that they yield very similar results. On this basis, the present report relies on the CIGRE Guide for visual evaluation.
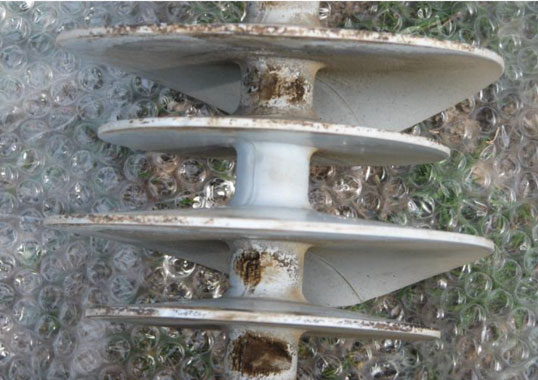
Visual inspections showed that the most observed deterioration was superficial, indicating that the housing material had not undergone significant ageing even after up to 40 years in service. Typical findings included pollution of varying severity, traces consistent with surface leakage current activity, biological growth, localized shed inhomogeneities, paint splatter, minor quality control artifacts such as pronounced moulding lines and injection points on some units—all treated as minor—and the possible onset of sealing layer peeling. Alongside these benign issues, several serious conditions were identified that could justify removal at the next planned outage.
Visual inspection is therefore an essential first step in any test matrix. If no concerns are found, a basic test matrix should be applied as a preventive measure. Where visual observations point to potential weaknesses, tailored test matrices should be developed to confirm the suspected issues and identify the root cause of deterioration or damage.
Pollution Parameters & Hydrophobicity
Equivalent Salt Deposit Density (ESDD, soluble contamination) and Non soluble Salt Deposit Density (NSDD) were measured in accordance with IEC 60815 1.
In practical terms, pollution measurement is not essential for the basic test matrix, as service experience with composite insulators suggests that pollution performance is generally secondary to potential manufacturing weaknesses. However, it becomes important in a tailored test matrix when assets operate in heavily contaminated environments or exhibit flashover or leakage current activity. In those cases, ESDD/NSDD testing provides a valuable baseline for any insulator type—ceramic or composite—supporting a preliminary assessment of environmental pollution severity and, by comparing geometric characteristics (particularly creepage distance) with the estimated severity, an appraisal of the electrical stress the insulator experiences in service.
Also, hydrophobicity was assessed using the IEC 62073 Method C (spray method). The surface appearance was classified into one of seven Hydrophobicity Classes (HC 1–7), where HC 1 denotes the most hydrophobic and HC 7 the most hydrophilic condition. Because this is a visual method, results can depend on observer experience; for non experts, broad categories such as “hydrophobic,” “hydrophilic,” or “in between” are often sufficient for a rough status check. No consistent trend of increasing Hydrophobicity Class with time in service was observed.
In the next step the Hydrophobicity Transfer (HT) was evaluated. This relatively new but promising test method is thoroughly evaluated in [7][8].
The principle behind the HT test is that Low Molecular Weight (LMW) components migrate into the pollution layer and encapsulate any salts. This migration leads to a gradual increase in the electrical resistance of the pollution layer, even if hydrophobicity has not yet fully recovered at the surface. Because HT captures the migration of LMW species that raise pollution layer resistance—even before visible hydrophobicity fully returns—it provides a more meaningful indicator for tailored assessments than surface Hydrophobicity Class alone. This helps to prioritize maintenance actions and supports material/design benchmarking under realistic contamination scenarios.
The results showed that both HTV and LSR materials maintain hydrophobicity-transfer capability even after up to roughly 30 years in service.
In summary, Hydrophobicity Classification (HC) and Hydrophobicity Transfer (HT) results tend to align. For silicone rubbers, HT is the more reliable indicator because it uses a standardized artificial pollution layer that activates LMW species and measures their migration, providing a more objective view of in service performance. By contrast, HC can be biased by the recovery period between removal and laboratory testing, so HC should ideally be measured immediately after the insulator is taken out of service to capture its true in service condition. The findings, consistent with earlier work, show that silicone rubbers continue to generate LMW components even after 30–40 years in service, implying no clear “end of life” for hydrophobicity recovery via LMW migration. That said, variability is significant across formulations, so any suspected reduction in transfer capability is best assessed against a new reference insulator from the same manufacturing batch. The HT test is particularly valuable in a tailored test matrix when units show heavy contamination, evidence of leakage current, or pollution flashovers, and for long served assets (over 30 years) to understand ageing behavior.

Hardness
Hardness was assessed in accordance with IEC 62217. All insulators passed the test comfortably, with margins ranging from 0.1% to 12.5% relative to the 20% limit.
Adhesion Core/Housing
The core–housing adhesion test combines a water diffusion pre stress with a mechanical pull off evaluation and is the only method that directly reveals weak bonding between the fiberglass core and the polymeric housing. Its methods and acceptance criteria have been incorporated into the latest IEC 61109 with a cross reference to the forthcoming IEC 62217 for the water diffusion phase. Short specimens approximately 30 mm long, comprising core and housing with a single shed, are prepared from each insulator. The water diffusion sequence subjects 3 specimens per insulator (top, middle, bottom locations) to 100 hours of boiling, followed by an AC voltage test with current measurement; passing criteria require no puncture or surface flashover and compliance with diameter dependent RMS current limits (Imax ≤ 0.1 mA for D < 50 mm; ≤ 0.2 mA for 50 ≤ D < 90 mm).
For larger diameters, where IEC 62217 does not formally state limits, it is logical to apply the “naked core” criteria: Imax ≤ 0.5 mA for 90 ≤ D < 200 mm and ≤ 1.0 mA for 200 ≤ D < 400 mm (experience above 400 mm is not available). The mechanical phase then subjects twelve measurement points per insulator to a pull off test, with the IEC requirement that the average breaking stress of four measurements per shed exceeds 1.5 N/mm²; the observed separation mode is documented as additional qualitative information. Given its unique ability to detect deficient core–housing adhesion, this test is deemed essential for the basic after service test matrix.
Dye Penetration
The dye penetration (porosity) test was performed in accordance with IEC 62217. A minimum of ten samples per insulator was tested, and as permitted by the standard, specimens with housing were used. The pass criterion is strict: no dye may penetrate into the core of any sample within the 15-minute immersion. Overall, about 50% of insulators formally failed the standard test, though the extent of penetration varied. This represents a new insight into the consortium’s work, as the dye test was not included in the earlier investigations.
In light of these findings, the dye penetration test is recommended for inclusion in the basic after service test matrix as a direct screen for internal rod quality issues.
Inspection of Cross Section of Sealings
To assess sealing integrity, one end fitting from each insulator type was cut open with a metal band saw. The findings revealed a clear weakness only on one insulator: the sealing did not fully cover the internal gap between the metal flange and the rod, leaving an air opening around the insulator. Insulators installed without grading rings experience markedly higher electrical stress—up to about twice current criteria—so any unsealed gap can become a site of discharge activity that threatens the core, housing, and the seal itself.
Consistent with this mechanism, visual evidence of sealing deterioration and potential water ingress was observed, supported by reduced core–housing adhesion near the HV flange and further confirmed by corrosion testing. Together, these results point to a design vulnerability related to sealing that can compromise long-term performance under electrical overstress. Overall, cross-sectional sealing inspections are regarded as a supplementary, tailored investigation to be applied when sealing compromise is suspected.
Corrosion & Saltwater Boiling Test of Fitting/Sealing
Because no reliable standard tests exist to assess the integrity of different sealing designs, a separate research project was undertaken to consolidate current knowledge and develop practical methods; its recommended “corrosion and saltwater boiling” procedure [9] was adopted here as a rapid screening test for sealing quality. The method begins with a galvanic corrosion pre stress intended to challenge the impermeability of the seal at the interface between the metal end fitting and the housing. The end fitting is placed in a metallic container with 10 litres of salt water (tap water with 100 g/L NaCl), and a DC voltage of about 10 V is applied for two hours between the end fitting (positive) and the container (negative).
To focus current where it matters, most of the fitting surface is insulated from the water using plastic foil and tape, limiting the exposed area to roughly 2,000 mm², and an additional negative electrode (a hose clamp) is mounted 10–15 mm from the fitting. This arrangement produces a DC current of approximately 10–15 A; the exposed metal is wiped every 30 minutes to prevent corrosion by products from reducing current flow. After this corrosion step, the fitting is cleaned, placed in fresh salt water, and boiled for 24 hours. It is then cooled to room temperature in water and examined closely for signs of trapped water (ingress), corrosion, or other deterioration. Only one insulator failed the acceptance criteria defined in the referenced method, with clear evidence of significant water ingress and associated rust inside the insulator.
Summary for Part 3
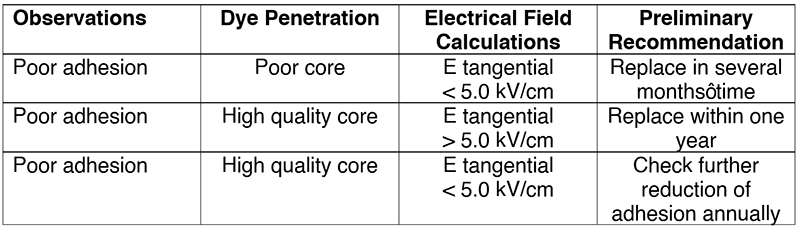
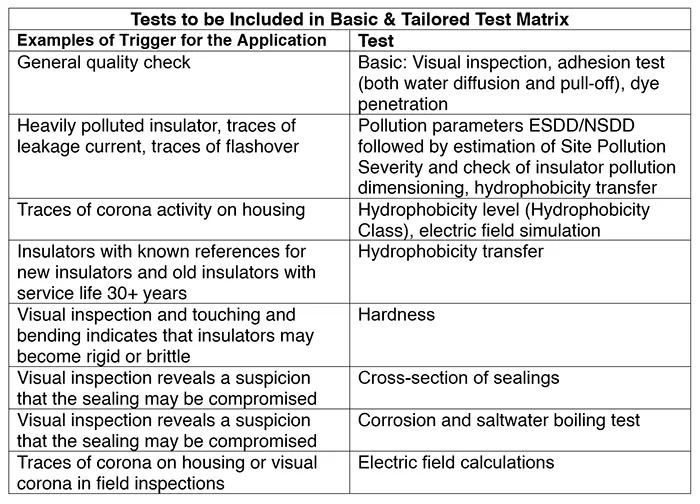
An optimized after service test matrix is proposed after analysis of all the results. Three core elements for the basic matrix are supported. First, visual inspection is an essential starting point—used in nearly all programs except those limited to standalone electric field calculations. Second, core–housing adhesion must be assessed via both water diffusion and pull off tests, based on the dominant failure mode of flashunder driven by weak interface bonding. Third, dye penetration testing is necessary to screen for increasingly frequent rod quality defects. Other methods, including electric field calculations, are considered supplementary: they are not part of the basic matrix but should be selected case by case in a tailored matrix. Table 5 summarize illustrative triggers and corresponding tests.
Summary from Amprion Perspective
This consortium project has provided Amprion with a comprehensive, ready-to-implement framework for fleet-scale, condition-based maintenance of composite insulators—transforming diverse field observations, diagnostics, and laboratory tests into clear decision rules, standardized workflows, and actionable maintenance strategies. It focuses on the failure modes most relevant to Amprion’s all-composite policy (in place since 2008), with particular emphasis on flashunder events driven by weak core–housing adhesion.
The analysis also covers pollution- and bird-induced flashovers, electrical ageing (due to corona and environmental factors), and mechanical failures. The outcome is a coherent set of tools that enables Amprion to reduce the risk of failures and outages, prioritize maintenance interventions, and optimize lifecycle costs.
Examples of how the results can be implemented in internal processes are as follows:
Standardized data capture and governance:
• Adopt the project’s standardized data model and digital forms (including event records, visual findings, IR/UV metrics, hydrophobicity levels, and ESDD/NSDD measurements). Ensure integration of outage logs with corresponding weather and geolocation data to support consistent and high-quality data governance.
Run a tiered diagnostics program:
• Establish visual, infrared (IR), and ultraviolet (UV) imaging as the core diagnostic methods for asset inspections. IR inspections should be prioritized during or after humid conditions, when corona activity is more likely to be detectable. Use UV imaging to pinpoint and localize corona discharges, complementing the thermal data.
• Deploy drones (UAVs) as the default platform for targeted and routine inspections. Utilize helicopters for wide-area scans or when drone deployment is impractical due to range or terrain constraints.
• Follow the project’s specific guidance to select appropriate camera types and standoff distances for IR and UV imaging. Capture and store IR temperature profiles along assets for future comparison. Record location of corona activity as a percentage along the string, enabling precise localization and trend analysis over time.
Apply decision rules while analysis of suspected failure mode:
• Pollution flashover: classify type of pollution; verify specific creepage distance vs. site pollution severity (IEC 60815 3); measure hydrophobicity and pollution parameters when indicated; act by upgrading creepage/profile, cleaning, or using more robust HTM.
• “Unknown-reason” flashover: confirm early morning/high humidity pattern on clean strings; check creepage distance, exclude birds/lightning; add units or move to HTM as needed; deploy leakage current monitoring at hotspots.
• Flashunder: prioritize IR confirmation; verify adhesion (water diffusion + pull off) and rod quality (dye penetration); run E field calculations and optimize grading rings; remove punctured or fast heating units; manage at batch level if adhesion is broadly weak.
• Bird induced flashover: confirm with droppings/nests and typical arc root marks; mitigate with perch guards, shields, and nest management; target July-August peaks; coordinate with ornithologists.
• Ageing and mechanical issues: use UV/field modeling for corona ageing; evaluate the hydrophobicity for environment ageing; fracture morphology plus porosity and make mechanical testing; choose replace/repair/monitor per guide.
Institutionalize a post service test pathway:
• Embed the basic after-service test matrix—including visual inspection (using the Visual Inspection Guide developed within the project), adhesion testing (water diffusion and pull-off), and dye penetration—as a standard quality gate for all removed units.
• Expand this matrix into a tailored, condition-based version when specific triggers are present, such as:
• Heavy pollution contamination
• Suspected sealing degradation or water ingress
Signs of material rigidity or brittleness. Enhance the efficiency and effectiveness of design and procurement processes:
• Require adhesion and dye penetration tests in specifications; include the stress corrosion (brittle fracture) design test; set grading/electric field limits (e.g., tangential ≤4.2 kV/cm on housing); verify specific creepage distance vs. site pollution severity with altitude/diameter corrections.
Integrate with asset management and KPIs:
• Build dashboards to monitor defect rates segmented by type, vendor, and vintage; track infrared temperature difference (ΔT) trends; evaluate mitigation effectiveness; and calculate mean time between events. Utilize thresholds—such as IR growth rates and adhesion pull-off values—to enable risk-based triage and proactively prevent outages. Upskill and scale:
• Use the Visual Inspection Guide and pictorial root cause guides for training; codify SOPs for patrols, lab testing, and replacement triggers; run a pilot on a representative corridor, then scale portfolio wide.
The following benefits can be derived from results of the consortium R&D project:
• Accelerated and more accurate root cause diagnosis, enabling consistent and informed maintenance decisions;
• Prioritized replacements, including batch-level interventions, when necessary, to minimize unplanned outages;
• Enhanced design assurance through improved grading, creepage, and materials selection, complemented by stronger procurement quality control;
• A dynamic data backbone supporting continuous improvement, benchmarking with peer TSOs, and transparent, defensible asset management decisions.
References
[1] M. Jalonen, K. Välimaa, I. Gutman, A. Deckwerth, K. Halsan, M. Leonhardsberger, L. Diaz, P. Trenz, K. Varli: “Benchmarking Composite Insulators: Utility Perspective & European Initiative”, 2023 INMR World Congress, Bangkok, Thailand, 12-15 November 2023
[2] I. Gutman, J. Lundengård, A. Deckwerth, L. Diaz, K. Halsan, M. Jalonen, F. Lehretz, M. Leonhardsberger, L. Rasmussen, P. Rodriguez, T. Schiml, K. Varli, D. Windmar: “Condition-Based Maintenance of Composite Insulators Using Optimal After-Service Test Matrix”, 2025 INMR World Congress, Panama City, Panama, 19-22 October 2025
[3] I. Gutman, J. Lundengård, A. Deckwerth, L. Diaz, K. Halsan, M. Jalonen, F. Lehretz, M. Leonhardsberger, L. Rasmussen, P. Rodriguez, T. Schiml, K. Varli, D. Windmar: “Condition-Based Maintenance of Composite Insulators Using Optimal After-Service Test Matrix”, 2025 INMR World Congress, Panama City, Panama, 19-22 October 2025
[4] P. Sidenvall, I. Gutman, L. Diaz, A. Deckwerth, K. Halsan, M. Jalonen, F. Lehretz, M. Leonhardsberger, L. Rasmussen, P. Rodriguez, T. Schiml, K. Varli, D. Windmar: “Inspection of composite insulators as an input into preventive maintenance”, CIGRE Science & Engineering
[5] I. Gutman, J. Lundengård, P. Sidenvall, A. Deckwerth, L. Diaz, J.-F. Goffinet, K. Halsan, M. Leonhardsberger, M. Radosavljevic, P. Trenz, K. Varli, K. Välimaa, M. Heath, R. Davey, W. Vosloo: “Condition assessment of line composite insulators: after-service test programs and their practical application”, CIGRE Science & Engineering, N. 28, 2023, p.p. 1-37
[6] CIGRE TB 481: “Guide for the Assessment of Composite Insulators in the Laboratory After their Removal from Service”, 2011
[7] I. Gutman, J. Lundengård, F.A. Machuca, D. Lepley, N. Kita, H. Homma, K. Kondo, T. Nakachi, S. Slimani, W. Manzke, P. Carlsson, Y. Wang, B. Robben, G. Lassu: “Evaluation of repeatability and reproducibility of the new-developed hydrophobicity transfer test for polymeric insulators”, ISH-2025, Karuizawa, Nagano, Japan, 24-29 August 2025, paper C3_1_30
[8] P. Sidenvall, J. Lundengård, I. Gutman, L. Diaz, A. Deckwerth, K. Halsan, M. Jalonen, F. Lehretz, M. Leonhardsberger, L. Rasmussen, P. Rodriguez, T. Schiml, K. Varli, D. Windmar: “Application of New Test to Evaluate a Key Parameter of Composite Insulators Hydrophobicity Transfer”, CIGRE Symposium, Montreal, Canada, 29 September – 2 October 2025, 10612
[9] K. Varli, S. Steevens, J. Unterfinger, A. Dernfalk, I. Gutman, J. Lundengård, P. Sidenvall: “Benchmarking of sealing systems of composite insulators: ideas for innovative test methods” CSE, N. 25, pp. 108-131, June 2022