Composite housings have found large application on station apparatus, especially for live tank circuit breakers (CBR). The reasons for this include safety and superior performance under contaminated conditions. In the case of live tank CBRs, the safety aspect plays an important role: composite housings limit the risk of collateral damage from explosions by eliminating the possibility of solid fragments being thrown meters away, as could occur with porcelain housings. Moreover, CBR composite housings are characterized by high performance under contaminated conditions, significantly better than for porcelain, due to the hydrophobic properties of silicone.
Standardized pollution tests are available only for glass and porcelain insulators (IEC 60507-2013). Nonetheless, the standardization process is ongoing to also cover composite insulators, following the wide international experience. IEC TC36 PT 63414 was charged to prepare the relevant standard.
This edited past contribution to INMR by Alberto Pigini, as well as Marco Nosilati, Eros Stella and Rodolfo Saraceni of GE Vernova in Italy reported on results and experience with pollution tests using the salt fog method on CBRs equipped with polymeric housings. The goal was to provide useful indications for CBR design. This experience also offered a reference to support ongoing standardization.

Test Objects
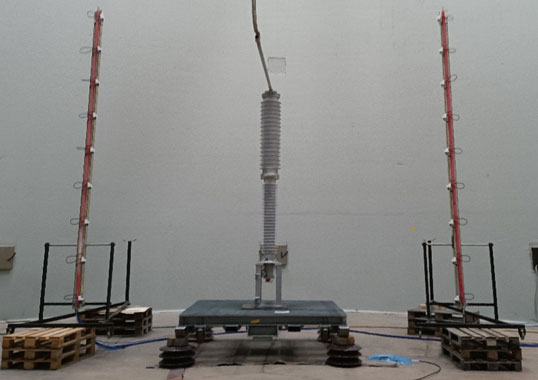
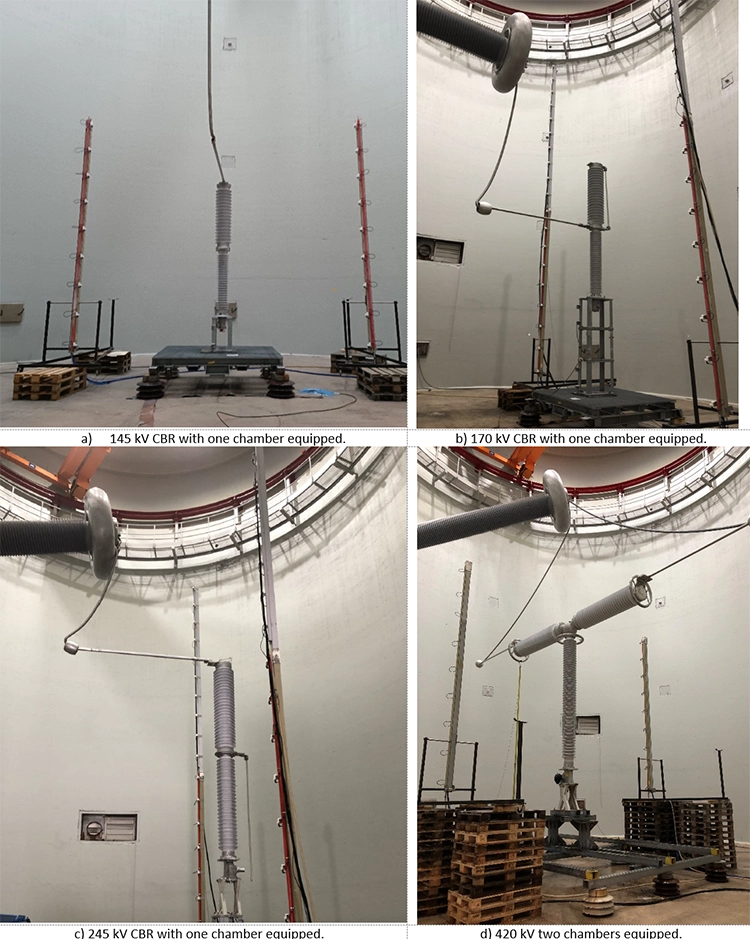
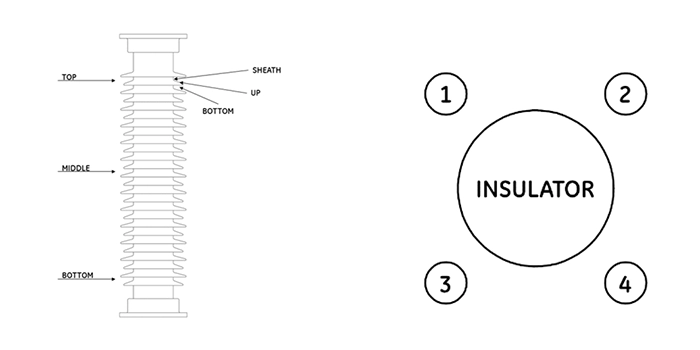
145 kV, 170 kV and 245 kV mono chamber and 420 kV double chambers live tank CBRs with composite housings were submitted to salt fog pollution tests. The housing coating was of silicone HTV type characterized by a content of alumina trihydrate (ATH) greater than 45% in weight to guarantee a major resistance to tracking and erosion. Pictures of the 4 CBRs submitted to salt fog pollution tests, performed at STRI in Ludvika, are shown in Fig. 1.
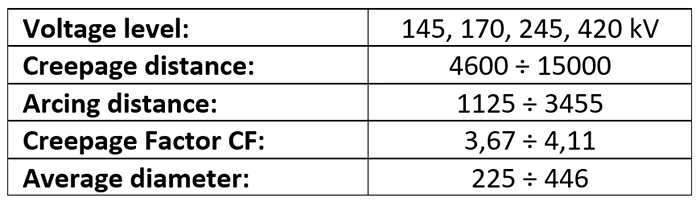
Support and chamber insulators selected comply with all profile indications in IEC 60815-3 requirement. Moreover, according to the standardized General Electric design, minimum USCD of 53.7 mm/kV is selected to comply conservatively with pollution severity up to very heavy conditions. USCD larger than 60 mm/kV was chosen, again conservatively, in case of large insulator diameter. The conservative USCD assumption has not a significant impact on insulator length and cost, since, for AC, the insulator length is generally determined by lightning and switching impulse requirements.
Table 1 summarizes the different shed profile of the CBR insulators and their geometric characteristics.

Test Procedure
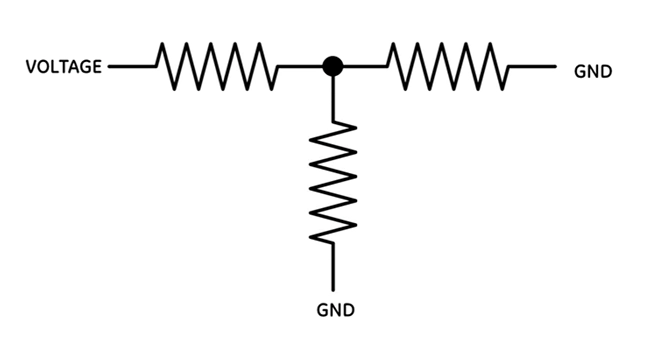
For each CBR, two pollution tests were carried out to verify separately the performance of the support insulator and of the chamber. As far as the tests on the chambers are concerned, in the case of mono chamber, the voltage was fed on one terminal with the other terminal grounded, with the support insulator resulting short circuited. On the contrary, in the case of the 420 kV double chamber, the support insulator results electrically in parallel with the second chamber, as schematically shown in Fig. 2.
Based on customer requirements salt fog withstand tests were performed at 56 kg/m3 for all test objects. Then quick flashover tests were performed to investigate design margins. Both the test procedures are summarized below.
Withstand Test
The object of this test, carried out according to TERNA specifications for polymeric insulators, is to confirm the adequacy of the insulators to withstand the specified salinity at the specified test voltage.
The test procedure is divided in two main parts, with the test object energized at the prescribed voltage and following, when applicable, the indications in IEC 60507:
• Preconditioning:
The test starts with an applied voltage equal to 100% of the specified voltage (in this case Um/√3). The insulator is continuously sprayed using a salt solution having the specified test salinity in accordance with IEC 60507 for 3 hours. Then the surface hydrophobicity is measured, according to the spray method, as fast as possible (without evacuating the chamber) and if the hydrophobicity level is equal HC1 or HC2 an additional hour of preconditioning is applied.
• 12x One-Hour Withstand Tests:
After the preconditioning the test object is thoroughly rinsed with tap water and a series of a maximum of 12 one-hour tests are performed on the insulator at 100 % of the specified test voltage and at the specified test salinity, again with the insulator thoroughly rinsed with tap water after each test.
During all the tests, voltage and leakage current are constantly monitored. After each phase of preconditioning and each one-hour withstand test a 30-minute pause is foreseen to allow insulator rinsing and measurement of hydrophobicity. The wettability class (HC) is measured at three positions along the insulators (top, bottom, and middle) and for each position repeated in 4 sites symmetrically located around the insulators, for each site looking at the wettability of the upper part and lower part of the shed and of the sheath (in total 36 measurements for each insulator, see Fig. 3). From all the measurements an average value of HC is derived.
The test object is considered to comply with the specification requirements if no flashover occurs, neither during the preconditioning phase, nor within minimum 8 of 12 consecutive one-hour tests.
Quick-Flashover Test
The insulator performance under polluted conditions is verified by the salt fog up-and-down method. The object of this test is to compare different insulator design and to get preliminary indications about the applicability of the insulators in specific environmental and pollution conditions.
• Preconditioning Phase
The test object is subjected to an initial voltage of about 90% of the estimated flashover voltage at the specified salinity level for 20 minutes. Then the voltage is raised in steps of 5% of the initial voltage every minute until a flashover occur.
• Up-and-Down Phase
After the first flashover, the voltage is reapplied and raised as quickly as possible to 90% of the previously obtained flashover voltage, then the value is maintained for 5 minutes. Thereafter, the test voltage is increased by steps of 3% every 5 minutes. After a new flashover, the voltage is again applied to 90% of the last obtained flashover voltage, maintained for 5 min and then increased in steps of 3% of the last obtained flashover voltage every 5 minutes until the next flashover occurs. The optimal number of flashovers to be achieved is still in discussion. As a preliminary indication, under discussion within IEC TC36 PT 63414, the minimum number of flashovers to be achieved is fixed in 10. Achieved the 10 flashovers the standard deviation of the last five flashover voltage is to be verified, and if it is higher than 5% the test is to be continued until the standard deviation is lower than 5% or up to a maximum number of 20 flashovers.
The result of the test is the mean value of the last 5 flashover voltages. In the present investigation the test has been extended in all cases up to 20 flashovers, to have indications about the optimal flashovers number.
Test Results
Withstand test
All the live tank CBR successfully passed the test: no discharge occurred during the entire test procedure.
Due the duration, the completion of the test procedure for each object (including preconditioning, withstand tests, and necessary pauses) required to work for at least two working shifts, with each shift of 8 hours duration.
• Preconditioning Phase
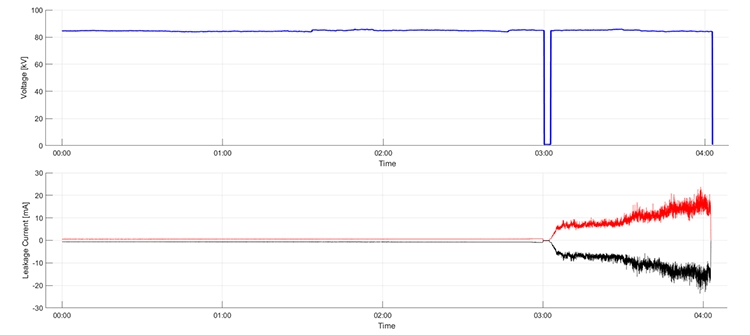
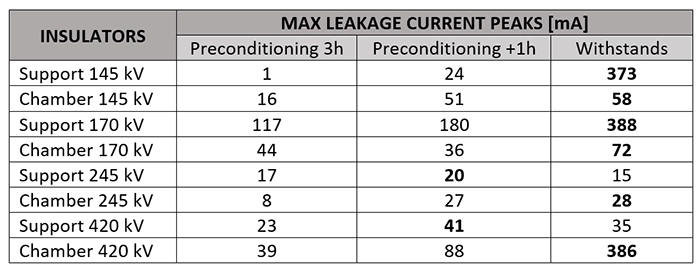
All the test objects maintained the same hydrophobicity class of the new product after 3 hours preconditioning (wettability class HC1-2). An example of the leakage current measured in the first three hours and in the fourth hour is shown in Fig. 4: while the current is negligible in the first three hours a rapid increase is observed in the fourth hour. The maximum leakage currents measured during the first three hours and in the fourth hour for the different objects are summarized in Table 2, where the data are also compared with the maximum value recorded during the entire test procedure (maximum in the withstand cases). As shown in Table 2 and Fig. 4, a rapid increase of the leakage current occurred in the fourth additional hour for all test objects, reaching for some objects the maximum value occurred in the entire test. The data confirm the opportunity to extend the preconditioning phase to four hours in the cases foreseen by the test specification (maintenance of HC1 or HC2 after the first three hours).

• 12 One-Hour Withstand Tests
Additional information on the performance of the test may be obtained analyzing the development of the leakage current and hydrophobicity (HC) during the full test.
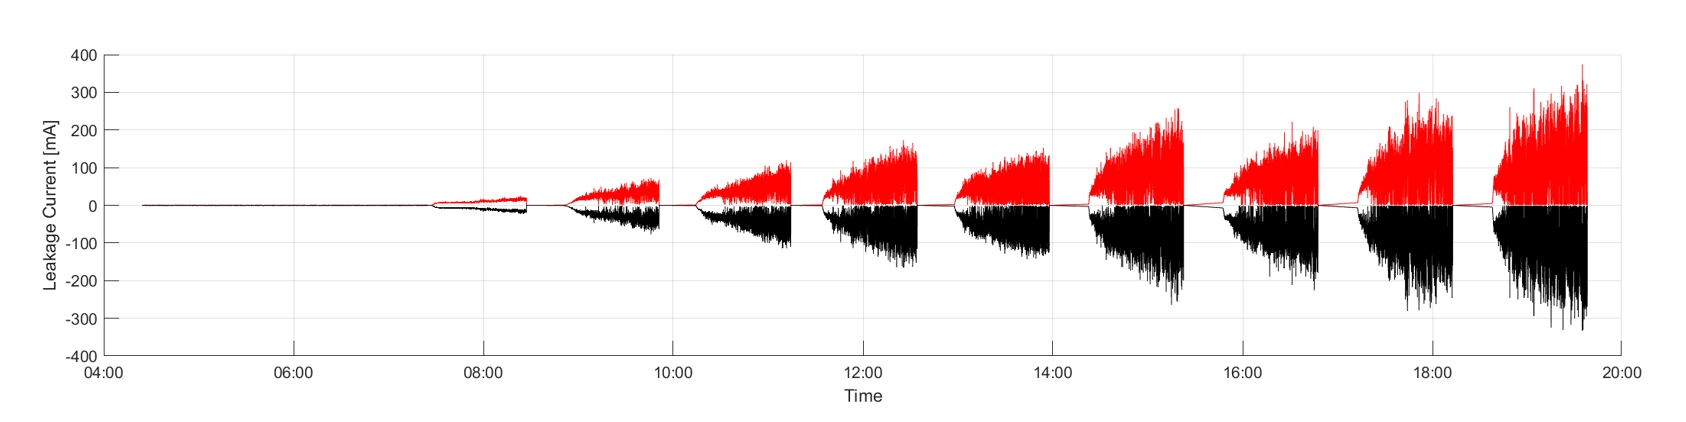
An example of the development of the leakage current is reported in Fig. 5, indicating the increase of the current during consecutive repeated one-hour tests.
The test objects were characterized by different values of the maximum leakage current recorded during the test as shown in Table 2, depending on insulator geometrical characteristics. As an example: comparison of leakage current has shown the benefit deriving from larger distance between shed: 170 kV and 245 kV insulator supports, which are characterized by the lowest and highest distance between sheds, have shown maximum leakage currents of 388 and 20 mA respectively. High leakage current was also measured on the chambers of 420 kV CBR, despite having high distance between sheds, because of the criticality of the configuration tested (support insulator resulting electrically in parallel with the second chamber unit).
As far as hydrophobicity is concerned, average HC values for all test objects, passed from the initial value of 1-2 to about 3 after four hours conditioning and to 4-5 after the complete test.
Quick Flashover
The tests were carried out in sequence to the withstand tests, with a delay of 24 hours. Due to the partial recovery the insulators were characterized by a HC value between 1 and 3.
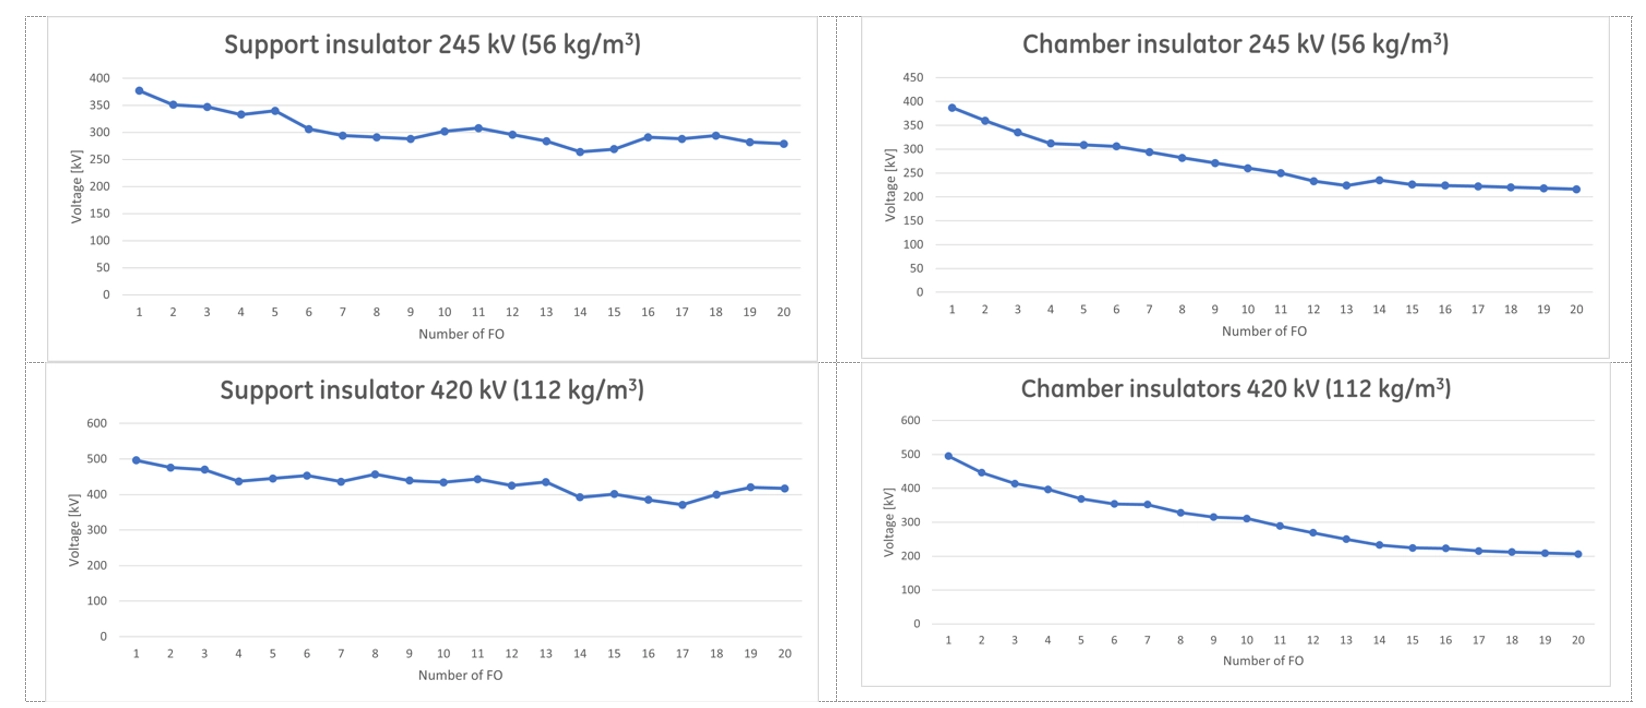
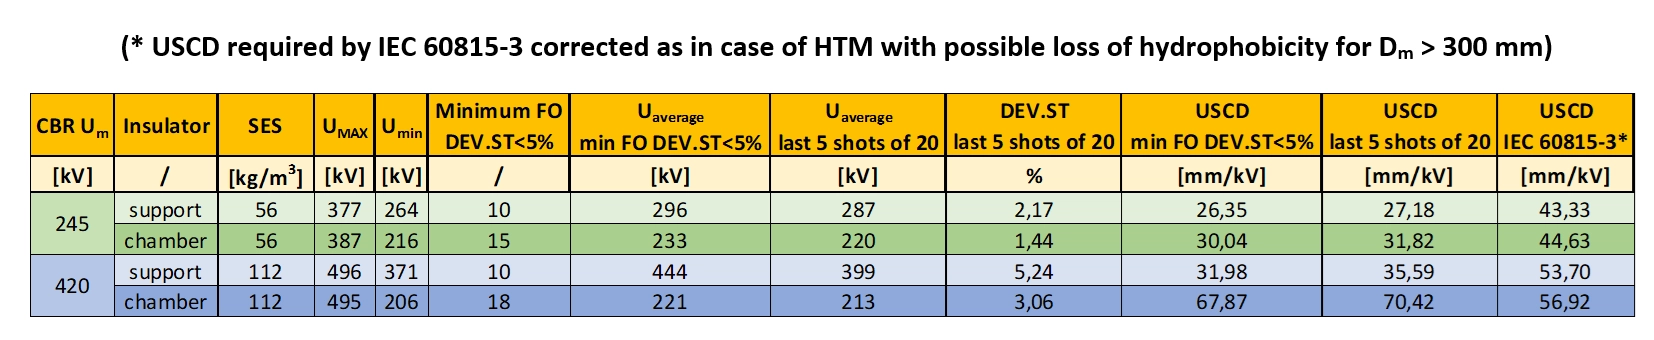
The evolution of the flashover voltage with the number of flashovers, extended up to 20, is reported in Fig. 6 and summarized in Table 3. An example of the correlation between the flashover voltage and the corresponding leakage current is reported in Fig. 7: leakage current increases shot by shot following the flashover voltage decrease (decrease of about 80% from maximum to minimum flashover voltage in the example considered) and hydrophobicity decrease (passing in the examined case from a value of about 2 at the beginning of the test to a value of about 5 at the end of the tests). Based on the data obtained the following indications are derived:
• The flashover voltage reduces with the number of shots, reaching a somewhat stable condition, unless the case of the chamber of 420 kV CBR, due to the peculiar test configuration (see scheme of Fig. 2).
• The condition of standard deviation of 5% for the 5 last flashover voltage values was reached with number of shots between 10 and 18, with the average value about 12% higher than the minimum flashover voltage values measured.
• By extending the number of flashovers to 20, the standard deviation of the last five flashovers resulted generally lower than 3% and the difference between the average flashover voltage and the minimum observed flashover voltages is reduced to 5%. It is therefore recommended to change the requirement for the determination of the minimum number of flashovers, requiring a standard deviation of 3% against 5%.
• The average value obtained in the last 5 flashover voltage values of the 20 flashovers sequence is assumed in the following as a preliminary estimate of the withstand voltage, to compare with the corresponding values obtained with ceramic insulators.
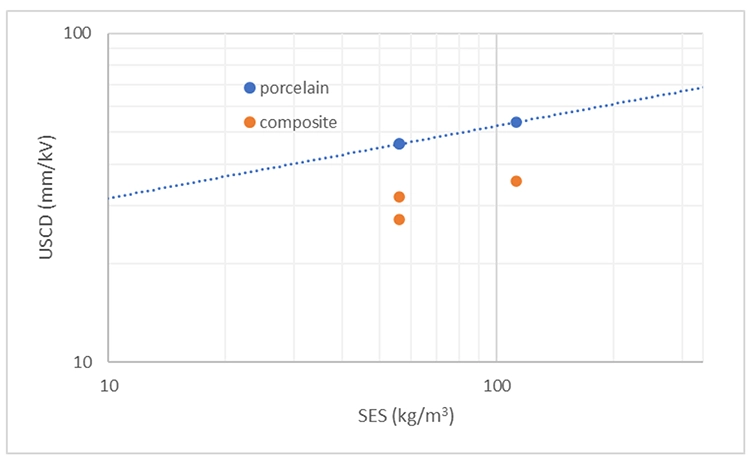
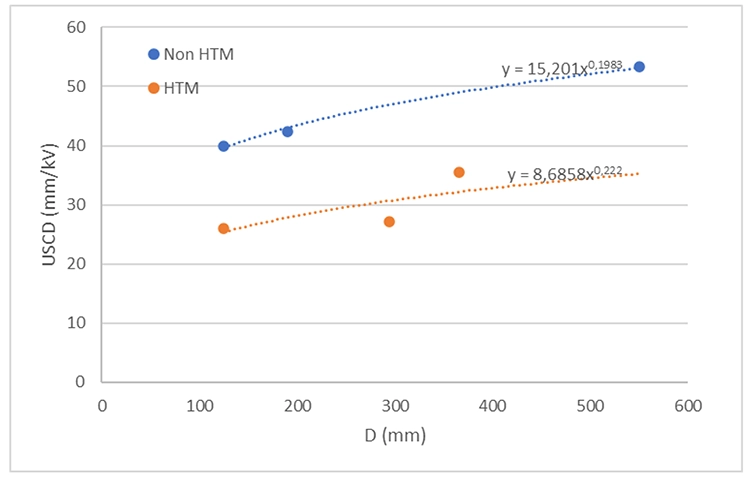
A comparison between the USCD obtained with composite insulators and those derived/extrapolated for porcelain insulators is shown in Figs. 8 and 9, indicating that the necessary USCD for composite insulators is, as an average, equal to about 65% of that of porcelain insulators, thus confirming the conservativeness of the GE assumed design USCD.

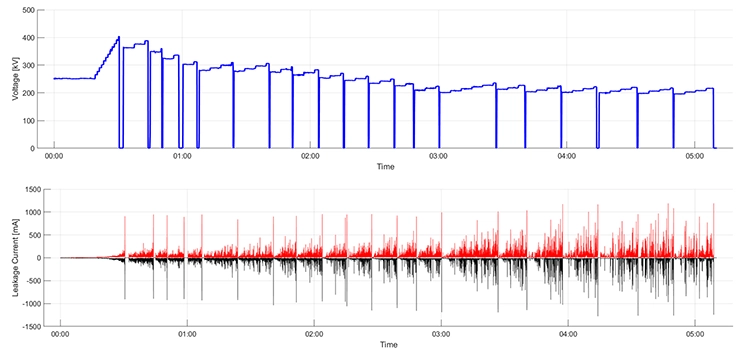
The leakage currents, beyond being measured with the STRI measuring system, were recorded also by means of the monitoring system set up by GE, to validate it. The laboratory data about leakage currents and corresponding hydrophobicity level could be useful to calibrate the alarm threshold for the real time monitoring system.

Conclusions
Two types of salt fog tests, withstand tests and quick flashover tests, were carried out on 4 circuit breakers of different ratings.
Withstand Tests
• All the circuit breakers with composite housing passed the demanding withstand test at the specified salinity including four hours preconditioning and minimum of 8 consecutive one-hour withstand tests over 12 one-hour tests.
• The long duration of the test required to work at least with two consecutive shifts of 8 hours.
• Analysis of leakage currents and hydrophobicity evaluation during the tests confirmed the validity of the proposed procedure, with the hydrophobicity class passing from about 1 to about 4-5 at the end of the test, condition closer to average field condition.
• For all the tests it was necessary to extend the preconditioning phase from three to four hours to reach a hydrophobicity level higher than HC1-2.
Quick Flashover Tests
• The circuit breakers design specific creepage distance was conservatively selected, close to that required for porcelain insulators.
• Tests with the quick flashover procedure confirmed that the minimum necessary USCD to avoid flashover for composites with hydrophobicity conditions close to HC5 can be as low as 65% of that necessary for porcelain insulators.
• The conservativeness of the design values assumed by GE allows not only to limit the flashover risk but also to assure limited leakage currents in service, thus assuring the required long service duration without significant ageing.
• As far as test procedure is concerned, the proposal to extend the number of shots is made to contain the required standard deviation of the last five shots below 3% to get values closer to the expected withstand value..

References
[1] IEC 60507, «Artificial pollution tests on high-voltage ceramic and glass insulators to be used on a.c. systems» 2013.
[2] I. Gutman, P. Cardano, A. Dernfalk, J.-M. George, T. Hayashi, K. Kondo, J. Lachman, S. Li, X. Liang, E. Moal, A. Pigini, J. Seifer, E. Solomonik, W. Vosloo and D. Windmar, “State of the art of pollution test p rocedures for Insulators with hydrophobic transfer material” CIGRE Science & Engineering, 2021- under publication.
[3] M. Marzinotto, G. Campopiano, G. Pelliccione and E. Moal, “A campaign for the ageing evaluation of station hollow core composite insulators after a number of years of service” CIGRE Session 48 – A3-207, 2020.
[4] IEC/TS 60815-3, «Selection and dimensioning of high-voltage insulators intended for use in polluted conditions – Part 3: Polymer insulators for a.c. systems» 2008.
[5] PD IEC-TS 62073, «Guidance on the measurement of wettability of insulator surfaces» 2016.
[6] P. J. Lambeth, «Variable voltage application for insulator pollution tests» IEEE, 1988.
[7] F.Bianchi, M.Cattaruzza, R.Cortina e B. Martinazzoli, «Etude ENEL ANIE de prodfils optimaux d’isolateurs pour sous stations, destines a l’installation dans des sites pollues» RGE Tome 82 N3, 1973.
[8] A.Pigini, R.Cortina, M.Marzinotto e G.La_Grotteria, «Pollution tests on composite insulators:the Italian experience» in ISH, 2015.
[9] A. Pigini, M. Nosilati, E. Stella e R. Saraceni, «Pollution design and on-site monitoring of insulators for AIS disconnectors equipped with porcelain insulators under AC voltage» INMR World Congress, 2022.