Insulators subjected to shaker table testing will see hundreds of bending loads ranging from very low values to full yield rating. Past research has explored cycle loading at a set magnitude and applied only in one direction.
This edited new contribution to INMR by Patrick Maloney and Peter Ilavsky of PPC Insulators, in cooperation with Shawn Maley and Tom Van Remmen of LAPP Insulators, looks more closely at load magnitude variation and direction, as reflected during shaker table tests.
Past shaker table test results were reviewed to quantify number of loads, load magnitudes and load directions. A set of insulators with a history of seismic region application were subjected to loads that mimic the levels found in typical shaker table testing. Deterioration of the set was then measured by taking the insulators to their ultimate yield level and comparing results versus a benchmark group.
Porcelain insulators have been used in seismic regions due porcelain’s stiff material property. Although brittle, porcelain has minimal deformation under load. It is also elastic for short duration loads up to yield, static loads to 70% of yield values.
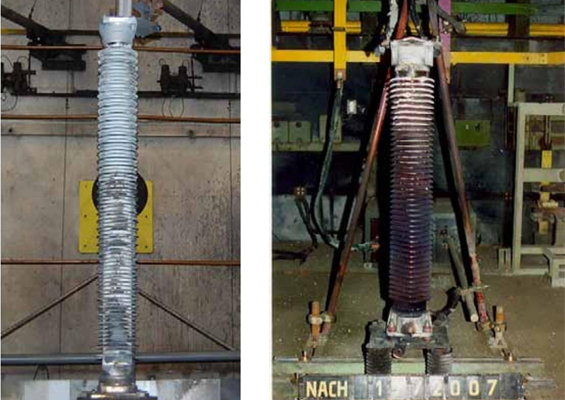
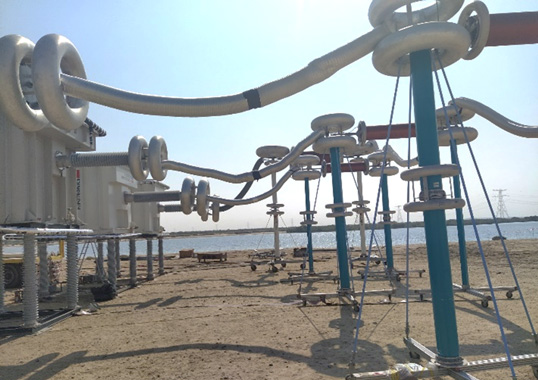
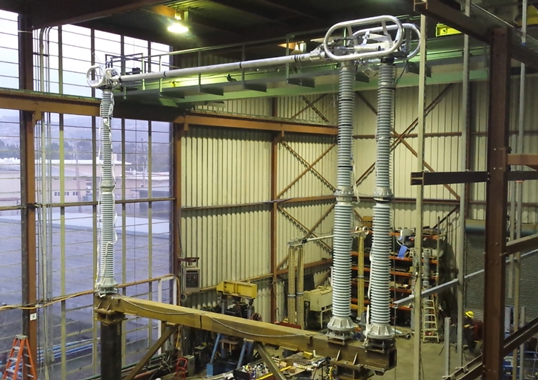
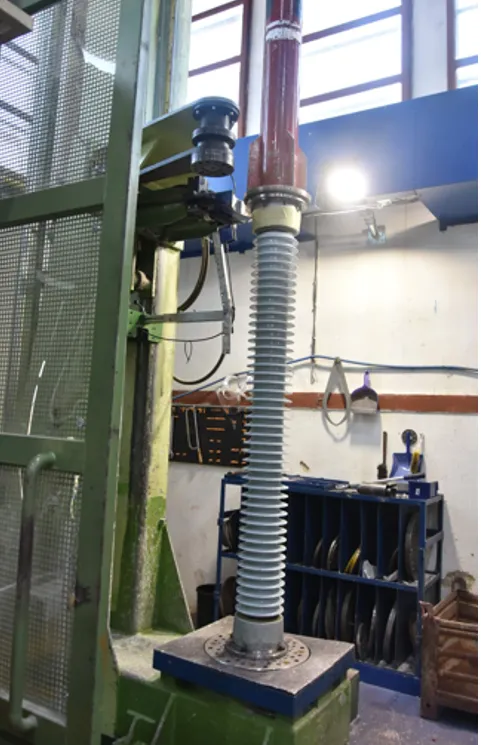
In seismic regions, porcelain insulators are still the preferred technology for switch manufacturers. Designs are tested on shaker tables to simulate earthquake. In the United States, IEEE 693 is the prevailing test standard. Testing per this standard on a shaker table is costly, typically more than US$ 250K. It is therefore important to use properly designed, high quality insulators.
Understanding Loads During Shaker Table Testing
Although insulators are subjected to many forces during shaker table testing, a) cantilever or bending, b) compression, c) tension and d) torsion, bending is the most demanding. Moreover, bending loads during shaker table tests are much different than performed as destructive sample test that determine ultimate strength.
Factory bending yield tests are applied slowly in one direction until fracture. Though this method allows manufactures to track average strength and standard deviation, it does not represent typical loads. For example, if an insulator was loaded to 80% of average yield and held, a crack would eventually propagate and yield. This could take hours or even days. The closer the load is to average bending yield strength, the quicker the yield would occur.
Another example more closely aligned with this study is rocking the insulator in opposite directions. Shaker table testing goes further, by inducing motion in the X, Y and Z directions. The Y-direction, up and down is of little concern due to an insulator’s high compressive and tensile strength. The X and Z loads produce rocking motion perpendicular to each other. Much like when one wants to pull a stake or post from the ground, rocking it in all direction greatly loosens the bond between the soil and post.
Modes of Yield on Porcelain insulators
There are two main yield modes to which porcelain insulators can succumb. A porcelain insulator consists of the porcelain body and cemented metal fittings. Each have characteristics that must be understood.
Porcelain
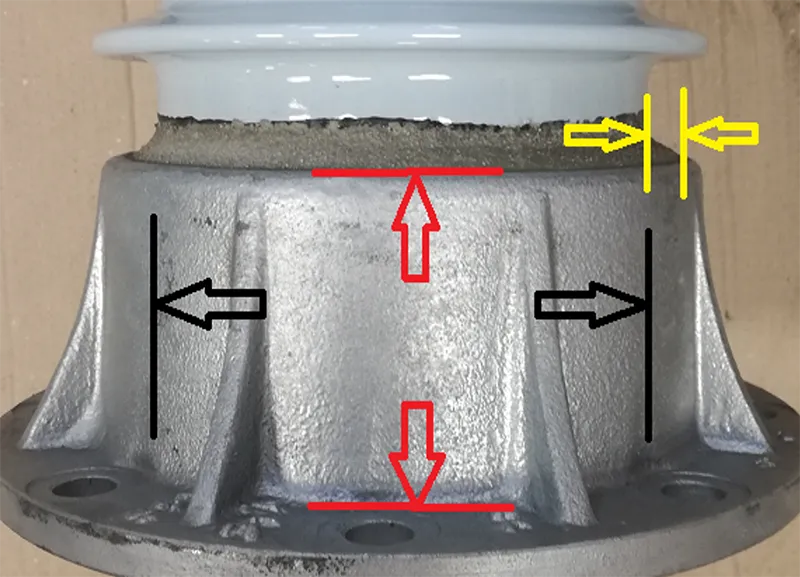
Porcelain itself will always yield at minor defects that are randomly dispersed throughout the body. Bending moment stress is highest at the bottom, as in the figure below.
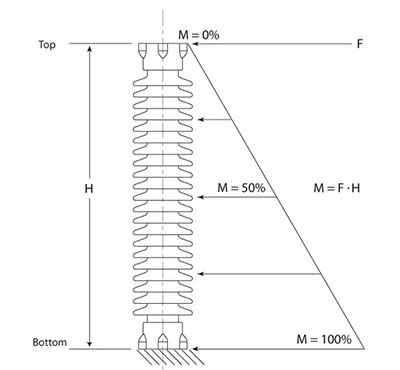
Factory sample tests are applied in only one direction and one end and are less likely to encounter a small defect. On the other hand, during shaker table testing, all four quadrants, top and bottom, will be subjected to high stress and more likely to meet a defect. As noted, porcelain is elastic and can be stressed in bending many times just below its yield level.

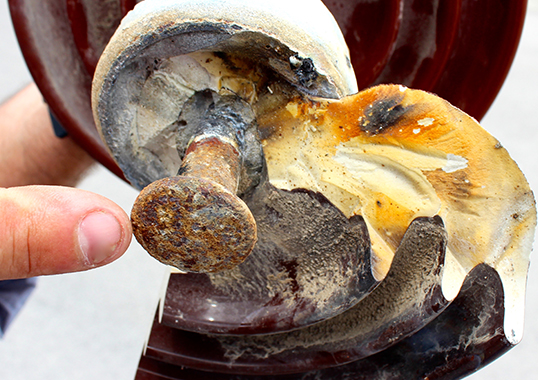
Fitting Attachment
Metal fittings are bonded to the porcelain by Portland cement. Both the metal fitting and the porcelain at the attachment zone have features to aid in the bond.
The fittings have ribs in their inner diameter as saw teeth and the porcelain has a sand band. Strength of this bond depends on the porcelain’s length of engagement, diameter of the joint and the controlled cement layer. Larger engagement and diameters, for example, increase strength. Cement thickness has an ideal range 5 to 7 mm. At less than 5 mm, it becomes difficult for the cement to completely fill the void while in excess of 7 mm, the cement can shear mid-way between the metal fitting and the porcelain.
The fitting remains elastic to 60% of yield values. Above that, degradation begins to allow movement. In the case of both seismic events and shaker table testing, forces near yield levels applied from opposite directions cause a rocking motion. In the early stages, this motion is nearly undetectable visually.
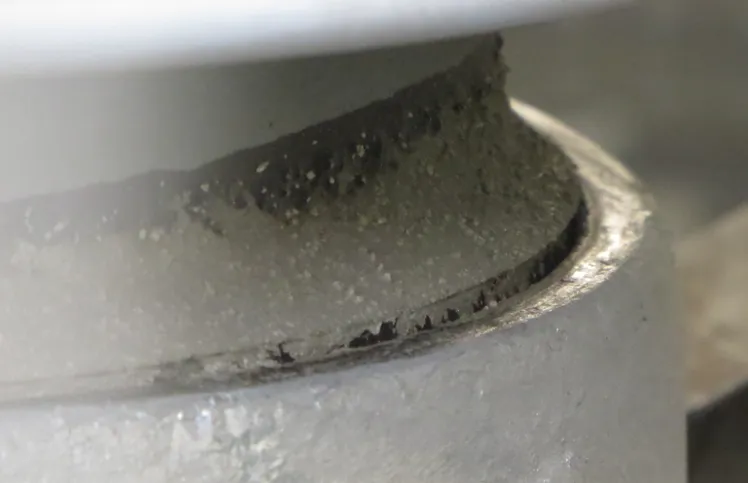
After many bi-directional loads, displacement shows that the Portland cement has sheared and is no longer providing an even distribution of the load.
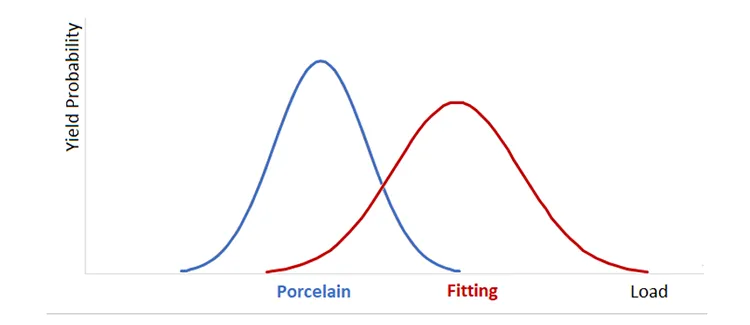
Designs for seismic applications require special focus on fitting bond strength. The goal is to create a fitting bond that exceeds the strength of the porcelain. This in turn results in a more elastic joint, as required in cyclic loading.

Shaker Table Test Data
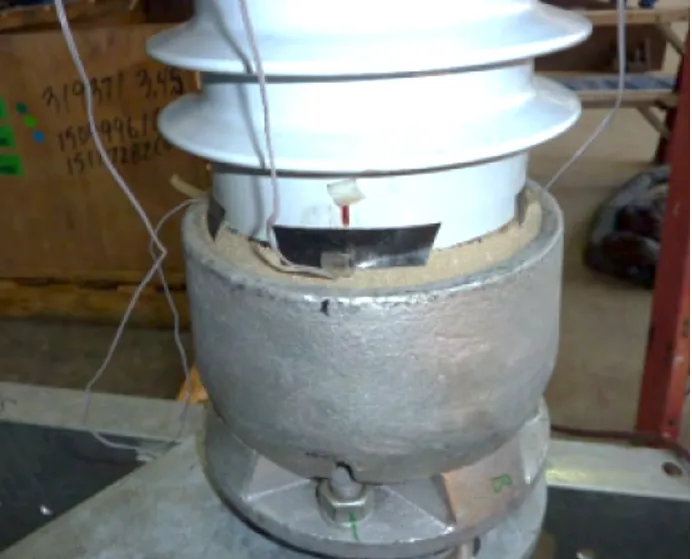
Strain gages are applied to each of the support insulators in all four quadrants. The load data collection system is calibrated by applying test loads.
Reviewing load graphs from previous shaker table testing, one can find magnitude of loads, orientation of the largest loads and quantities of each of these loads. The graph records loads collected over a 45 second period. Below are the bending loads recorded at the maximum allowed per IEEE 693 performance level testing, full yield level rating. Approximately 16 loads were found at or above 60% of the rated yield level.
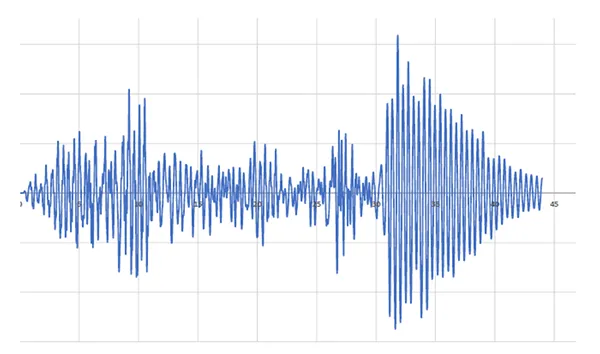

During shaker table testing, insulators are subjected to the highest bending loads from horizontal forces perpendicular to the switch. Loads parallel to the switch have the stiffening of two supports and, in some cases, one rotating stack.
Simulating Loads Encountered in Shaker Table Tests
As mentioned, shaker table testing is expensive. If an insulator can be subjected to expected test loads prior to laboratory testing, confidence can be gained.
In the pre-test load sequence, we assumed the worst case scenario. Loads below 60% of yield are elastic and cause no damage. During the 45 second event, 107 oscillations were observed. The frequency was 2.37 cycles per second. Only 16 were above the 60% of yield level. In our qualification run, we will only use loads above 60% of yield rating.
Typical factory load rates are far slower than the natural vibrations seismic events bring. Longer duration load result in more damage.
Test Plan
To establish a benchmark, historical bending data was collected. A group of 86 test results were used to determine the average yield level and the standard deviation.
Ten test samples of the same design as the bench mark group were selected to conduct the test.
To simulate shaker table load inputs, loads were applied in the +X/-X and +Z/-Z. The Y axis was ignored due to low compression loads compared to the insulators high capabilities.
The loads and their levels were applied based on an actual graph collected during a shaker table test. The graph begins with moderate oscillations reaching 60% of rating. The middle phase resulted in loads less than 50% of rating. The final phase erupts to 100% rating loads, then exhibits a declining amplitude. In the last phase is were we find the majority of the high bending loads.
Loads were applied in all four quadrants by rotating the insulator. After all samples were subjected to the bending series, they were taken to their ultimate strength.
The test series was established as follows:


Summary of Results
Benchmark Group, 86 Samples
Average breaking strength 17.3 kN
Median 17.5 kN
Standard deviation 1.72 kN
Test Group, 10 Samples
Average breaking strength 17.3 kN
Median 18.19 kN
Standard deviation 1.91 kN
Conclusions
A total of 10 insulators were subjected to the loads typically found of performance level in the IEEE 693 test. Quantity and load amplitudes were taken from an actual load graph from a shaker table test. Each cycle consisted of +/- in both the X and Z axes.
Yield data were compared between a benchmark group and the test group. The results were nearly identical, meaning the cycles of loading did not cause deterioration of the test samples prior to ultimate yield testing.
The pre-test therefore assured that the future seismic shaker table testing would likely pass.