Over the past decade, as many new suppliers have entered the market for line insulators, a spectrum of differing quality and performance levels has emerged. Unfortunately, experience has demonstrated that such differences cannot always be identified based solely on standards and specifications. While the focus at procurement departments is typically based on acquisition cost and meeting required standards, engineers these days are asking for more stringent criteria to be introduced into specifications to avoid qualifying poorly performing products. It has therefore become necessary to review standards and look for additional ways to define quality and performance from the perspective of the end user.
This edited past contribution to INMR by Jean-Marie George and colleagues at the Sediver Research Center in France outlined their views of key points to be considered when qualifying suppliers of toughened glass and porcelain insulators.

Review of Major Standards
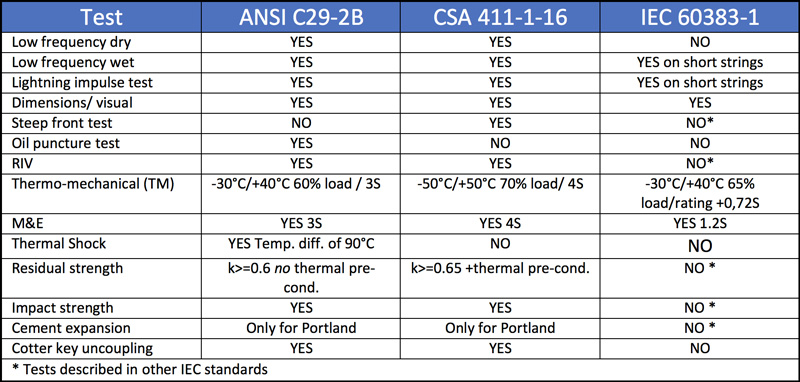
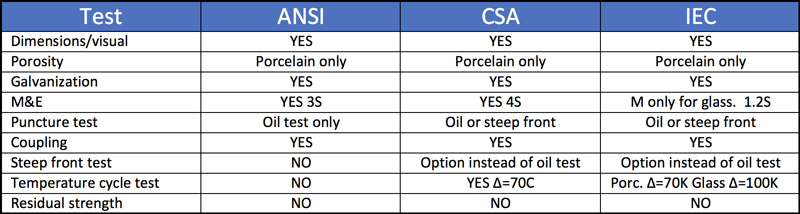
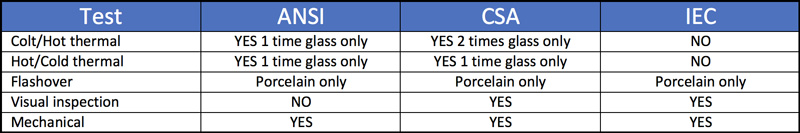
The most common standards for line insulators come from ANSI, IEC, and CSA. Chinese GB standards cover the numerous insulators installed in China over the past decades and some are largely based on IEC. These various standards describe general test protocols but offer little in the way of material descriptions. Yet quality of materials can show up after only several years of service and should also be part of any review. Similarly, experience gained in identifying possible design weaknesses have not always been sufficiently integrated into the assortment of tests intended to ‘weed out’ poor performing products. The following Tables compare IEC 60383, ANSI C29-2B and CSA 411-1-16. It is apparent that ANSI and IEC are less demanding than CSA standards, which go a few steps further by introducing new tests. The distinction between ‘type tests’ and ‘sample tests’ should also be made and this is also different among the standards in terms of quantities, and the tests themselves. The question to determine is if all manufacturers are capable to demonstrate consistency and if some tests should be repeated at the level of acceptance tests.

Material Descriptions
Metal End Fittings
Description of materials to be used for these insulator components remains relatively vague in ANSI, calling only for commercially available malleable ductile iron or steel. Moreover, IEC 60120 also does not provide much detail. This stands in contrast to CSA standards that contain a description of type of casting and steel (i.e. minimum elongation of 10% for malleable and 12% for ductile iron, with a requirement of cold impact strength as per ASTM A370). Cotter keys are also described only in CSA, with clear reference to type of stainless steel (i.e. ASTM A580 or 580M S30400, S32100 type 304, 314, 321 or EN 10088-1 type 1.4301 with Wicker hardness above HV150). IEC 60372 does not specify a material reference.
Cement
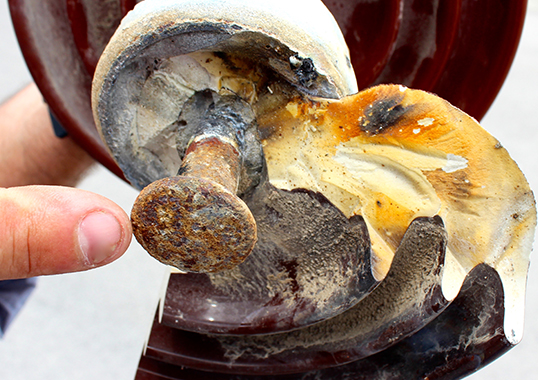
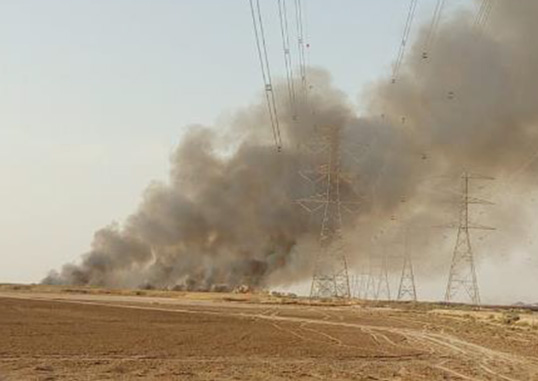
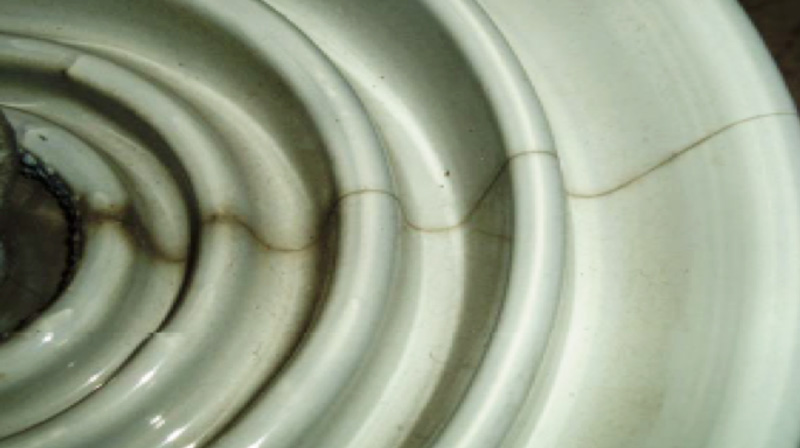
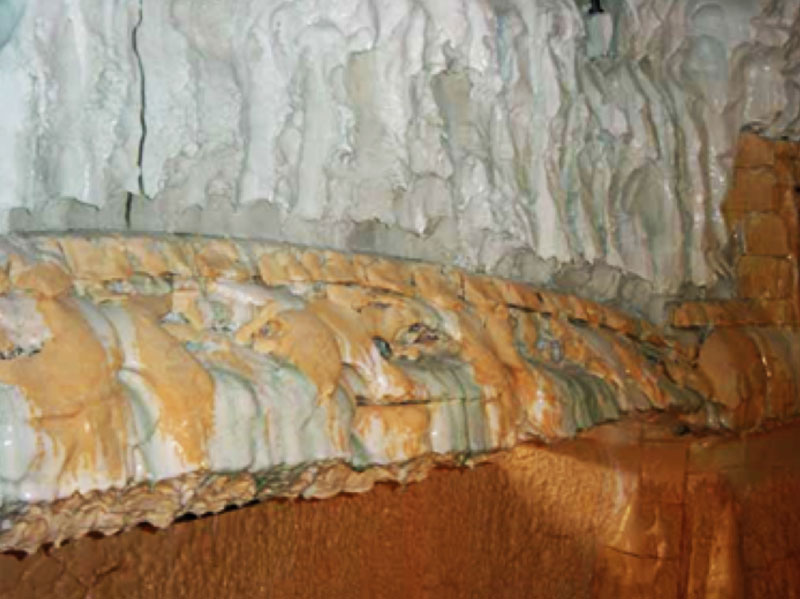
Cement is a key component in a glass or porcelain insulator. Current standards ask for an expansion test per ASTM C151/151M whenever an insulator is made using Portland cement. But for aluminous cement there is little such description. Table 4 describes the main oxides present in various cements. Portland cement has much higher CaO content than aluminous cements (e.g. approx. 40% in a final mortar mix for content above 60%, considering pure cement paste prior to mixing with additives). Possible transformation into gypsum (i.e. larger crystals) could lead to insulator failure if the cement is prone to expansion (as shown in Fig. 1). This is the reason it needs to be tested as per ASTM C151. Aluminous cements have much less CaO and more Al2O3. The numbers in this table are typical of pure cement, while manufacturers use mortars where the cement is the major but not only component. The rate of alumina should therefore be considered around 30% in an industrial mortar used in the insulator assembly process.
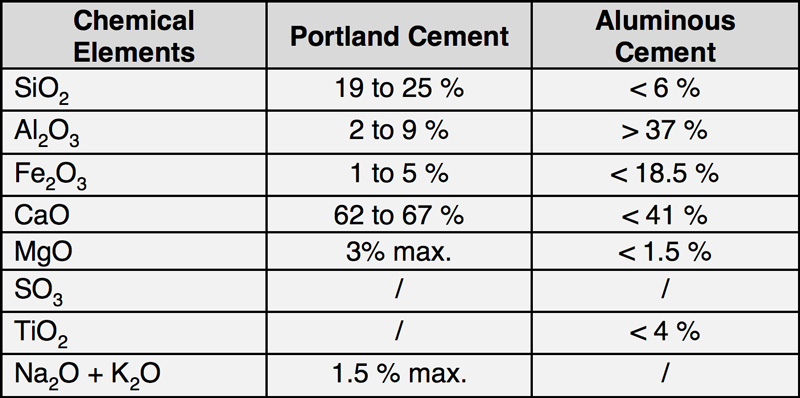
Checking for Portland versus aluminous is easy. In fact, some utilities initiated a chemical check of a random sample from the insulators received after discovering that these were sometimes made of Portland even though product drawings called for aluminous cement. Simple chemical analysis will show the respective contents of CaO and Al2 O3. Moreover, aluminous cements should exhibit at least 30% alumina oxide.
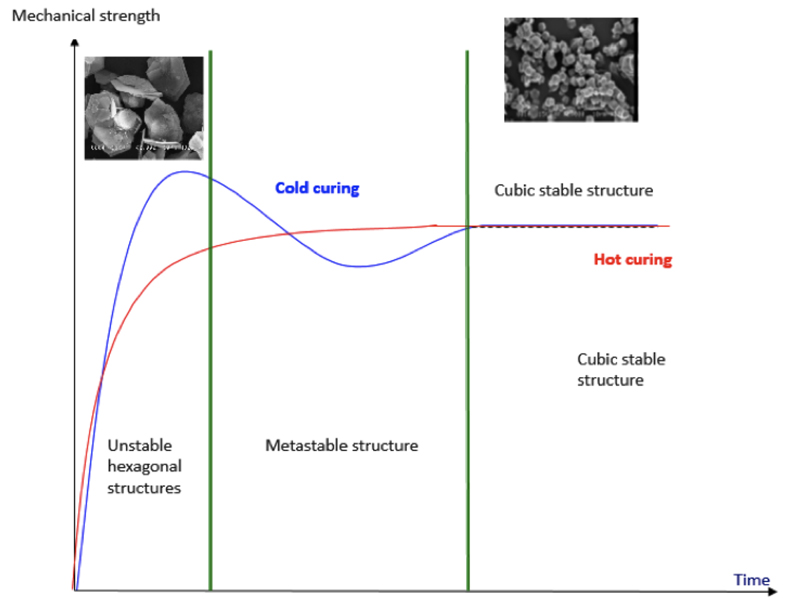
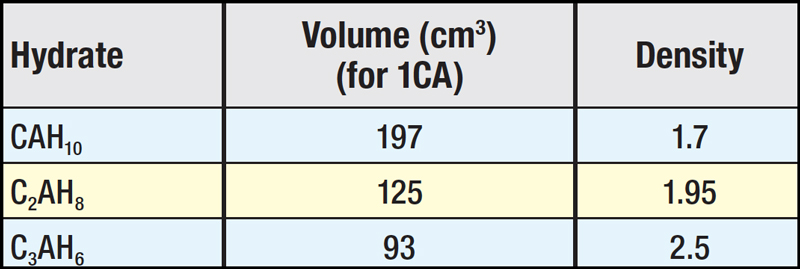
Depending on whether aluminous cement is cured in cold or hot water, it can exhibit different crystallographic patterns over time. If cured in cold water (i.e. ambient temperature), crystals take a hexagonal shape that is unstable and progressively convert into the more stable cubical stage. This process can last years. When cement is cured in water at around 70°C, conversion is immediate. Clearly, hot curing is more costly but leads to more stable mechanical performance. It has been clearly demonstrated that when cold-cured aluminous cement converts progressively from hexagonal to cubical shape there is reduction in strength, which is eventually restored when conversion is complete (see Fig. 2). Evolution in strength of cold-cured cement cannot be predicted in time and value and to better determine such effects a residual strength test can be a good indicator. To differentiate cold from hot-cured, another possible approach uses thermo-gravimetric analyses (TGA) through identification of the hydrates present in the mortar. CAH10 (CaO, Al2O3, 10H2O) and C2AH8 (2CaO, Al2O3, 8H2O) are the unstable hexagonal hydrates while C3AH6 is the stable cubic hydrate. The cold-cured process introduces transient hydrates such as CAH10 and C2AH8 that react progressively to become C3AH6 (3CaO, Al2O3, 6H2O). Among the reasons for lower strength during the unstable phase is differences in density of these hydrates, meaning higher porosity (see Table 5).
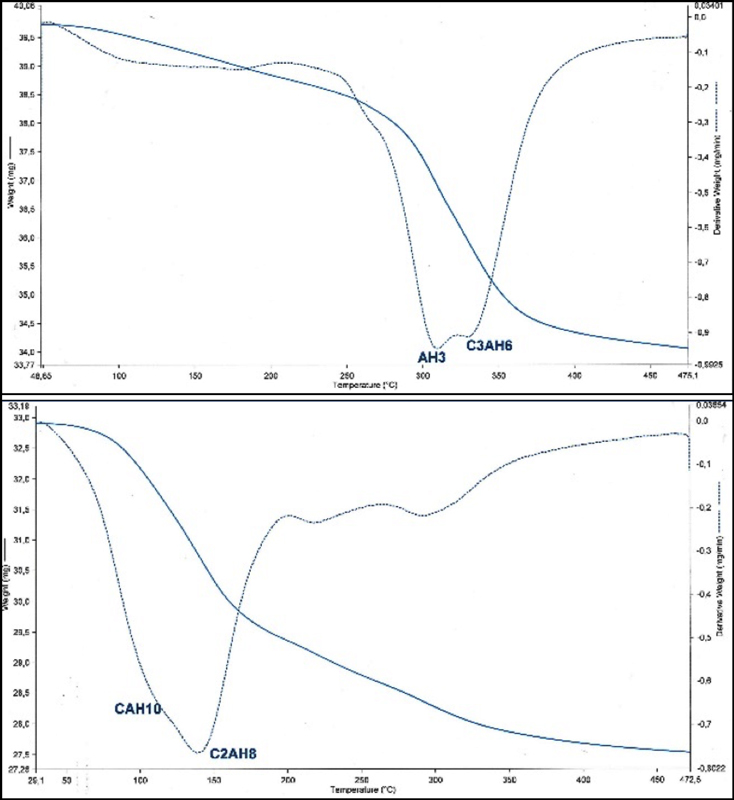
The TGA spectrum in Fig. 3 compares cold-cured and hot-cured aluminous cement and confirms that it is easy to discriminate which is being used in an insulator. A growing number of utilities are now leaning towards aluminous cement and specify only hot-cured cement, as per CSA standards. Evaluation of performance and type of curing can also be verified through a residual strength test, described below.
Glass
Purity
Porcelain has a heterogeneous structure by nature and is made up of a variety of crystals. By contrast, glass is amorphous and has no structure. Indeed, this is one of the reasons it is a perfect dielectric material that does not age. However, during the glass making process it is possible for impurities to enter into the glass melt. Among other reasons, this has could directly impact quality as defined by self-shattering rate. Possible impurities, for example, can come from wear and tear on refractory walls (see Fig. 4) and studies in the 1980s identified the diverse root causes of such defects. This resulted in improved techniques and processes.
A shattered glass disc (or stub) in an insulator string is not a problem for performance and safety of a line. Although there is no need to replace the stub, excessive numbers of these in strings could become a maintenance concern. There is no standard dealing with this issue and it seems advisable that utilities request performance certificates from other end users who track and report self-shattering rate. Such certificates should ideally refer to quantities supplied outside the country of manufacture to ensure complete independence and objectivity of data. It is also recommended that at least three certificates be requested, dealing with deliveries in excess of 100,000 units and for service periods of at least 10 years. A common benchmark for an acceptable self-shattering rate is 1/10,000/year.
Table 3 describes the thermal shocks intended to help weed out glass shells containing impurities. But major manufacturers have implemented additional tests to further improve glass quality by targeting specific impurities. Technical literature on glass purity refers to procedures used in the flat glass industry such as the soak test and others. Some manufacturers advertise full compliance with these to showcase their quality philosophy. But glass disc insulators are not flat and do not have regular thickness across their volume. Based on past research, customized processes have been implemented to take these factors into account and demonstrate a benchmark annual shattering rate at or below 1/10,000. Quality level today is a combination of know-how acquired from production indicators as well as overhead line surveys where shattered discs are counted.

Molding & Toughening
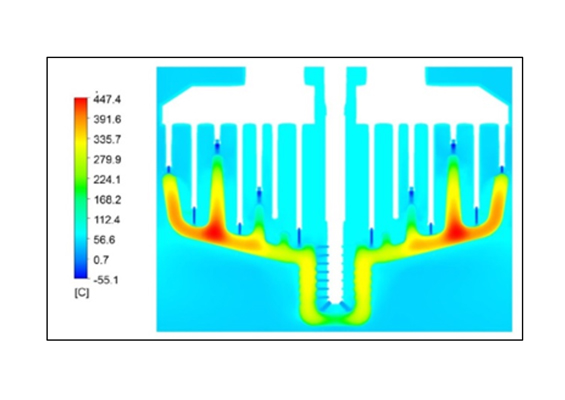
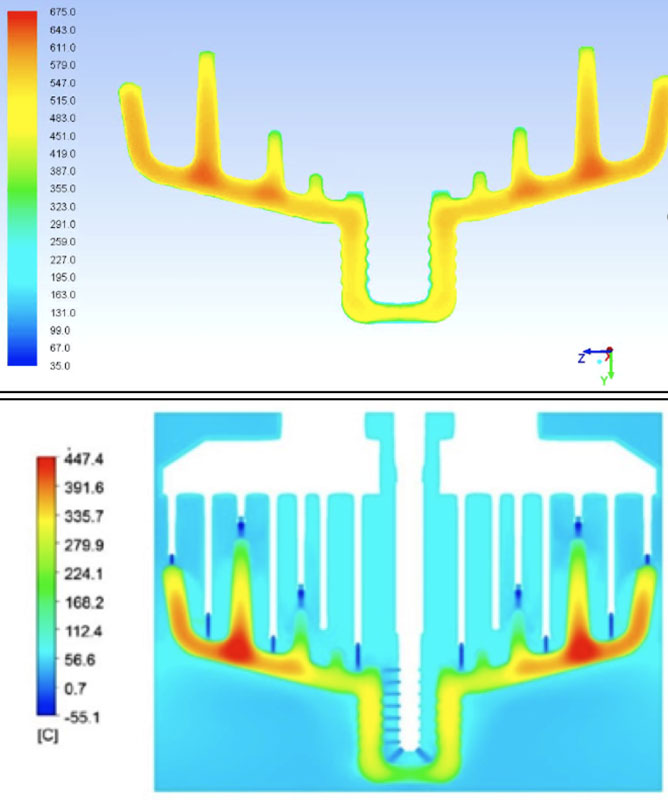
Molding and toughening are important production steps and quality of insulators can be compromised with glass shells containing defects from either of these key operations. Testing can be helpful in screening these aspects and it has become clear that steep front testing makes sense in any sample test plan to verify consistency. Toughening is what makes the glass strong enough to be used on transmission lines. This process therefore requires a careful approach whereby both product shape and tools have to be designed in combination. Fig. 5, for example, shows a typical simulation of the cooling process during toughening and makes clear how product and tools are intimately connected so as to achieve precise thermodynamic requirements.
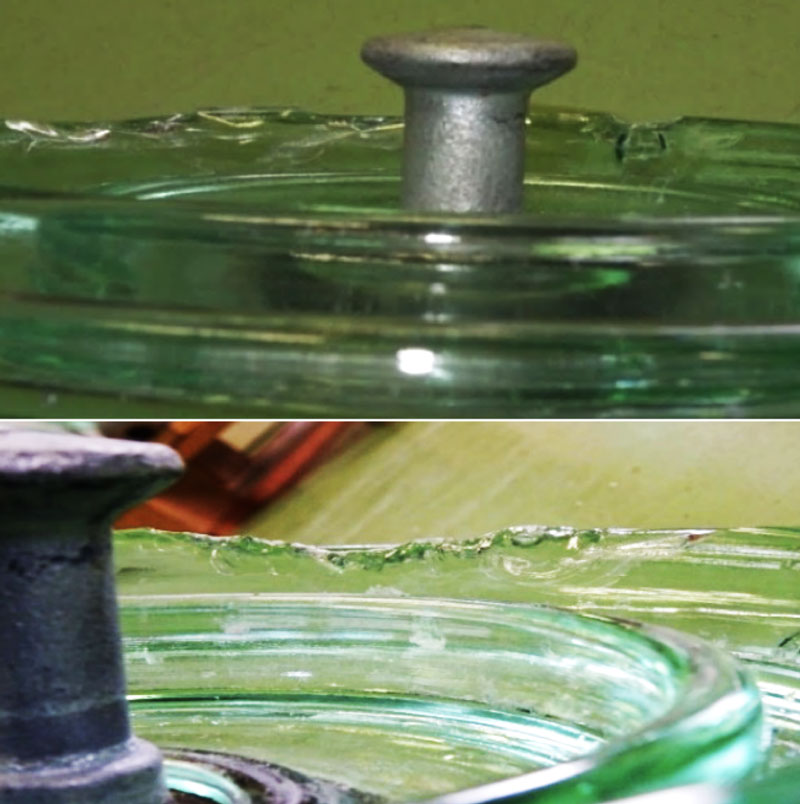
Some utilities have reported unusual breakage patterns that put into question the quality of the glass toughening process (such as in Fig. 6). This is markedly different from what can happen if small chips of flakes appear after strong impact on the glass surface – possible and acceptable when the flake remains in the volume of glass under compression. Some experts recommend assessing quality of toughening by breaking samples of glass and looking at size and distribution of the pieces. The impact strength test could be reviewed with a description of expected breakage pattern.
Type & Sample Tests
Residual Strength Test
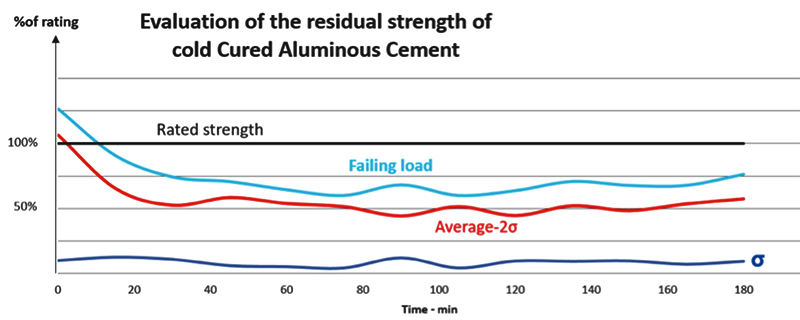
A residual strength test is performed to demonstrate the ability of an insulator to retain some minimum mechanical strength once damaged. This mechanical test is therefore performed on broken discs, i.e. skirt removed in the case of porcelain or stub if glass. By design, mechanical load is transferred between cap and pin mostly through compression. Therefore, the design of the insulator head as well as of the cement are critical components whose performance can be assessed by this test. In the case of cold-cured aluminous cement, new insulators show high values. But if tested while the conversion process discussed above is taking place, strength can drop progressively to half the initial values. This phenomenon can be artificially accelerated if test samples are immersed in hot water for some time. Fig. 7, for example, shows test results on cold-cured aluminous cement insulators that were immersed in hot water for various periods. The decline is obvious and could even reach 50% of an insulator’s rating when applying 2σ standard deviation.
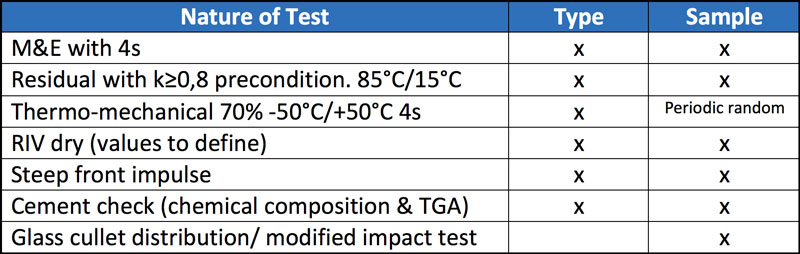
Today, ANSI does not specify thermal pre-conditioning prior to the residual strength test. IEC and CSA standards call for pre-conditioning at around 75°C maximum – probably not high enough to make this risk clearly visible. Ideally, all standards should include pre-conditioning at around 85°C or even 90°C. For hot-cured cement, since conversion is completed during manufacture, such testing would show no strength variation. Among the reasons to be cautious with residual insulator strength, the example can be taken of the new NESC Guide in the U.S. (rule 277) that allows utilities to load a line up to 65% of the rating of its insulators. Current standards, as in Table 1, do not offer a buffer. To this effect, a residual strength value after thermal pre-conditioning of 80% seems sufficient to ensure maximum insulator reliability. This test needs to be made a sample test, possibly in addition to verifying chemical content of the cement itself.
Steep Front Test
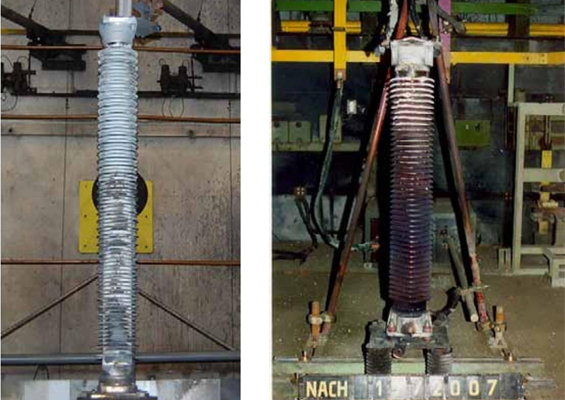
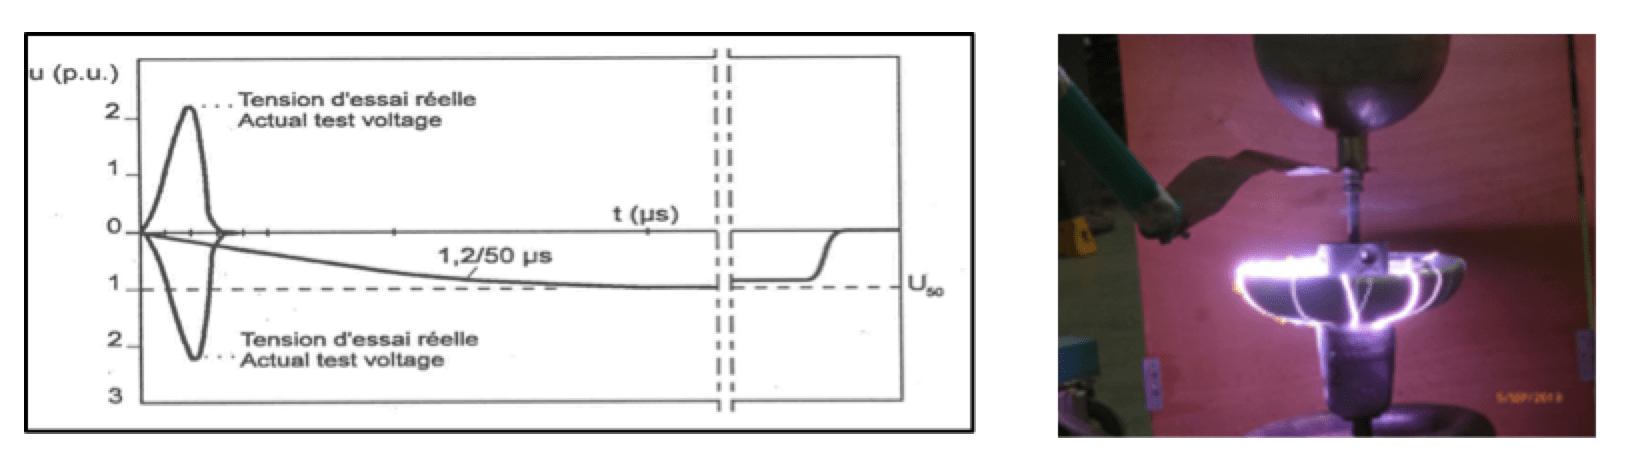
IEC 61211 is a standard to test dielectrics under severe overvoltage conditions e.g. 2.5 or 2.8 pu (see Fig. 8) without need for oil as in the traditional oil puncture test where the dielectric is tested under power frequency conditions. Today, there is sufficient data to support this steep front test as replacement for the oil test. The test identifies insulators containing defects generated during manufacture, whether porcelain micro-cracks and structural defects or molding and material defects in the case of toughened glass insulators. It is also now clearly established that, when doing a puncture test in oil, the main parameter to assess results is not the insulator but rather the oil. Yet little is said about oil characteristics in ANSI. While CSA and IEC at least give a resistivity value to be set between 106Ω.m and 109Ω.m, nothing is stated about dielectric strength. Poor quality insulators can go through the oil test while good insulators could fail because of a thermal gradient in the oil if it is too resistive. Standards should ideally converge towards steep front testing, provided these follow IEC 61211. Since this test offers information on insulator quality, it should be recommended not only as a type test but also as a sample test through random selection from a batch of insulators. CSA calls for a steep front test not only as a normal type test but also after a thermo-mechanical test. By pre-stressing the insulator, the test simulates behavior of an insulator not when new but rather after several years of service, going through a variety of environmental and service conditions.
There could be real value in harmonizing all insulator standards around CSA parameters that are more stringent – especially in regard to thermo-mechanical pre-conditioning. For example, insulator failures during various benchmark sessions have been recorded in CSA while nothing was visible applying other protocols. In each case, a problem of assembly or glass quality could be traced as the root cause.

RIV
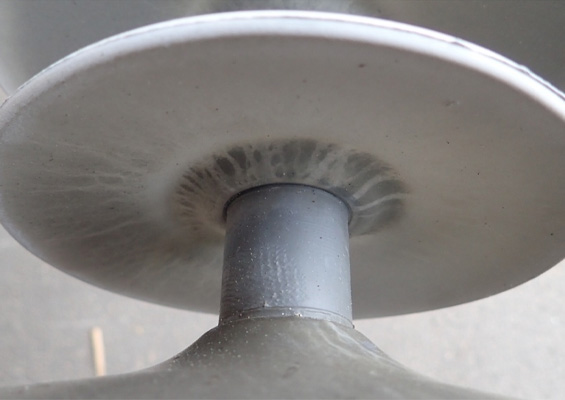
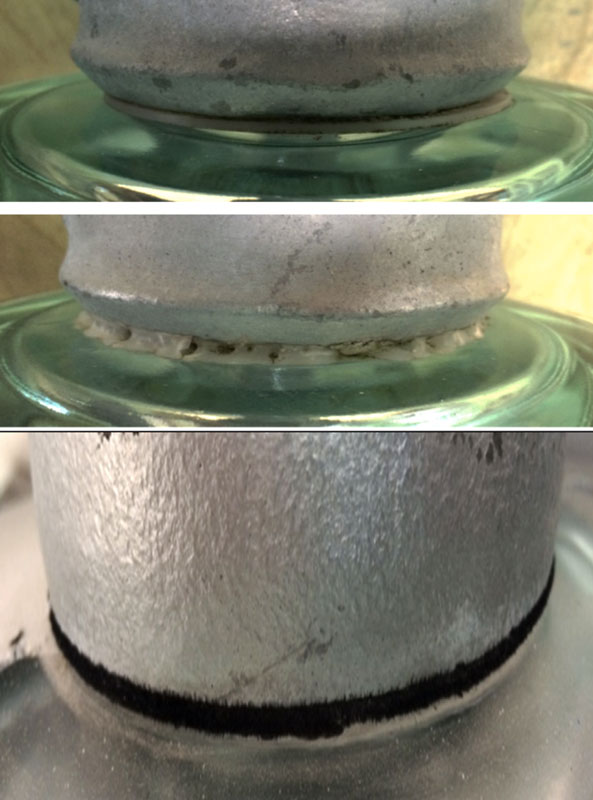
Apart for ANSI, there are no RIV values specified in the standards. At the same time, there has been a debate around possible introduction of an RIV test in IEC. RIV requirements can indeed be a good indicator of some quality aspects linked to shape or assembly of an insulator. Specified values, however, should take account of parameters such as size of insulator and possibly maximum voltage experienced by the most stressed unit in the string (i.e. at the line end). This can be done by making a voltage distribution evaluation in a laboratory or, alternatively, making an assumption such as 10% or 15% of phase-to-ground voltage of the line under consideration. Having a specification with too low values will show little whereas taking values that are too severe could lead to either over-designing the insulator (i.e. cap size) or using artificial methods to pass such values. An example of the latter is shown in Fig. 9. Here, the manufacturer used a cement coating that disappeared rapidly after several hours under mild salt fog and resulted in higher subsequent RIV values.
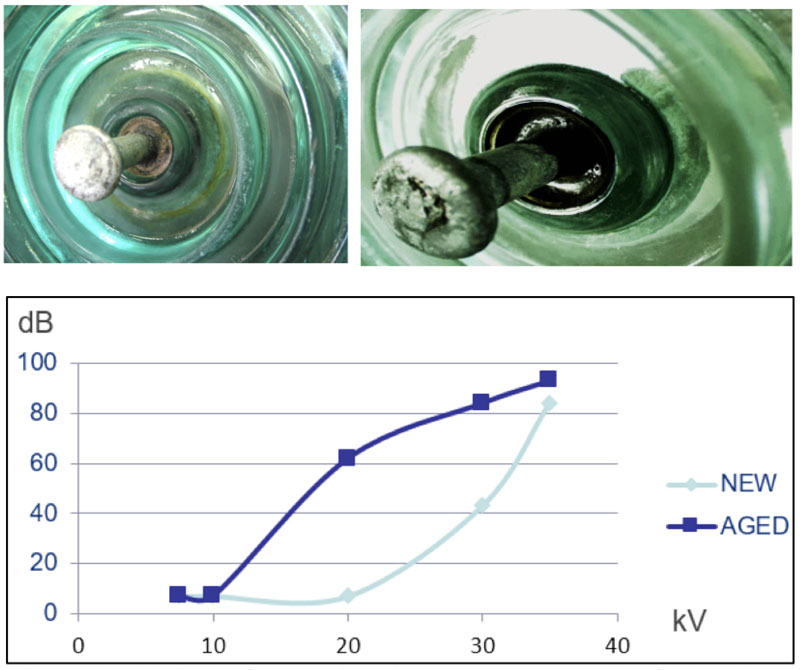
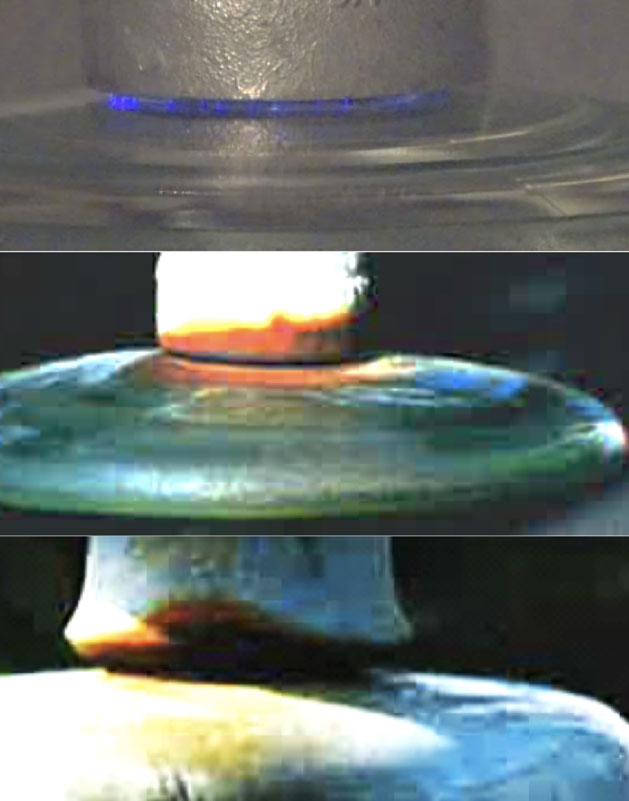
The RIV generated by an inferior cap to glass seal or connection is usually much more difficult to generate than from the pin side, unless the gap under the cap is extremely poor. Fig. 10 shows a gap on the order of 2 mm leading to corona but at a high voltage level (a situation that can occur at the bottom of an unshielded string). Similarly, in some cases manufacturers use a plastic ring under the cap. This is often made of low quality plastic that degrades over time and under temperature. RIV values would then progressively increase over time. Such a solution should therefore be avoided and instead favor a classic ‘flock’ deposit at the cap base.

Other ideas such as an RIV test under wet conditions have been described based on different test observations. However, a necessary caution here is that it is important to understand whether differences can be correlated to weaknesses, defects, flaws or inferior quality designs. This has not yet been clearly established.
Conclusions & Recommendations
The following can serve as the basis for possible future upgrades or changes in standards and/or specifications. Beyond the tests themselves, it is also important to understand that random sampling when performing tests, as so far done only at the level of type tests, can be extremely helpful in demonstrating quality and consistency in quality.
References:
[1]: STRI paper
[2]: IEC60383
[3]: ANSI C29 2B
[4]: CSA 411-1-16
[5]: Assessment of electrical and mechanical performance of toughened glass insulators removed from existing HV lines. CIGRE Canada Calgary 2007. George et al
[6]: ISH 2013 Electrical properties and characteristics of a stub. George et al
[7]: Condition assessment of porcelain and toughened glass insulators from residual strength test. CEIPD 2006. Gorur et al.