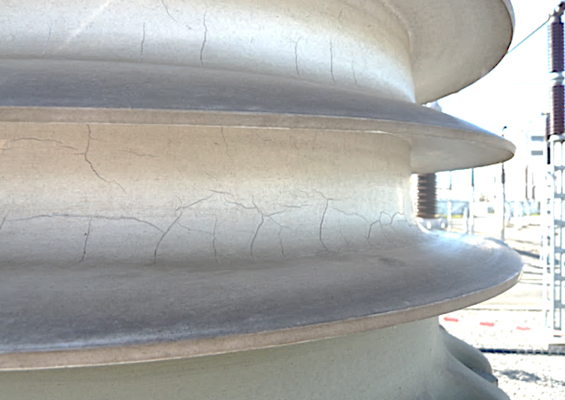
One of the critical factors ensuring reliability of composite insulators is the inherent hydrophobicity of their silicone rubber housings. Hydrophobicity results in favourable electrical performance under wet and polluted conditions and enables less creepage and potentially shorter insulators. However, hydrophobicity is a dynamic property and can be lost temporarily under external stresses such as partial discharges, UV and pollution. Still, after a certain period without these stresses, hydrophobicity can recover.
Another important advantage offered by composite insulators is hydrophobicity transfer, namely the capability of silicone rubber to transfer its hydrophobic properties to the surface of an accumulated pollution layer. This hydrophobicity transfer mechanism has been shown to be the result of diffusion of low molecular weight polymeric chains that migrate to the surface from the bulk material causing the pollution layer to also become hydrophobic.
This edited contribution to INMR by Jaka Strumbelj of Pfisterer in Switzerland reviews findings from recent investigations into the influence of nitric acid attacking the dynamic hydrophobic properties as well as resistance to tracking and erosion of HTV silicone rubber materials.

Various acids occur during operation of insulators on high voltage networks, including sulphuric acid from industrial pollution and nitric acid due to corona discharges. In sufficiently high concentration, these acids can degrade the silicone material by attacking and dissolving key fillers such as the aluminum trihydrate (ATH) found in most high temperature vulcanizing (HTV) silicones.
This process depends on the acid present and could see the filler dissolve by either of the following reactions:
![]()
Past research has focused on acid rain and its effect on tracking and erosion resistance of silicone rubber housings. This is one of the key properties of composite insulators that needs to be controlled not only to ensure service performance but also to keep the FRP core rod fully enclosed by the housing. Together with hydrophobicity, resistance to tracking and erosion results in favourable electrical performance under wet and polluted conditions.
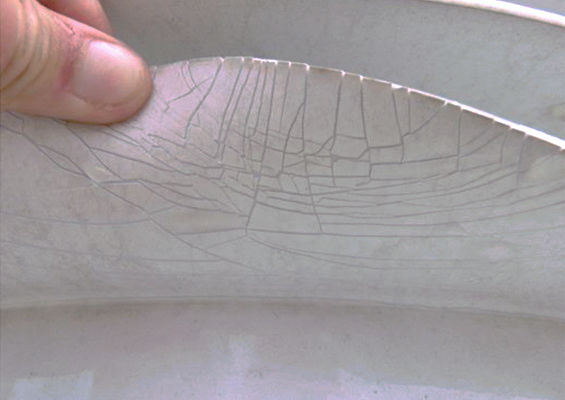
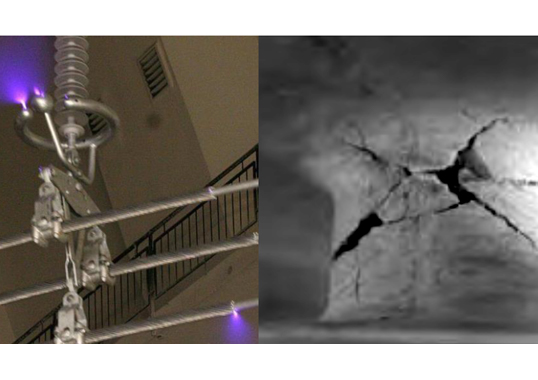
Starting in 2019, some utilities began requiring that the silicone housing of composite insulators they specify must be resistant to nitric acid attack. The background for this requirement was concern about a specific combination of industrial and natural pollution combined with little rain but frequent morning mist. For example, a common test procedure first drafted by a Middle Eastern utility involved immersing a shortened insulator section in a concentrated 1 molar (pH ≈ 0) nitric acid solution for 100h, followed by a 12h drying period at 80°C. The test is passed if no cracks appear on the silicone rubber surface.
In one comprehensive study on the influence of acid attack on silicone rubber, researchers systematically examined material properties such as resistance to tracking and erosion. They also quantified contact angles as well as dielectric properties, and performed material analyses utilizing SEM, EDS and FTIR techniques. However, compared to present day requirements, they used less concentrated acids, i.e. with a pH ≥ 1.5. Moreover, if nitric acid attack does occur in service, it is important to test not only the capability of the silicone rubber to withstand this but also any possible other effects on material properties.
Investigations over the past 5 years have looked into the influence of nitric acid attack on silicone rubber’s dynamic hydrophobicity and on its resistance to tracking and erosion. To evaluate dynamic hydrophobic properties, the contact angle between water droplets and an artificial pollution layer as well as the unpolluted silicone surface was measured after immersion in nitric acid. In parallel, the hydrophobicity transfer capability of the bulk material to an artificial pollution layer was also evaluated as was influence of acid attack on extent and mode of tracking and erosion (using the inclined plane test according to IEC 60587). Tests samples were pre-stressed by nitric acid together with boiling in a solution of NaCl and de-ionized water, according to IEC 62217.
Dynamic Hydrophobic Properties
To investigate influence of nitric acid on hydrophobicity and hydrophobicity transfer capability of silicone rubber, specimens were immersed in a nitric acidic solution for defined periods of time. After cleaning and drying, contact angles on the surface and on the artificial contamination layer were measured at defined intervals. For the purpose of comparison, 5 specimens of each material were prepared for such testing but without immersion in nitric acid.
Materials & Specimens Tested
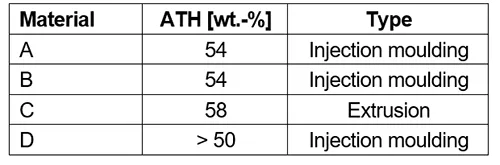
Several peroxide curing HTV silicone rubber formulations were used, the main difference being in their relative content of ATH filler. The types of ATH and surface treatment by silane did not differ significantly. Table 1 lists the different materials tested and indicates the percentage of wt.-% content as well as for what production process the compound was intended (i.e. injection versus extrusion molding). Material B was specially developed to withstand nitric acid attack test as described above while D is a commercially available material.
Specimens measured 120 x 50 x 6 mm, based on required dimension for the inclined plane test as per IEC 60587. After production, specimens were left to cool to room temperature and then immersed in a container with the acidic solution for a period of time.
Test Method
Pre-Stressing by Immersion in Nitric Acid
To avoid crack formation on the silicone surface, reduced acid concentration was used for pre-stressing compared to that in the acid attack test. In this case, a 0.1 mol/L (pH 1) acidic solution of de-ionized water and nitric acid (HNO3).
Groups of 5 specimens each were placed and stored in separate containers holding 1.3l acidic solution at 35°C for defined periods: 96h, 240h, 504h and 1008h. The acid solution was changed every 250h to reduce impact of decreasing acidity as well as to remove any silicone that may have dissolved in the solution. The pH of the solution was measured after each change of acidic solution. Movement in pH towards less acidic is an indication of a reaction between the acid and the silicone specimens in which the ATH filler is dissolved.
After the storage period elapsed, specimens were removed from the acidic solution, rinsed with de-ionized water and left to dry at room temperature for about 3h before further preparation for the tests.

Hydrophobicity Transfer Test
The hydrophobicity transfer test measures the ability of a silicone rubber material to transfer hydrophobic properties to the surface of an artificial pollution layer and was conducted as described in CIGRE TB 442. A pollution layer with thickness of 360μm made of a mixture of quartz sand, water, and isopropyl alcohol was applied while protecting the rest of the specimen surface with a mask. The pollution layer was applied to half the specimen, as in Fig. 1.
After application of the pollution layer, specimens were immediately placed in a desiccator with laboratory conditions (~23°C, RH 54%) and left to dry. The dried artificial pollution layer had a thickness of approximately 200μm. Specimens were removed from the desiccator only to conduct contact angle measurements.
Contact Angle Measurement
Contact angle measurements were performed at defined intervals on the unpolluted surface of the silicone as well as on the artificial pollution layer. Three contact angle values were measured: static contact angle after 1 min, dynamic advancing, and dynamic receding contact angle. The procedure for contact angle measurement saw:
• a 5μl water droplet put on the surface and the static contact angle measured after 1 min;
• 10μl of water added to the droplet with a rate of 1 μl/s using a syringe and measurement of dynamic advancing contact angle (see Fig. 2 left);
• a pause of 5s to allow the water droplet shape to stabilize;
• 5μl of water removed from the droplet at a rate of 5μl/s;
• the remaining 10μl of water removed by a syringe at a rate of 0.2μl/s followed by measurement of receding contact angle (see Fig. 2 right).
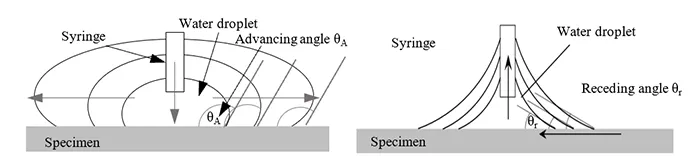
During expansion and contraction of the water droplet, measurements of the dynamic contact angles were conducted when the point of contact between the side of the water droplet and the surface moved. The contact angle at the first such movement on the left and right of the droplet was measured.
Contact angles were measured after defined intervals of 16h, 24h, 40h, 48h, 72h, 96h, 168h, 240h, 504h, and 1008h. Compared to previous investigations, contacts angles were measured at more points in time. This was regarded as especially important at the beginning of the transfer time since a rapid increase in receding contact angle has been observed at that point.

Results
Measurements of contact angles on unpolluted and polluted surfaces of the silicone rubber were evaluated separately. The focus of measurements was on static and dynamic receding contact angles. Static angle provides information about surface hydrophobicity whereas past research has demonstrated that receding contact angle correlates to hydrophobicity recovery and transfer. Measurement of contact angles on unpolluted surfaces were conducted to evaluate influence of nitric acid on hydrophobicity and its recovery over time. Measuring contact angles on the artificial pollution layer allowed evaluating the ability of the material for hydrophobicity transfer after acid immersion.
To determine capability of the materials being investigated for hydrophobicity transfer, measurement of the dynamic receding contact angle was conducted without pre-stressing. The angle was measured at different times on the unpolluted silicone surface (see Fig. 3) as well as on the surface of the artificial pollution (see Fig. 4). These measurements showed that dynamic receding contact angles remain unchanged on the unpolluted surface and increase from their initial low values after 16h to their long-term value between 60° and 80° after 168h hours on the surface of the artificial pollution. Only one material showed further increase after this time.
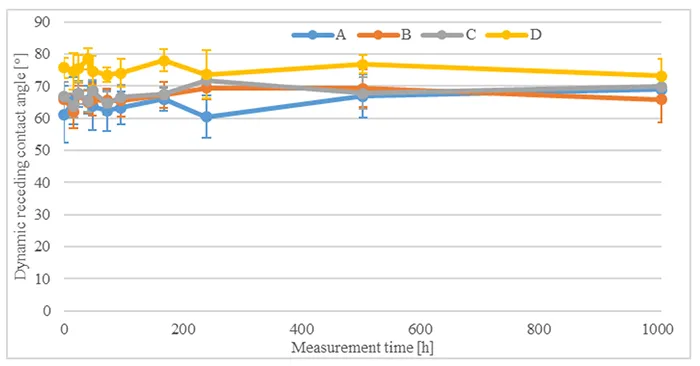
This shows that all investigated materials remained hydrophobic over time and were capable of hydrophobicity transfer to the artificial pollution layer when not pre-stressed by immersion in acid.
1. Hydrophobicity Recovery after Immersion in Nitric Acid
The decreased hydrophobicity during the acid immersion and subsequent hydrophobicity recovery were evaluated by measuring the contact angles on the unpolluted surface of specimens. Recovery of hydrophobicity of silicone rubber samples after immersion in nitric acid was evaluated by contact angles on unpolluted surfaces.
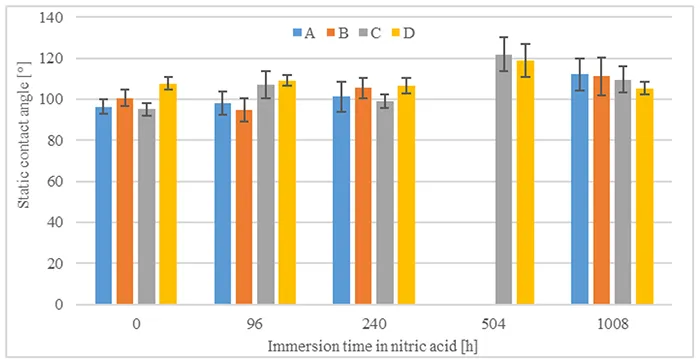
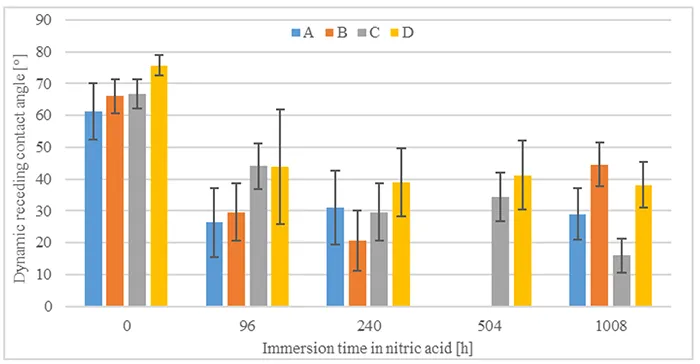
Evaluations of static and dynamic contact angles immediately after immersion in nitric acid and without time for hydrophobicity recovery are shown in Figs. 5 & 6. Comparing the pre-stressed samples with their initial condition (0h immersion), static contact angle does not seem to be impacted negatively by immersion in nitric acid nor by duration. On the other hand, it is observed that nitric acid causes a decrease in the dynamic receding contact angle, even though this does not seem to correlate to time of immersion in nitric acid.
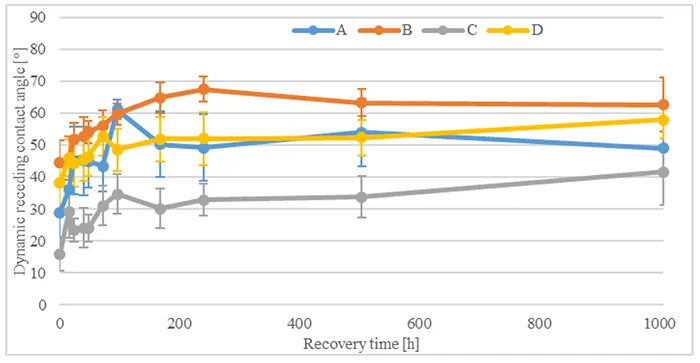
Over time, it is expected that dynamic receding contact angle will recover close to its initial state. Fig. 7 shows the increase in dynamic receding contact angle over the entire recovery period after 1008h of immersion in acid. As can be seen, receding angles recover to higher than 40° for all materials. Dynamics of hydrophobicity recovery observed for shorter acid immersion times show similar behaviour.
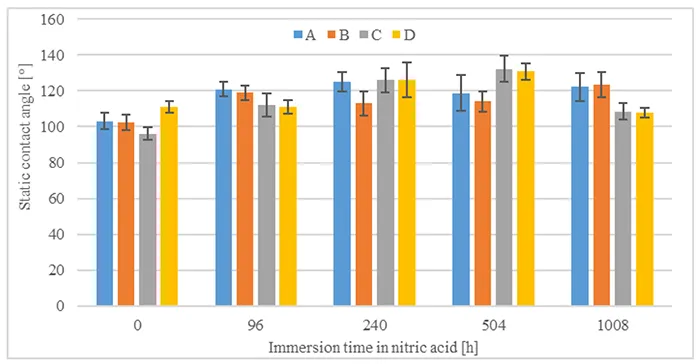
It is also interesting to compare static contact angles after 1008h of recovery and different acid immersion times, as shown in Fig. 8. Static contact angles show an increase compared to the same materials without pre-stressing.
In summary, all materials demonstrate capacity for hydrophobicity recovery after immersion in nitric acid. Static contact angles do not seem to be influenced by immersion in nitric acid, while dynamic receding contact angles recover to values above 40°. The results confirm that materials recover their function of suppressing leakage currents.
2. Hydrophobicity Transfer to Artificial Pollution Layer
Hydrophobicity transfer from the bulk silicone material to the surface of the artificial pollution layer can be evaluated by measuring dynamic receding contact angle to allow any given statement on electrical performance. This is therefore the focus of results presented below.
Fig. 9 shows initial measurements of dynamic receding contact angles after 16h of transfer time and after different durations of acid immersion. It can be observed that contact angles measured without acid immersion are below 20° and in case of material B cannot be measured at all. This indicates low to no hydrophobicity transfer at this point. The same can be observed for measurements after 504h and 1008h of acid immersion. Measurement after 96h shows especially high dynamic receding contact angles, in the case of material D reaching above 60°.
To evaluate influence of immersion in acid on hydrophobicity transfer, Fig. 10 compares dynamic receding contact angles for all materials after 1008h acid immersion and different transfer times. After transfer has begun, measured contact angles increase rapidly within the first 96h and reach values above 55°. They then continue to increase until 168h of transfer time, reaching values between 65° and 90°. Measured angles then stabilize at these values until the end of the test.

Figs. 11 & 12 show influence of different acid immersion times on hydrophobicity transfer for two materials, B and D. Comparing angles measured shows that hydrophobicity transfer occurs irrespective of material or duration of acid immersion. Nonetheless, the dynamics of hydrophobicity transfer differ based on material and acid immersion time.
In the case of Material B, measured contact angles increase at a rate equal to angles measured without pre-stressing. One measurement that stands out is transfer after 504h acid immersion time. Transfer here is considerably slower and angles increase with every measurement until 1008h transfer time. By contrast, for Material D, hydrophobicity transfer is faster after acid immersion compared to measurements without pre-stressing. Final values reach similar angles between 90° and 100° after 240h transfer time.
Static contact angles for different acid immersion times and after a total transfer time of 1008h were evaluated as well. Fig. 13 shows that static contact angles reach values around 140° after the period being evaluated, irrespective of acid immersion time.
In summary, all materials tested showed the capacity for hydrophobicity transfer after immersion in nitric acid, with dynamic receding contact angles recovering to higher than 60°. These results indicate that these materials recover their function to suppress leakage currents.
Tracking & Erosion Resistance
To investigate influence of acid attack on resistance to tracking and erosion of silicone rubber, test specimens were first stored in an acidic solution for defined periods. Afterwards, they were tested with the inclined plane test according to IEC 60587. Some of the specimens were additionally pre-stressed by boiling before the test.
Samples measured 120 x 50 x 6 mm, as required for the inclined plane test as per IEC 60587. After preparation, samples were left to cool to the room temperature and then placed in a container with acidic solution.
Materials & Specimens Tested
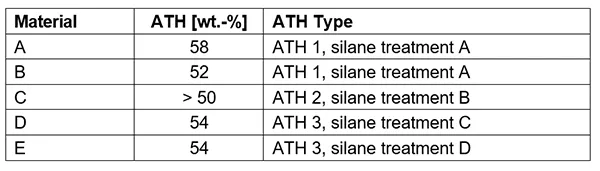
Multiple materials were tested with the main difference between them being in content of ATH filler. In addition, ATHs of different type and surface silane treatment were also investigated. Table 2 lists the different materials tested and indicates percentage of wt.-% content as well as silane treatment of the ATH in the formulation.
Test Method
Resistance to Tracking & Erosion
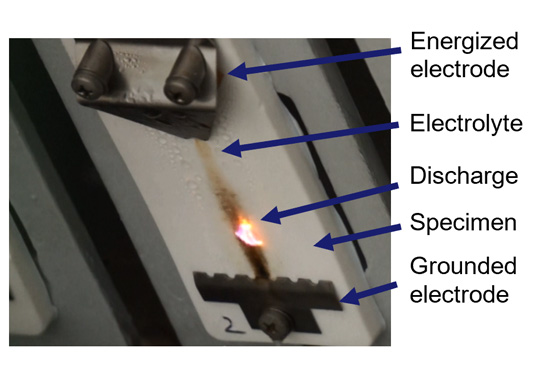
Evaluation of resistance to tracking and erosion is conducted using the inclined plane test according to IEC 60587. This standard describes the shape and number of samples to be tested, test methods and end point criteria. It also provides preferred voltages relative to contaminant flow rates.
For the tests discussed here, Method 1 was selected (i.e. application of constant AC voltage for 6h). A combination of voltage 4.5 kV and flow rate of 0.6 ml/min was also chosen. This is a higher voltage than the minimal requirement in IEC TR 62039, which is 3.5 kV. However, a higher voltage means a stricter requirement. As the end point criterion, Criterion A was chosen which states that the tracking and erosion resistance test is passed successfully after 6h, assuming none of the 5 specimens:
• exceeds a leakage current of 60 mA for 2s;
• shows a hole (full bulk erosion) due to intense erosion;
• starts burning.
Results are summarized as weight loss of the specimen during the test as well as length, width and depth of the erosion track.
Pre-Stressing
A 0.1 mol/l acidic solution of de-ionized water and nitric acid (HNO3) was used to simulate acid attack. Reduced acid concentration compared to the test on silicone rubber resistance to acid was selected to avoid formation of cracks on the surface.
Five samples were placed in containers each with 1.3l of acidic solution and stored at 35°C for defined periods: 96h, 240h, 504h, 1008h and 2184h. When storage time elapsed, the samples were removed from the acidic solution, rinsed with de-ionized water and left to dry at room temperature for about 12h.
After the samples were removed, pH of the solution was measured. Together with loss of mass of the specimens, any change in pH towards less acidic indicates a reaction between the acid and the silicone specimens in which ATH is dissolved.
Pre-stressing by boiling was performed according to IEC 62217 and conducted in a vessel with distilled water and 0.1% by weight NaCl. Specimens were put into the vessel with boiling solution for different time intervals: 42h (time for pre-stressing according to IEC 62217), 96h, 168h and 240h. Weight of specimens before and after pre-stressing was recorded. To limit number of tests and specimens required, it was decided to boil only those after 504h acid attack. This would reveal any trends in tracking and erosion resistance after successive pre-stressing by acid and boiling.
Visual Evaluation of Erosion
Specimens were weighed before and after acid attack and drying, with any weight loss being indicative of a reaction between acid and filler or other additives. Visual changes on the surface of the specimens after drying were evaluated as well. Since appearance of surface erosion during the inclined plane test differs from what is observed without acid attack, a qualitative evaluation was first conducted. For quantitative evaluation of the inclined plane test, weight loss and erosion depth are considered most relevant.
After an inclined plane test, erosion of the bulk is usually observed along the lower surface of the specimen next to the grounded bottom electrode since this is where arcing leads to greatest thermal stress. Still, during the inclined plane test, light discharges and arcing can often be observed across the entire specimen surface between energized and grounded electrodes. Fig. 14 shows the area of bulk erosion on a specimen without pre-stressing by acid attack. One specimen is without pre-stressing and the other with pre-stressing by boiling for 42h. These tests were conducted according to IEC 60587 & IEC 62217 (for the boiling procedure).
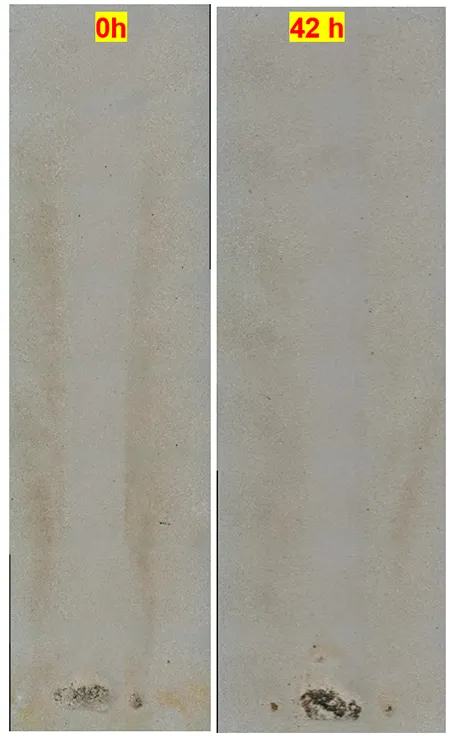
As evident, boiling does not change the location of bulk erosion but rather influences its length, width and depth.
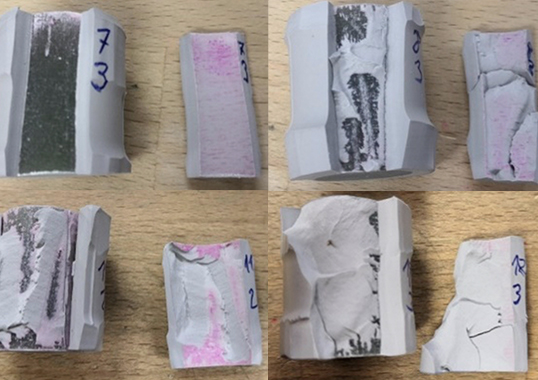
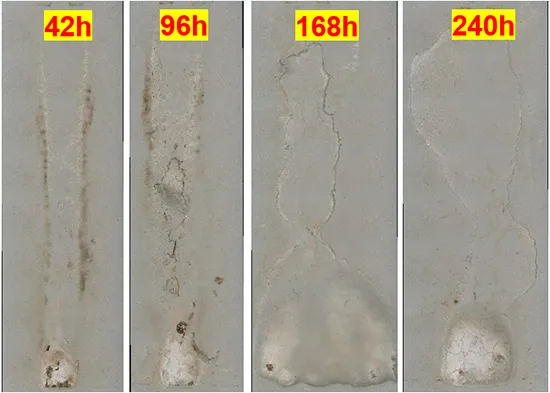
Influence of different duration of acid attack was analyzed for one material and is shown in Fig. 15. Now, the area of erosion is larger and there is bulk erosion not only next to the grounded electrode but also in a honeycomb pattern stretching toward the energized electrode at the top of the specimen.
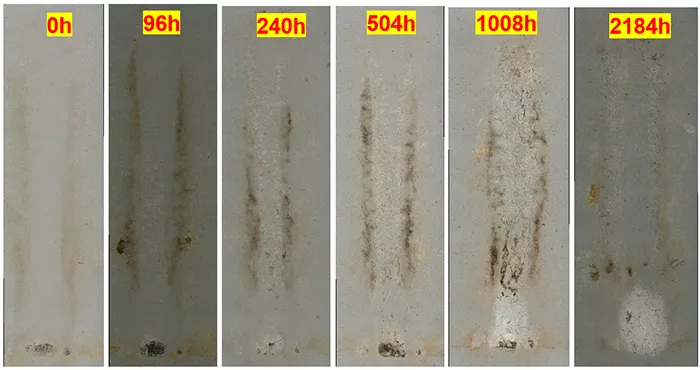
Length of bulk erosion area increases with longer time of acid attack. The honeycomb pattern of erosion also increases in area and depth with longer time of acid attack. After 96h it covers only a small portion of area in the middle between electrodes. After 1008h of acid attack, this type of erosion covers the entire area between electrodes, while after 2184h a complete layer of silicone is eroded between the electrodes. The depth of erosion, however, is less than where there is bulk erosion.
Boiling was shown to influence length and depth of erosion in specimens without pre-stressing by acid attack. Influence of pre-stressing by boiling for different times after 504h of acid attack was investigated as well and Fig. 16 shows the results. Compared to erosion after 504h acid attack as in Fig. 15, the honeycomb pattern of erosion now covers the same area but is deeper and in places begins to resemble bulk erosion. After 168h boiling, the honeycomb pattern of erosion is fully replaced by complete bulk erosion of the surface between electrodes.
The reason for this type of erosion is most likely the combination of discharges distributed over the complete surface of the specimen and lack of ATH in the layer just below the surface due to acid attack. It can also be seen that the extent of this erosion increases with increased time of pre-stressing by boiling.

Erosion Depth & Mass Loss
It is usual to evaluate results of tracking and erosion resistance testing by measuring depth of erosion and mass loss by the specimens following the inclined plane test. To evaluate the impact of pre-stressing and resistance to tracking and erosion, mass loss during the inclined plane test and overall needs to be evaluated.
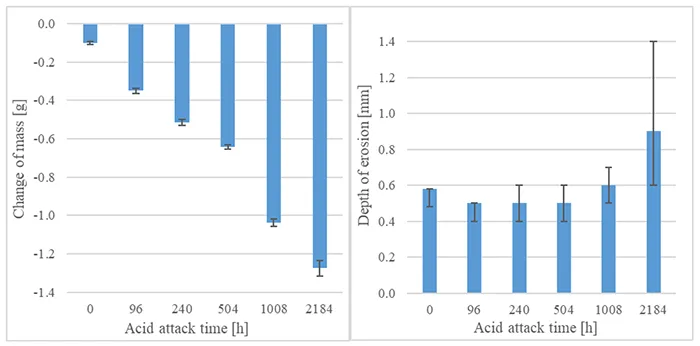
Mass loss and depth of erosion for different durations of acid attack were evaluated for one material and are presented in Fig. 17. Overall mass loss increases with longer duration of acid attack, but depth of erosion does not follow this increase. Up to 1008h, depth falls between 0.4 and 0.6 mm and only increases significantly after 2184h acid attack. (Note: Maximum and minimal depths of erosion are indicated in Fig. 17 with error bars.)
Using the materials listed in Table 2, influence of ATH filler on erosion after pre-stressing was also investigated. Fig. 18 shows evaluated overall mass loss, conducted after 504h of acid attack and with different durations of pre-stressing by boiling. As can be seen, overall mass loss increases with increased duration of pre-stressing by boiling. Differences between materials can also be observed.
The difference between Materials A and B is interesting. After 42h boiling, they show the same mass loss but for longer durations of boiling, Material A, with higher ATH content, shows less mass loss. The most likely explanation is that higher ATH content acts as a better flame retardant even after acid attack, since a relatively lower proportion of ATH is dissolved by the acid. ATH content in Material C is estimated to be only above 50 wt.-%. However, this Material shows lowest overall mass loss. Materials D and E fall between A and B with respect to overall mass loss and this correlates with about 54% ATH content.
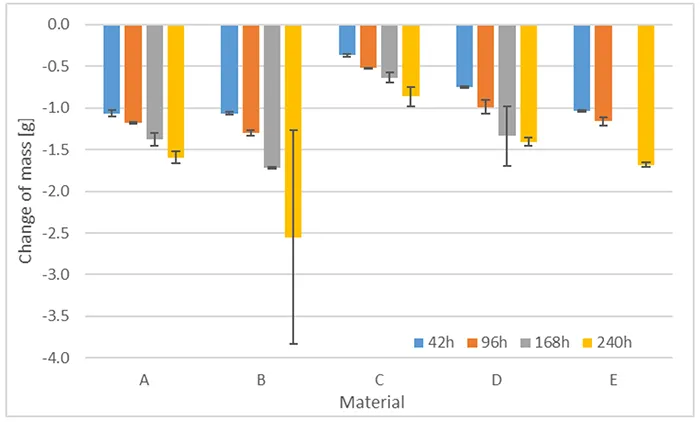
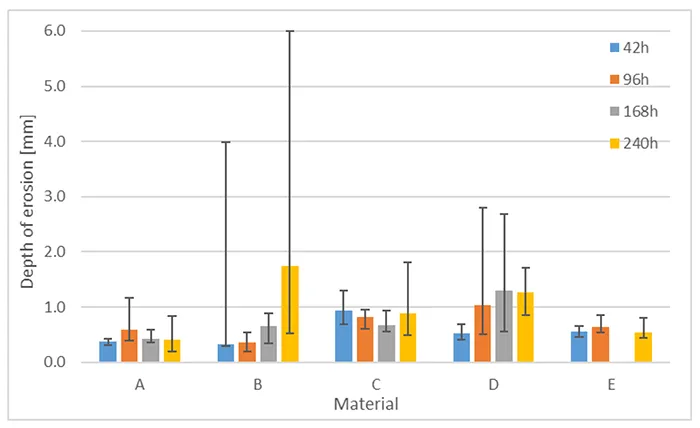
Fig. 19 shows erosion depth for these materials. Error bars indicate minimum and maximum measured erosion depth. As evident, erosion depth does not follow the same increasing trend as does mass loss. Two outliers can be observed as well, both for a sample of Material B. One of these samples shows an erosion hole and failed as well due to current exceeding 60 mA.
Conclusions
An investigation was conducted to evaluate influence of nitric acid on hydrophobicity recovery and transfer of silicone rubber materials. After pre-stressing by immersion in acid, static and dynamic receding contact angles were measured at different recovery and transfer times. Measurements were conducted both on the unpolluted silicone surface and on the surface of an artificial pollution layer. Measured angles were compared with those for materials without pre-stressing.
Results indicate that acid immersion does not have a negative influence on static contact angles for hydrophobicity recovery and transfer. Static contact angles on the unpolluted surfaces showed a slight increase compared to surfaces without pre-stressing, while static angles on the surface of the artificial pollution layer do not differ significantly.
Differences were observed in the dynamics of hydrophobicity recovery and transfer as measured by dynamic receding contact angles. Measured dynamic receding contact angles can increase rapidly, as in case of material D, where the increase in the first 168h of the hydrophobicity transfer is faster compared to that without pre-stressing. In the case of Material B, however, increase in dynamic receding contact angles during transfer more closely follows the increase without immersion in nitric acid. For Material B, measured dynamic receding contact angles after 504h acid immersion are considerably lower compared to measurements after other acid immersion times. This is an interesting finding, and the cause can perhaps be linked to influence of acid immersion, of the artificial pollution layer or of the conditions during transfer.
Results are meaningful for evaluation of hydrophobicity of composite insulators with silicone rubber housings in the field and their capability to suppress leakage currents. Static contact angles can be relevant during evaluation of the hydrophobicity class with the spray method according to IEC TS 62073 once water has stopped dripping of surfaces.
Dynamic contact angles offer an indication regarding a material’s ability for hydrophobicity retention under electrical stress. The results discussed above demonstrate that immersion in nitric acid does not have a negative effect on dynamic contact angles on unpolluted or polluted surfaces since all materials investigated showed the capability for hydrophobicity transfer after immersion in nitric acid. Dynamic receding contact angles recovered to values above 40° on the unpolluted surface and above 60° on the surface with artificial pollution. These results confirm that silicone rubber materials recover their function to suppress leakage currents along an insulator in service.
The acid and its concentrations used in these investigations acts to dissolve the ATH filler in a silicone rubber formulation. As a result, pre-stressing by acid attack does decrease resistance of the silicone rubber to tracking and erosion. After acid attack, erosion was observed on the complete surface of specimens between electrodes. Appearance of the erosion also differs. It is not bulk erosion, as observed without pre-stressing, but rather a honeycomb pattern and superficial. The extent of this type of erosion increases with longer duration of acid attack. Nonetheless, despite dissolution of ATH and the different kind of the erosion present, depth of bulk erosion is not significantly influenced by acid attack. But this is not the same for mass loss, which increases due to the honeycomb pattern of erosion and is related to duration of acid attack.
Finally, it was shown that amount of erosion depends on ATH content. A higher content resulted in a lower increase in mass loss of materials tested. This is likely because the same amount of ATH is dissolved from the specimens, irrespective of their ATH content. A material with higher ATH content will therefore lose a smaller relative proportion of this flame-retardant and only superficially, thus maintaining superior resistance to tracking and erosion.