The operating characteristics and service life of composite polymer insulators is critically dependent on the interaction of their shed surfaces with water, salts, pollutants and algae.
This edited contribution to INMR by Kavin Bhuvan and Prof. Dennis K. Hore of the University of Victoria in Canada, in cooperation with Sanskruti Padmawar and Rajkumar Padmawar of ASAsoft Canada, discusses efforts to characterize changes to silicone rubber surfaces in response to chemical, electrical, and biological stresses. Recently, unique testing environments that range from laboratory studies of silicone surfaces to full-scale tracking wheel tests have enabled monitoring surface changes at depths ranging from nanometers to microns to millimeters.
A new testing apparatus has also been developed called μ-IPT that helps bridge the gap between field studies of real insulator materials, destructive inclined plane test (IPT) regimes, and controlled laboratory conditions. Finally, there is a discussion of plans to combine laboratory data from experiments at all length scales with manufacturing data to generate realistic digital twins.
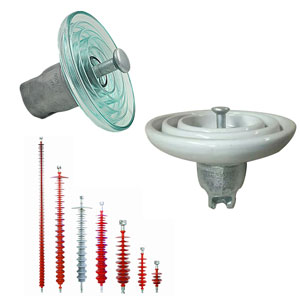
Polymeric composites are increasingly being used on power grids in place of conventional glass or ceramic insulators. Silicone-based materials are light, heat-resistant, chemically stable and hydrophobic, leading to long-term performance and cost-effectiveness during production, installation, and maintenance.
In general, composite polymer insulators are composed of a polydimethylsiloxane (PDMS, silicone rubber) polymer matrix with dispersed inorganic fillers. Addition of silica and alumina trihydrate (ATH), is known to improve the physical strength and electrical/heat resistance of the materials, respectively.
Silicone rubber has unique surface properties that allow it to retain its hydrophobicity during ageing from contamination, weathering and high voltage stress. Time-dependent restoration of hydrophobicity occurs under dry conditions through diffusion of low molecular weight siloxanes from the bulk of the polymer matrix to the surface. The exceptional insulation properties exhibited by silicone rubber are known to be due to its typical chemical composition. But details of how insulation properties are lost during the ageing process are still not fully understood.
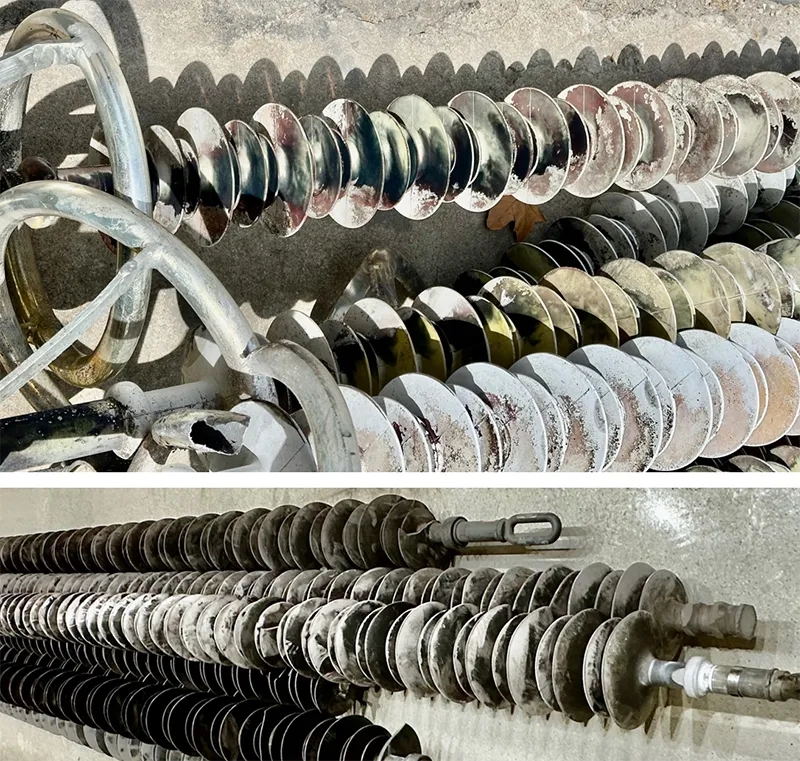
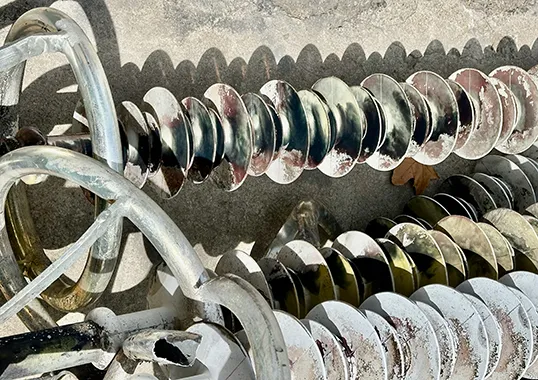
Although outdoor high voltage silicone composite insulators show exceptional properties, they are also vulnerable to natural degradation processes under standard operating conditions over time. Ageing is a gradual process that results in loss of function and eventual breakdown of the materials. Repeated breakage and reformation of the bonding in the material lead to microscopic and macroscopic changes in appearance and performance. Discoloration, for example, is often one of the first signs of ageing, which can be accelerated by UV and heat, leading to formation of free radicals.
Factors that contribute to ageing include heat, humidity, UV radiation, wind, dust, acid rain, chemical pollutants, temperature, and microbiological organisms. Salt is also a significant factor in coastal areas.
Numerous studies have been conducted to understand the degradation and ageing mechanisms of silicone rubber insulators in both natural conditions and in accelerated ageing environments, including electrical, corona, and ultraviolet testing. Material characterization techniques that have provided insight into the changes of the underlying molecular and macroscopic structure include:
• scanning electron microscopy (SEM);
• energy dispersive X-ray analysis (EDX);
• thermogravimetric analysis (TGA);
• contact angle measurement;
• X-ray photoelectron spectroscopy (XPS);
• mechanical testing; and
• attenuated total reflectance infrared (ATR-IR) spectroscopy.
ATR-IR spectroscopy is particularly useful since it can help determine the degree of degradation caused by different electrical and environmental effects. It has been used to characterize high voltage composite insulators of various ages and establish a correlation between extent of degradation and residual service life.
Interpretation of the resulting IR spectra can be significantly aided by application of two-dimensional correlation spectroscopy (2D-COS), which is a potent tool for extracting hidden information in conventional one-dimensional ATR-FTIR and Raman spectra.
A new chemical/electrical stress and associated characterization technique, referred to as μ-IPT, is proposed which aims to bridge the gap between controlled environment laboratory testing and the ability to use material derived from actual insulator samples. Finally, integrating experimental evidence with predictive computational tools and manufacturing data will enable development of a comprehensive digital twin framework, providing pro-active assessment of polymer insulator reliability under diverse service conditions.

Laboratory Testing on Silicone Reference Surfaces
The main advantage of laboratory testing is that conditions can be well controlled, such that the observations can then be correlated with whatever parameter was varied in the experiment. Moreover, laboratory studies also allow testing a wide range of different insulator materials.
The primary component of polymeric insulator sheds is silicone rubber, also known as polydimethylsiloxane or PDMS. Insulators are made from PDMS along with additives such as flame retardants, fillers, and dyes. One advantage of preparing silicone rubber samples without these colorants and fillers is that PDMS material is inherently transparent and therefore lends itself well to a range of transmission-based optical spectroscopy and imaging. For colored materials, reflective-based techniques must be used.
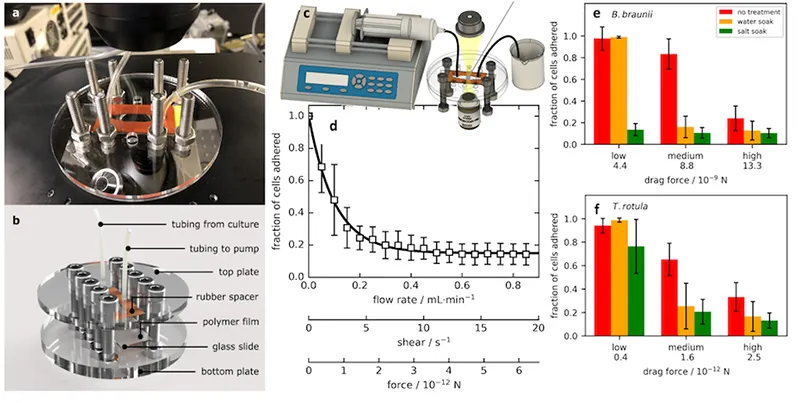
In recent years, the transparency of PDMS reference materials has allowed performing a range of surface characterization. One example is a study where a simple flow cell was built (see Fig. 1a as well as the schematic in Fig. 1b) where the bottom surface of the channel was coated with PDMS. The PDMS substrate was used immediately after preparation and curing, following one month of water exposure, and after one month exposure to high salinity (5% NaCl by total weight).
Algae cells (freshwater B. braunii) were introduced into the channel, and allowed to settle onto the PDMS surface for 15 min. A syringe pump was then used to push buffer solution through the channel (see configuration in Fig. 1c) with increasing flow rate. The initially adhered cells were observed through the microscope, and image processing software was used to keep track of the fraction of cells that remained adhered as a function of flow rate. Since channel dimensions are known, the volumetric flow rate can be converted to surface shear, and ultimately determine the force required to remove the cells (see Fig. 1d) which can be interpreted as their adhesion force.
Findings (see Fig. 1e) indicated that, under all but the lowest drag forces, the amount of algae that could be removed from the surface substantially decreased when the silicone rubber was exposed to water, and further decreased upon salt exposure. The same findings were obtained using sea water alga (T. rotula as in Fig. 1f) and similar results were obtained.
It was then possible to correlate these results with surface spectroscopy that suggested the effect of long salt/water exposure was to rearrange the surface methyl function groups of the silicone. A further important conclusion of this study was that the force required to remove cells, even after only 15 min. of incubation, far exceeded the range of shear forces that could be applied by wind or rain. This helps explain the extreme susceptibility of insulator materials to algal contamination when they are adjacent to both fresh and seawater environments.

Tracking Wheel Exposure & Testing on Whole Insulators
Although preparing PDMS films offers ultimate flexibility and control as well as many options for different types of measurements, a major shortcoming is that one is not studying the actual insulator material (including all fillers, cross-linkers, dyes, etc.) nor the actual insulator geometry. To this end, a tracking wheel with advanced control features consisting of two 300 L tanks was built that can accommodate a total of 8 insulators. The device (shown in Fig. 2) can automatically lift the entire rotating assembly out of the liquid to perform a series of wet and dry cycles.
Attenuated total reflection (ATR) infrared (IR) spectroscopy was then used to study the surfaces of the polymer material that was subsequently cut from dead-end insulator sheds following 20K, 25K, 27.5K and 30K cycles on the tracking wheel using a 4:1 wet/dry cycle ratio at a rate of 480 cycles per day. During the time the devices were energized, a 60 Hz AC field at 12.5 kV was applied across the insulator.
IR spectroscopy is a powerful technique in that it reveals molecular fingerprints from components of the polymer sample. It even offers sub-molecular information since the characteristic resonances in the mid-IR region (500–5000 cm^(-1) or 2–20 μm) correspond to specific chemical functional groups. The ATR variant of this technique is particularly useful for insulator samples since electric field is highly localized within the first 1–2 μ of the polymer surface. This is useful since the bulk polymer material strongly absorbs mid-IR light such that effective penetration depth is small.
Absorbance spectra were obtained from the ratio of the wavelength-dependent reflected intensity Iinsulator (ω) to that obtained without the sample present Iair (ω) resulting in:
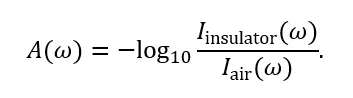
These absorbance spectra are plotted in Fig. 3a for the low frequency 500–1350 cm-1 region and in Fig. 3b for the high frequency 2800–3700 cm-1 region. Separating these two regions facilitates inspection of the insulator shed spectral features since absorbance of the low frequency bands is about 5 times stronger, and there are no resonances of interest in the 1350–2800 cm-1 range.
The spectral peaks centered at 555 cm-1, 663 cm-1, and 733 cm-1 corresponding to Al–O bending and stretching vibrations for the aluminum trihydrate (ATH) filler. IR bands centered at 789 cm-1, 1010 cm-1, and 1262 cm-1 reflect Si–(CH3)2, Si–O–Si (backbone), and Si–CH3 bending modes, respectively. The effect of tracking wheel cycles on the methyl stretching mode at 2965 cm-1 can also be seen within the spectral range 3200–3700 cm-1 for the OH modes.
All bands exhibited continuous decrease with increasing number of cycles on the tracking wheel. This reduction in IR absorbance is attributed to degradation and erosion of the silicone rubber matrix and the main filler ATH, as evidenced by the reduction of bands corresponding to the primary Si–O–Si peak (1010 cm-1) and methyl functional groups (789 cm-1, 1262 cm-1, and 2965 cm-1). As with many polymers, reduction in the absorption peak areas of various functional groups is a sign of ageing.
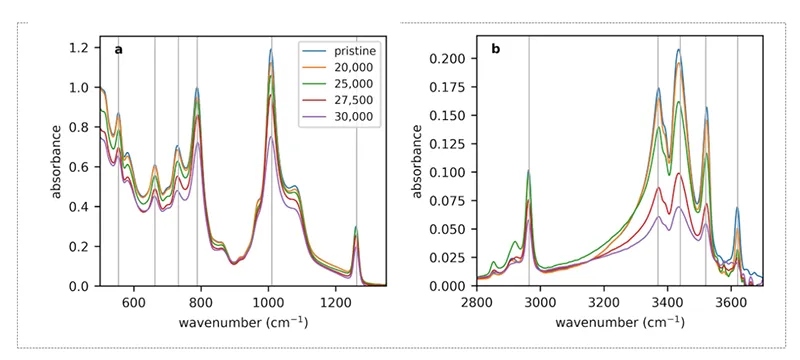
Notably, the IR bands corresponding to characteristic peaks for the silicone polymer itself did not change with tracking wheel exposure time. From this, it can be concluded that there is no new chemical bond formation due to ageing during this testing period..
It has previously been reported that a decrease in the peak intensity of the methyl functional group is associated with increasing surface hardness. The decreased absorbance of the high frequency C–H stretching modes further supports this claim. The most noticeable change is reduction in IR absorbance of the bands corresponding to Al–O and OH, suggesting the degradation of ATH. The eventual degradation of silicone composite insulators is known to occur through the oxidation of methyl groups:
(CH3)2 SiO + 4 O2 → SiO2 + 2 CO2 + 3 H2O
which leads to the formation of -OH (hydroxyl groups) along with the decomposition of ATH to form Al_2O_3 crystals at the surface via the consumption of hydroxyl groups according to:
2 Al(OH)3 → Al2O3 + 3 H2O
It can be concluded that possible causes for surface modification in silicone composite insulators on the tracking wheel are degradation, erosion, and hardening of the surface.
Additional insight into the nature of the interactions upon simultaneous salt contaminant and electrical exposure can be obtained using a two-dimensional correlation analysis (2D-COS) of the vibrational bands. This is based on the principle that a complex-valued correlation coefficient C can be defined according to:
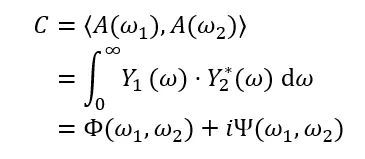
for every combination of absorbance values at IR wavenumbers ω1 and ω2, where Y1 is the Fourier transform of A(ω1) and Y2* is the inverse Fourier transform of A(ω2). The real part of this correlation is termed the synchronous component Φ(ω1,ω2) since it displays which spectral components are changing in phase.
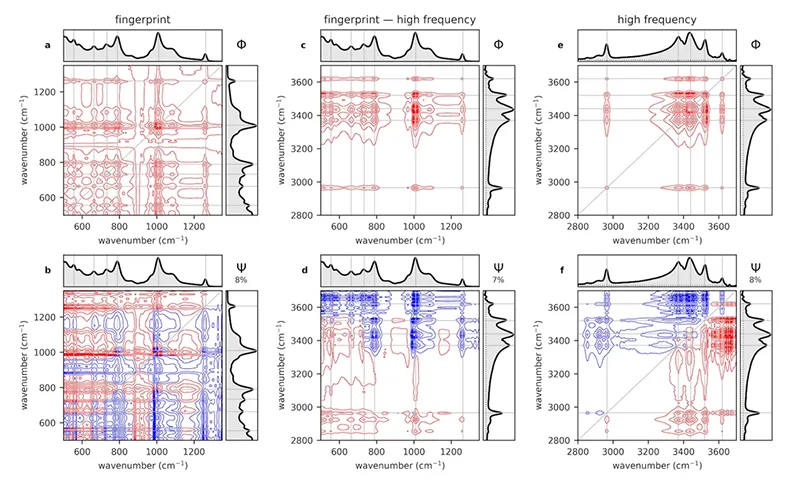
The diagonal line Φ(ω1=ω2) is then merely the autocorrelation spectrum that displays which bands are changing most as a result of exposure to the tracking wheel conditions. The top row in Fig. 4 displays the correlation between bands in the (a) low frequency, (c) low-high mixed, and (e) high frequency regions. These are merely sections of a larger map that have been tiled for convenience. The fact that all features are positive (red contours) indicated that all bands are decreasing with an increasing number of tracking wheel cycles. The most valuable information from this analysis is contained in the asynchronous component Ψ(ω1,ω2) displayed in the bottom row of Fig. 4.
The general principle for interpreting this Ψ map (considering that Φ is all positive) is that if the Ψ cross peak is positive, the change in ω1 occurs before the change in ω2. If the Ψ cross peak is negative (blue contours in Fig. 4) then the decrease in absorbance at ω1 occurs after A(ω2) drops. To aid in interpretation of this map, some characteristic bands listed in Table 1 must first be considered.
By chaining together the above rules, the sequence: Al–O (555 cm-1, 663 cm-1, and 733 cm-1) of ATH > Si–O–Si (1010 cm-1) backbone mode > Si-methyl (789 cm-1 and 1262 cm-1) is arrived at. This signifies that ATH was affected first and is then followed by changes in the polymer backbone, and finally the methyl side chain. High-frequency bands are primarily related to the asymmetric stretching of methyl (2965 cm-1) and -OH stretching modes (3200–3700 cm-1) of ATH. The negative sign of the CH3 peak at 2965 cm-1 with respect to the -OH peaks (3370, 3440, 3520, and 3620 cm-1) in the asynchronous map reveals that the decrease in ATH absorbance occurs before that of pendent methyl groups. Overall, the sequence of alteration of the composite polymer functional groups due to electrical tracking is: OH of ATH, followed by Si–O–Si polymer backbone, and then the hydrophobic methyl groups.

Motivation for New Testing Apparatus
So far, an example of the kind of detailed analysis that is possible using reference materials such as transparent PDMS is provided. But it must be acknowledged that the characteristics of actual insulator material surfaces may differ on account of other components in their formulation.
Although the tracking wheel offers the possibility to study pieces cut from insulator sheds, the tests are long (on the order of months for 30K cycles) and the conditions are relatively gentle such that signs of material ageing might not be observed on the time scale of that experiment.
On the other hand, tests such as inclined plane (IPT) provide a high degree of chemical (pollutant) and electrical stress such that material degradation is accelerated. However, IPT is a destructive exercise, where the size of the crater left behind is typically measured. It also uses a specially formulated piece of rubber, using the same formulation but in a different form factor from insulator sheds.
An apparatus called μ-IPT™ is therefore being studied, which is a miniaturized and lower stress version of an IPT configuration. It is made smaller so that it can accommodate a sample cut from an actual insulator shed, i.e. approx. 15 mm × 15 mm. The overarching goal of the μ-IPT experiment is to provide markers of insulator ageing that can be traced back to material properties at time of manufacturing. For this reason, what is of most interest is to measure the response of the silicone surface before any visible damage occurs.
A computer-controlled syringe pump is controlled via a feedback loop to the sample’s electrical sensors. The sample is iterative wetted, followed by application of a high voltage that leads to dry band arcing. When measured current falls below some threshold value, the sample is wetted once more and the cycles continue. In this way, hundreds of arcing cycles can be performed over a span of minutes and conditions can be controlled to avoid visible pitting of the sample.
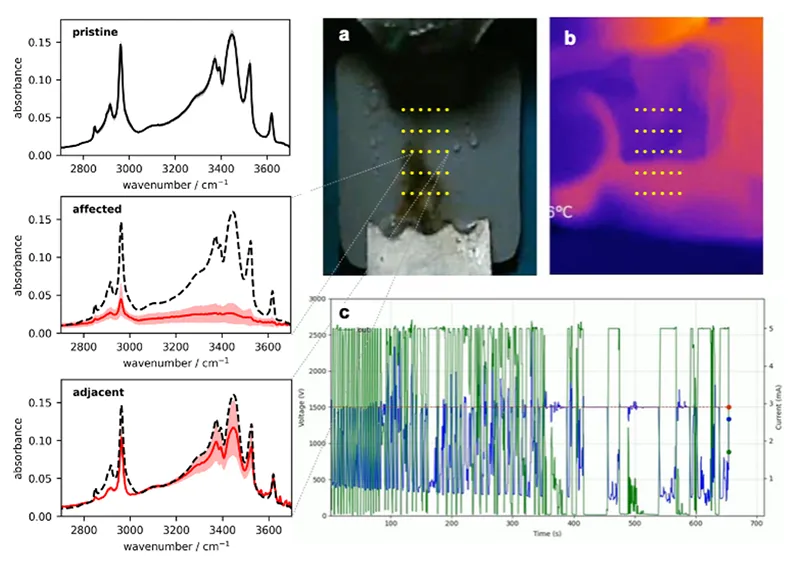
During the experiment, visible (see Fig. 5a) and thermal (see Fig. 5b) video data is recorded and synchronized with measured current. Each square wave pulse in the current data (see Fig. 5c) illustrates one wetting-arcing cycle.
Following a set number of cycles (typically in the 50–100 range), vibrational spectra are recorded at various positions on the sample surface as indicated by the yellow dots in Figs. 5a & b. Changes that occur directly as a result of wet and dry band arcing can then be analyzed. In areas where no arcing occurred, sample temperature was nonetheless raised due to electrical discharge. In this sense, while post-tracking wheel characterization provides a measure of average change in sample surface over a period of months, μ-IPT provides direct correlation between material response and local electrical stress on a millimeter spatial length scale.
Digital Twin Development
Together, manufacturing practices, laboratory testing and field studies can provide critical insight into the long-term performance of composite insulators. Data from controlled methods such as the tracking wheel and μ-IPT complement field observations, creating a foundation for connecting physical behaviour with predictive models.
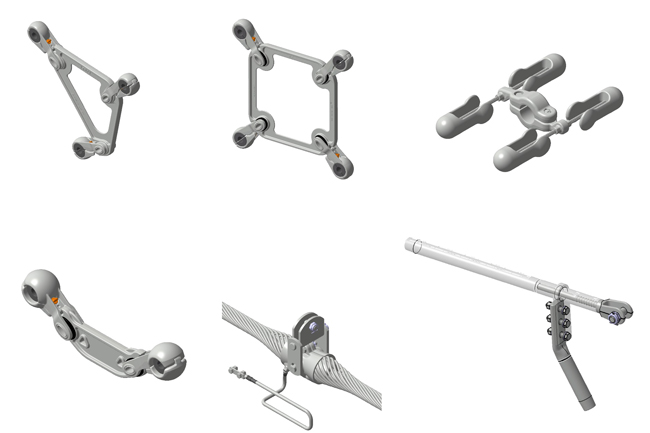
By combining these sources, it becomes possible to link practical performance outcomes directly with digital twin development. One central focus is the interface between thermal diffusion galvanized (TDG) fittings and fiber-reinforced polymer (FRP) rods. Variations in crimping pressure, clearance between rod and fitting, and the tendency of FRP to degrade internally before progressing outward all have measurable effects on structural integrity.
These small but significant factors determine how well an insulator withstands long-term stress in both mechanical and electrical dimensions. Correlating crimping pressure with mechanical strength provides a pathway to understand how structural conditions influence dielectric performance. Mechanical stress points often serve as precursors to electrical failure, and mapping this transition helps identify the mechanisms that drive long-term degradation.
Integrating these findings into digital twin models allows laboratory data, field studies, and manufacturing variables to converge into a predictive framework for insulator reliability.
A digital twin framework is being developed to integrate laboratory-scale experiments, manufacturing parameters, and field monitoring data. Simulations applying thermal, mechanical, and electrical stress are performed at the FRP–metal interface. These studies are validated with μ-IPT results, spectroscopy data, and crimping-pressure measurements, enabling predictive failure analysis and insights into long-term material degradation mechanisms.
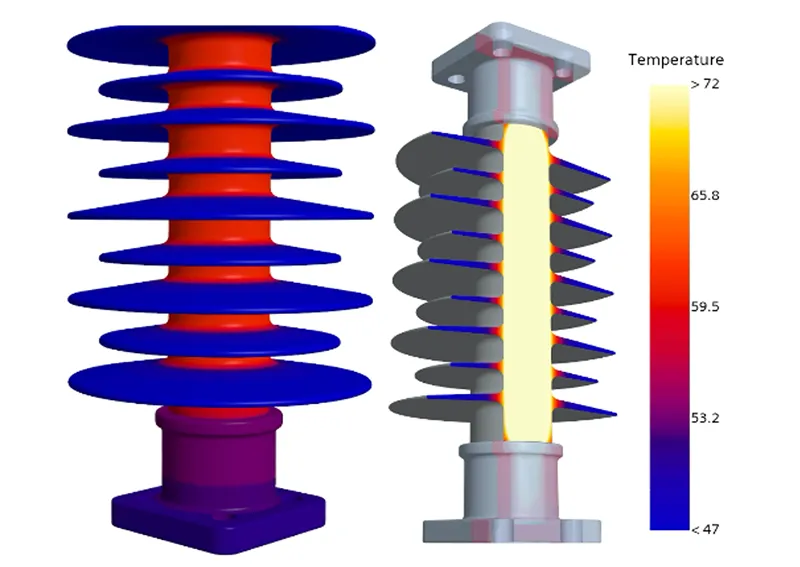
The data in Fig. 6 demonstrate application of digital twin modeling to understand external as well as internal behavior of polymer insulators under operational stresses. On the left, the surface temperature distribution shows how heat is dissipated across the housing, highlighting regions most exposed to environmental loading. On the right, the cross-sectional view provides a clear visualization of heat transfer within the fiber-reinforced polymer (FRP) core, illustrating how thermal gradients can build internally, even when the outer surface appears uniform.
By linking external and internal thermal responses, these simulations provide valuable insight into the coupled mechanical and dielectric performance of an insulator. Such data not only guides material and design optimization but also enables predictive maintenance strategies that can enhance long-term grid reliability.

Conclusions
In experiments with silicone reference materials, it has been demonstrated that exposure to water and salt can affect a polymer’s surface structure, and this in turn has consequences on algae adhesion. The shear force required to remove the cells are orders of magnitude stronger than those experienced from typical rain and wind shear, thereby accounting for the significant biofouling of insulators along coastal areas.
Understanding the reason for these changes from prolonged wetting requires concomitant investigation of the nanoscopic surface layer of the polymer, such as afforded by previously reported non-linear optical studies. Tracking wheel experiments provide an opportunity to study actual devices, with samples cut from insulator sheds. Surface IR spectroscopy combined with 2D correlation analysis of the vibrational bands has revealed the sequence of molecular changes that occur under the impact of electrical and environmental stresses.
That work has demonstrated that the initial effects of the tracking wheel can be seen in the response of the flame-retardant filler ATH. Subsequently, alterations occur in the Si–O–Si backbone of the silicone polymer.
Moreover, changes take place in the side chain methyl groups that impart hydrophobicity. Although there are advantages to both types of experiments, they also reveal a characterization gap, i.e. being able to perform tests on real insulator samples in a short time frame that can provide data from which service life can be evaluated. To this end, design of a miniaturized IPT-like experiment is in process, which is termed μ-IPT, combined with surface mapping for structural analysis.
Finally, input from all these experiments combined with factory data at the time of manufacturing is leading to creation to digital twins that will ultimately provide realistic predictions of insulator behaviour under a wide range of service conditions.

Acknowledgments
The authors are grateful to the Natural Sciences and Engineering Council of Canada (NSERC) for supporting this research through Discovery (RGPIN-2020-06030), Discovery Accelerator (RGPAS-2020-00049), Engage (539943-2019), Collaborate Research and Development (514186-2017), and Alliance (571104-2021, 597661-2024) grants. Some of those programs were in partnership with Mitacs and ASAsoft® (Canada) Inc. Md. Shafiul Azam and Canyu Cai contributed to the PDMS laboratory studies involving nonlinear optical characterization of the top nanometer of the material. Zhijing Wan, Ben MacVicar, Shea Wyatt, and Diana Varela participated in the algae adhesion studies. Kaitlyn Ramsay, Jaime Korner, and Katherine Elvira provided expertise in microfluidics used in the algae flow experiments. Harpreet Kaur contributed to the spectral analysis including 2D-COS of the IR data following tracking wheel exposure.
References
1. Xiong Y, Rowland SM, Robertson J, Day RJ. Surface analysis of asymmetrically aged 400 kV silicone rubber composite insulators. IEEE Trans Dielectr Insul. 2008;15:763–70.
2. Ghosh D, Khastgir D. Degradation and stability of polymeric high-voltage insulators and prediction of their service life through environmental and accelerated aging processes. ACS Omega. 2018;3:11317–30.
3. Venkatesulu B, Thomas MJ. Long-term accelerated weathering of outdoor silicone rubber insulators. IEEE Trans Dielectr Electr Insul. 2010;18:418–24.
4. Cai C, Azam MS, Hore DK. Temperature-dependent chemical functional group reorientation at silicone surfaces. J Phys Chem C. 2021;125:22214–22.
5. Han DH, Cho HG, Han SW. Effects of alumina trihydrate on the electrical insulation properties of HTV silicone rubber. In: Proceedings of the 7th International Conference on Properties and Applications of Dielectric Materials. Nagoya: IEEE; 2003. p. 381–4.
6. Raza MH, Khattak A, Ali A, Butt SU, Iqbal B, Ulasyar A, et al. Surface recovery investigation of silicone rubber composites for outdoor electrical insulation under accelerated temperature and humidity. Polymers. 2021;13:3024.
7. El-Hag AH, Simon LC, Jayaram SH, Cherney EA. Erosion resistance of nano-filled silicone rubber. IEEE Trans Dielectr Electr Insul. 2006;13:122–8.
8. Kim J, Chaudhury M, Owen M. Hydrophobicity loss and recovery of silicone HV insulation. IEEE Trans Dielectr Electr Insul. 1999;6:695–702.
9. Homma H, Kuroyagi T, lzumi K, Mirley CL, Ronzello J, Boggs SA. Diffusion of low molecular weight siloxane from bulk to surface. IEEE Trans Dielectr Electr Insul. 1999;6:370–5.
10. Kim JK, Kim IH. Characteristics of surface wettability and hydrophobicity and recovery ability of EPDM rubber and silicone rubber for polymer insulators. J Appl Poly Sci. 2001;79:2251–7.
11. Zhu Y. Influence of corona discharge on hydrophobicity of silicone rubber used for outdoor insulation. Polymer Testing. 2019;74:14–20.
12. Wan Z, Azam MS, Wyatt S, Ramsay K, Korner J, Elvira KS, et al. Algae adhesion onto silicone is sensitive to environment-induced surface restructuring. Langmuir. 2021;37:9597–604.
13. Ning K, Lu J, Jiang Z, Xie P, Feng T, Hu J, et al. Aging characteristics and lifespan prediction for composite insulator silicone rubber in a mountainous region environment. Polymer Testing. 2023;122:108023.
14. Akbar M, Ullah R, Alam S. Aging of silicone rubber composite insulators under multi-stressed condtions: A review. Mater Res Exp. 2019;6:102003.
15. Gustavsson TG, Gubanski SM, Hillborg H, Karlsson S, Gedde UW. Aging of silicone rubber under AC or DC voltages in a coastal environment. IEEE Trans Dielectr Electr Insul. 2001;8:1029–39.
16. Verma AR, Reddy BS. Accelerated aging studies of silicon-rubber based polymeric insulators used for HV transmission lines. Polymer Testing. 2017;62:124–31.
17. Schumann S, Döring M, Lehretz F, Görlich J. Thermal behavior and resistance against electrical discharges of modified silicones for outdoor applications. IEEE Trans Diel Elect Insul. 2018;25:464–75.
18. Zhu Y, Haji K, Otsubo M. Surface degradation of silicone rubber exposed to corona discharge. IEEE Trans Plasma Sci. 2006;34:1094–8.
19. Farhadinejad Z, Ehsani M, Ahmadi-Joneidi I, Shayegani AA, Mohseni H. Effects of UV_”C” radiation on thermal, electrical and morphological behavior of silicone rubber insulators. IEEE Trans Dielectr Electr Insul. 2012;19:1740–9.
20. Rowland SM, Robertson J, Xiong Y, Day RJ. Electrical and material characterization of field-aged 400 kV silicone rubber composite insulators. IEEE Trans Dielectrics Electr Insulation. 2010;17:375–83.
21. Tudose IV, Suchea M, Siderakis K, Thalassinakis E, Koudoumas E. Comparative study on field collected samples of aged silicone rubber composite coatings for high voltage insulators. Acta Chemica Iasi. 2013;21:93–106.
22. Wu T, Huang M, Liu X, Feng H, Shao M, Cai H. Characterization method for the swelling effect of an insulating washing agent on silicone rubber in power systems. ACS Omega. 2022;7:42331–8.
23. Kołodziej A, Wesełucha-Birczyńska A, Świȩtek M, Horák D, Młaz̀ewicz M. A 2D-Raman correlation spectroscopy analysis of the polymeric nanocomposites with magnetic nanoparticles. J Mol Struct. 2020;1215:128294.
24. Liu C, Zhang X, Liu J, Li Z, Zhang Z, Gong Y, et al. Ageing characteristics and microplastic release behavior from rainwater facilities under ROS oxidation. Sci Total Environ. 2023;866:161397.
25. Azam MS, Cai C, Hore DK. Selective probing of thin-film interfaces using internal reflection sum-frequency spectroscopy. J Phys Chem C. 2019;123:23535–44.
26. Wan Z, MacVicar BT, Wyatt S, Varela DE, Padmawar R, Hore DK. An automated image analysis platform for the study of weakly-adhered cells. Biofouling. 2021;37:387–96.
27. Cai C, Azam MdS, Hore DK. Probing either side of thin films using vibrational sum frequency spectroscopy in multiple beam polarizations. J Phys Chem C. 2021;125:12382–9.
28. Azam MS, Ranson MD, Hore DK. Temperature-dependent infrared refractive index of polymers from a calibrated attenuated total reflection infrared measurement. Appl Spectrosc. 2022;76:1254–62.
29. Fletcher HP, Macdonald A, Secord C, Lenckowski M, Padmawar R, Hore DK. Design and construction of an advanced tracking wheel for insulator materials testing. Can J Electr Comp Eng. 2020;43:342–9.
30. Novaković TB, Pavlović SM, Pagnacco MC, Banković PT, Mojović ZD. The application of alumina for electroanalytical determination of gallic acid. Electrocatalysis. 2023;14:18–28.
31. Loganathan N, Chandrasekar S. Analysis of surface tracking of micro and nano size alumina filled silicone rubber for high voltage AC transmission. J Electr Eng Technol. 2013;8:345–53.
32. Zhang Z, Zhang Z, Yue S, Jiang X, Hu J. Performance characteristics of silicone rubber for use in acidic environments. Polymers. 2023;15:3598.
33. Wen X, Yuan X, Lan L, Hao L, Wang Y, Li S, et al. RTV silicone rubber degradation induced by temperature cycling. Energies. 2017;10:1054.
34. Lin Y, Yin F, Liu Y, Wang L, Zhao Y, Farzaneh M. Effect of ultraviolet-A radiation on surface structure, thermal, and mechanical and electrical properties of liquid silicone rubber. J Appl Polym Sci. 2019;136:47652.
35. Kaaiye SF, Nyamupangedengu C. Comparative study of AC and DC inclined plane tests on silicone rubber (SiR) insulation. High Volt. 2017;2:119–28.
36. Akbari M, Shayegani-Akmal AA. Experimental investigation on the accelerated aging of silicone rubber insulators based on thermal stress. Int J Electr Power Ene Sys. 2023;149:109049.
37. Noda I. Generalized two-dimensional correlation method applicable to infrared, Raman, and other types of spectroscopy. Appl Spectrosc. 1993;47:1329–36.
38. Noda I, Dowrey AE, Marcott C, Story GM, Ozaki Y. Generalized two-dimensional correlation spectroscopy. Appl Spectrosc. 2000;54:236A–248A.
39. Noda I, Ozaki Y. Two-dimensional correlation spectroscopy: Applications in vibrational and optical spectroscopy. San Francisco: John Wiley & Sons, Ltd; 2004.