IEC guidelines for insulator selection offer sufficient information for preliminary design when pollution is not the main factor. An example would be selecting insulators for AC systems in areas with moderate pollution and where design and arcing distance is dominated by performance under switching overvoltage. Pollution performance requirements are then met by selecting insulators with a suitable creepage factor. The situation becomes much different, however, whenever pollution dominates design for AC, such as in desert or coastal service areas and this becomes even more critical under DC. Overdesign in DC could result in unacceptably high investment costs while under-design could lead to frequent and costly remedial maintenance.
This edited contribution to INMR by Alberto Pigini explained how selection of the proper insulators is accomplished in cases where pollution is the dominant concern. The approach recommended is based on assessing site pollution severity as well as insulator strength characteristics. These are then combined to yield a statistical estimation of expected insulator performance.
This process is especially important when it comes to application of composite insulators. While less than optimal design could lead to flashover for ceramic insulators, it could result in irreversible damage and failure of composite insulators. Composite insulators offer the promise of superior pollution performance but only if correctly specified for their intended service environment.

Field Experience
Pollution design of insulation applied in desert environments has traditionally been based largely on IEC guidelines that, for example, recommended a USCD of 53.7 mm/kV for AC systems in heavily contaminated areas. Still, it became increasingly evident over the years that these guidelines were not always suitable for extreme desert environments.
Harsh conditions can also occur near a seacoast, even where there is no desert nearby. For example, it has been estimated that some 40 per cent of the power infrastructure in Mexico is located in polluted areas. The most common situation is salt fog that affects substations and lines located along the coast of the Gulf of Mexico. The critical season is from November to March during which there could be as many as 60 storms, with resulting salt and sand accumulation on insulators of up to 2 mg/cm2 after each event. Depending on whether or not there was rain during the storm, live-line washing has typically had to be performed after every 3 storms (i.e. up to 20 times over only 5 months) to prevent onset of flashovers.
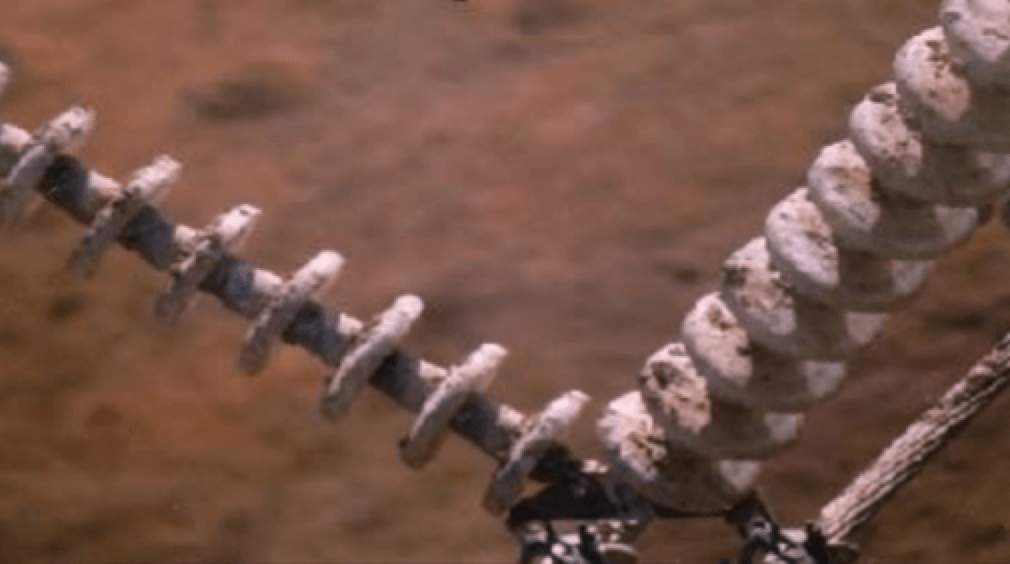
Overall, reported experience following application of composite insulators in these types of situations has proven mostly positive. By contrast, experience with composite insulators in Peru has not been good with reports of many failures after only a few years of service close to the coast where ESDD is 1.05 mg/cm2 and NSDD is 4.1 mg/cm2 measured on a tower 3 km from the sea. One possible reason could have been that the 60 mm/kV USCD typically selected, even if sufficient to prevent flashovers, was not enough to avoid premature ageing. This confirms that when it comes to composite insulators USCD must always be chosen with a view to both short-term and long-term performance.

Problems have also been reported in places such as Israel and China, where flashovers have occurred at substations, possibly due to under-dimensioning of the composite insulators employed. In the former case, the unconventional practice of coating GIS silicone-housed bushings with RTV material was conducted as an added precaution.
It is interesting to note that, from a total life cycle cost perspective, a composite solution could prove advantageous in harsh environments even if their service life proves much shorter than for ceramic insulators – assuming they eliminate the need for costly maintenance. Past calculations from Saudi Arabia, for example, indicated that the life cycle cost of standard fog type insulators, which require washing every two months, was about 9 times that of silicone rubber equivalents. Conversely, for the same life cycle cost as standard fog type insulators, silicone rubber insulators could economically be replaced with new ones every 2.8 years. Similar results have been reported in Egypt.
Seen from another perspective, the minimum service life required of a 220 kV composite insulator string is 75%, 50% or 37.5% that of a ceramic insulator string under medium pollution (i.e. requiring 3-4 washes per year), heavy pollution (i.e. 5-6 washes/year) and extremely heavy pollution (i.e. more than 6 washes/year) respectively. All this experience underlines the importance of correct insulation design in desert and other harsh environments, based on:
• assessing site severity conditions;
• assessing insulator performance characteristics;
• application of a statistical approach
Assessing Pollution Severity
Degree of Contamination
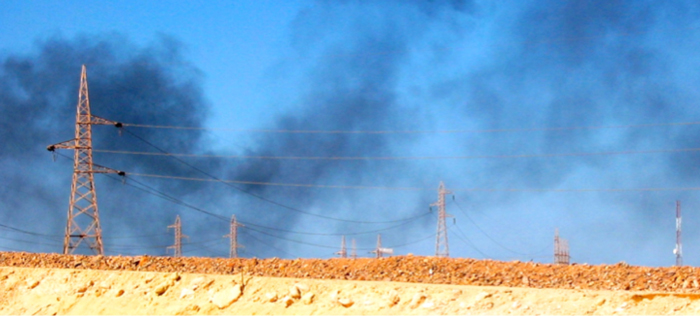
Although the general characteristics of all desert environments may seem similar (i.e. continuous pollution accumulation enhanced by periodic sand storms), actual contamination conditions can prove much different from one site to another. This is because the main effect of sand on an insulator depends on its chemical characteristics, especially its content of soluble salts. Moreover, where desert and marine environments meet, research has demonstrated that marine pollution could extend inland by as much as 100 km in the case of high winds from the sea. Moreover, a marine environment can lead to harsh conditions, with contamination levels far higher than 1 mg/cm2. In the case of storms, pollution accumulation can be so rapid that flashovers occur in just minutes. By contrast, deposition of contaminants under normal maritime conditions usually results in gradual accumulation of pollution that combines synergistically with contamination from desert dust.
It should also be noted that normal desert environments in many countries have been undergoing continuous change due to industrialization and resource development. This only makes the problem of assessing insulator contamination even more complex.
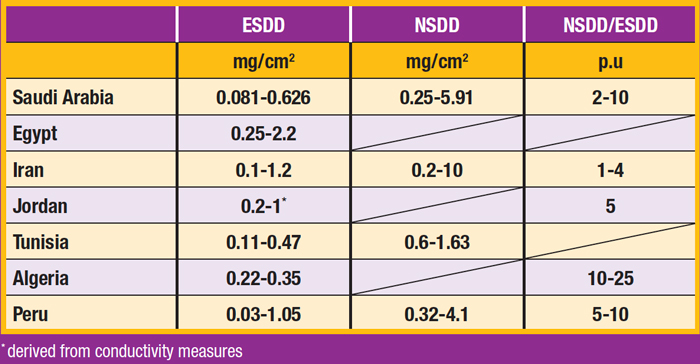
A general indication of the levels of contamination in desert environments is shown in Table 1 that summarizes data derived from the literature and related to countries where deserts make up a large proportion of the land mass. The data provided is not comparable since it was obtained using different reference insulators and measuring periods. However, it still serves to illustrate that, even in the same country, contamination levels can vary significantly and reach localized levels with ESDD of 2 mg/cm2 and NSDD up to 10 mg/cm2 (with the ratio of NSDD to ESDD sometimes being more than 10).
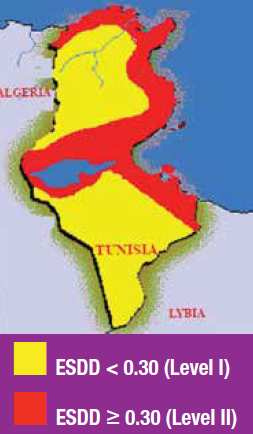
Based on these types of measurements, pollution maps can be developed that divide a country into different pollution zones, as in Fig. 1. Most such maps still consider only ESDD levels due to limited data available for NSDD.
In order to move toward optimized insulation design for pollution, the following points should be considered when developing new or refining existing pollution maps:
• Consider not only ESDD but also NSDD values since this parameter plays an important role in defining actual pollution severity;
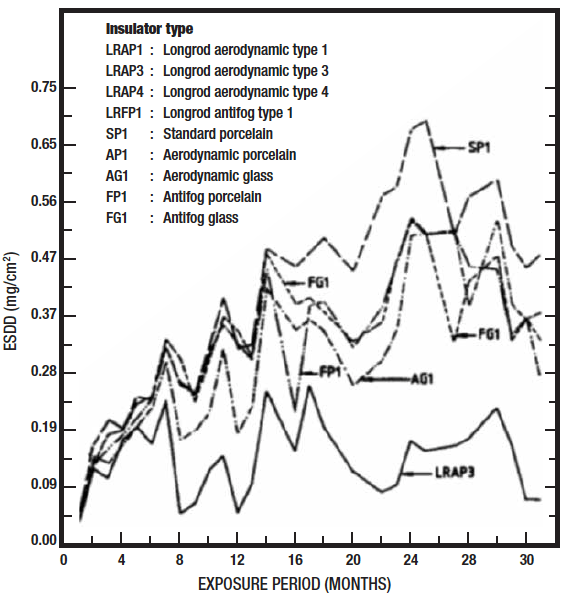
• Implement mapping relying on a number of pollution measurement campaigns of sufficient duration and in representative locations so as to account for the random character of pollution phenomena. Data from certain countries suggest that recording periods of at least two years are needed to obtain sufficiently accurate indications of maximum pollution severity (see Fig. 2);
• Perform targeted measurements in areas of specific interest (e.g. where new lines or substations are to be built) or where complex interactions are expected due to mixtures of desert and industrial type contaminants;
• Finally, conduct measurements at experimental stations with insulators energized under DC voltages to obtain data that allow extrapolation of pollution mapping from AC to DC applications.
Assessing Pollution Events
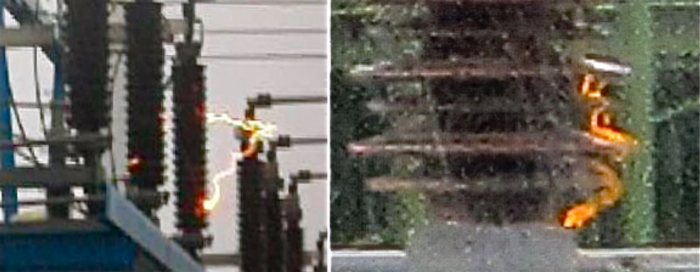
Contamination on an insulator must be made ‘active’ by efficient humidification (e.g. fog, drizzle, rain or condensation) in order to lead to pollution flashover. Evaluating the pollution events that trigger flashover is therefore an essential part of the process of optimizing insulation design.
Although the climate in desert environments may seem similar, there could be great diversity in daily and seasonal weather patterns. During daytime, for example, it is typically hot and humid in coastal zones. By contrast, inland areas are hot, dusty and dry. At night the dew point is frequently reached and fog also occurs at certain times of year. Finally, rain after prolonged dry periods can lead to potentially widespread problems on lines and at substations.
Incidence of ‘pollution events’ can vary greatly, even within the same country. For example, number of days per year with heavy layer humidification at 10 different sites in Saudi Arabia was found to vary widely:
• Fog days: from 0 to 64
• Rainy days: from 5 to 31
• Days with high humidity: from 40 to 88
Number of such pollution events should be carefully evaluated for each service area where decisions on insulation design are to be made, adding together all days with fog, rain and high humidity. This is best done by analysing past meteorological data from the region.

Insulator Performance under Harsh Conditions
Selection from among the different insulator alternatives (e.g. aerodynamic discs, anti-fog discs, aerodynamic long rods, coated insulators, composite insulators, etc.) should always be made taking into account specific application conditions. Therefore, whenever possible, laboratory tests should be performed on the insulators selected for the application while simulating expected contamination conditions, including non-standard contamination. For preliminary design work, available laboratory experience can be referenced, taking into account the specificity of the desert service environment in each case. This is summarized below, making reference to the salt fog and solid layer test methodologies.
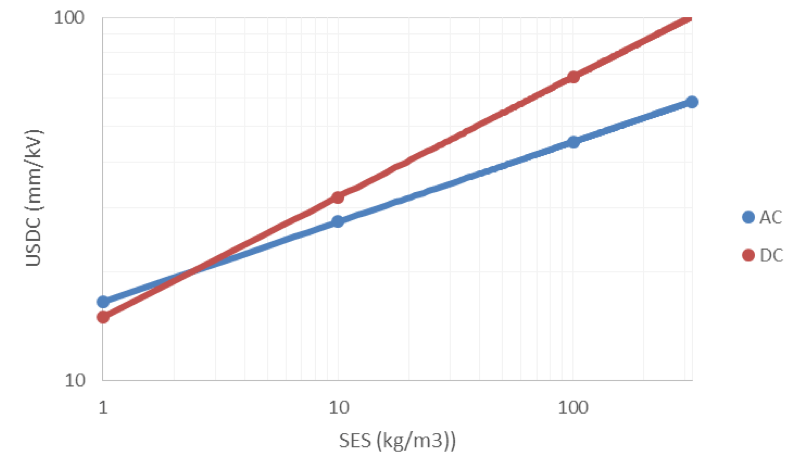
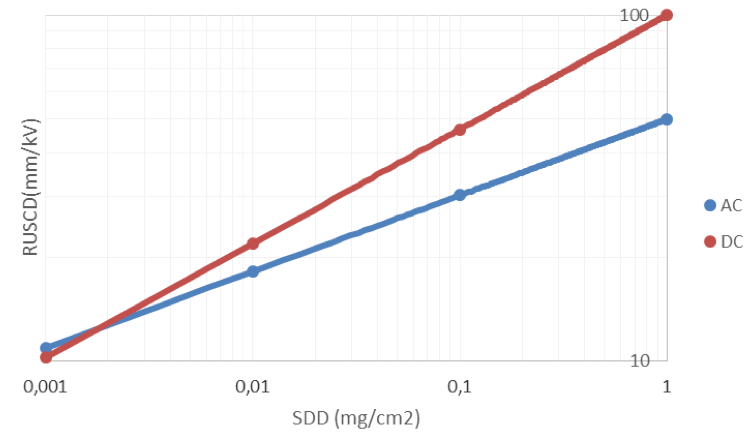
The following formulas are proposed to obtain the reference unified specific creepage distance RUSCD for cap & pin insulators of standard profile for AC and DC voltages (see Figs. 3 and 4):
For salt fog:
RUSCD = 16.5 *Sa0.22 (mm/kV, kg/m3) per AC
RUSCD = 15*Sa0.33 (mm/kV, kg/m3) for DC
with Sa being test fog salinity
For solid layer:
RUSCD = 50 *SDD0.22 (mm/kV, mg/cm2) per AC
RUSCD = 100*SDD0.33 (mm/kV, mg/cm2) for DC
with SDD being the standardized test pollution severity (obtained by contaminating the insulators with a slurry containing the necessary quantity of salt an d 40 g/liter of kaolin corresponding to NSDD of about 0.1 mg/cm2).
The USCD, unified specific creepage distance for other types of insulators may be obtained starting from the RUSCD applying the following coefficients:
For salt fog:
USCD = KCF*KD*KW1*16.5*SES0.22 *Kw2 (mm/kV, kg/m3) per AC
USCD = KCF*KD*KW1*15*SES0.33 *Kw2 (mm/kV, kg/m3) per DC
For solid layer:
USCD = KCF*KD*KW1*50*SDD0.22 *Kw2 (mm/kV, mg/cm2) per AC
USCD = KCF*KD*KW1*100 *SDD0.33 *Kw2 (mm/kV, mg/cm2) per DC
where
KW1 e Kw2= influence of the degree of hydrophobicity of the insulator (in terms of wettability levels varying from 1 to 7.
KCF= correction to take into account the ‘creepage factor’ (ratio between total creepage distance and arcing distance)
KD= diameter influence
Finally, being SDD the value to be applied in standard tests (corresponding to a non-soluble deposit density NSDD of 0.1 mg/cm2), ESDD-NSDD values estimated in the field are to be converted to SDD. All the above is included in specialized software developed for accurate design of insulators from a statistical point of view.

Design for Harsh Environments
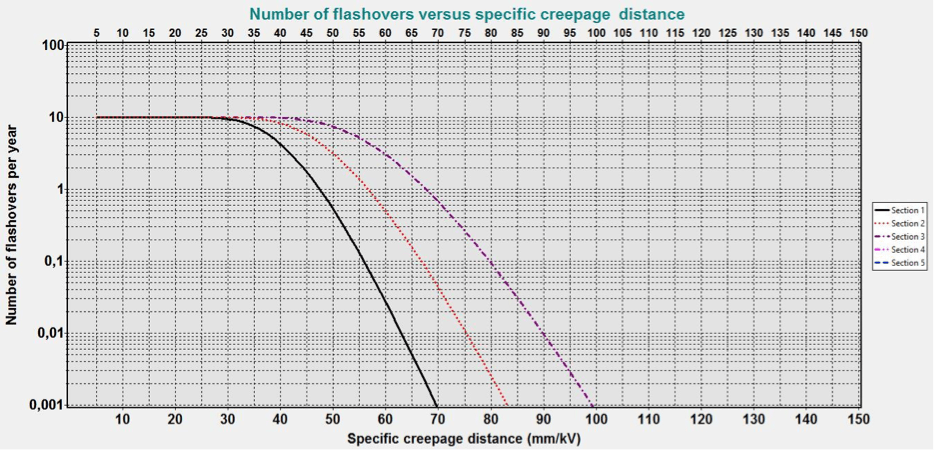
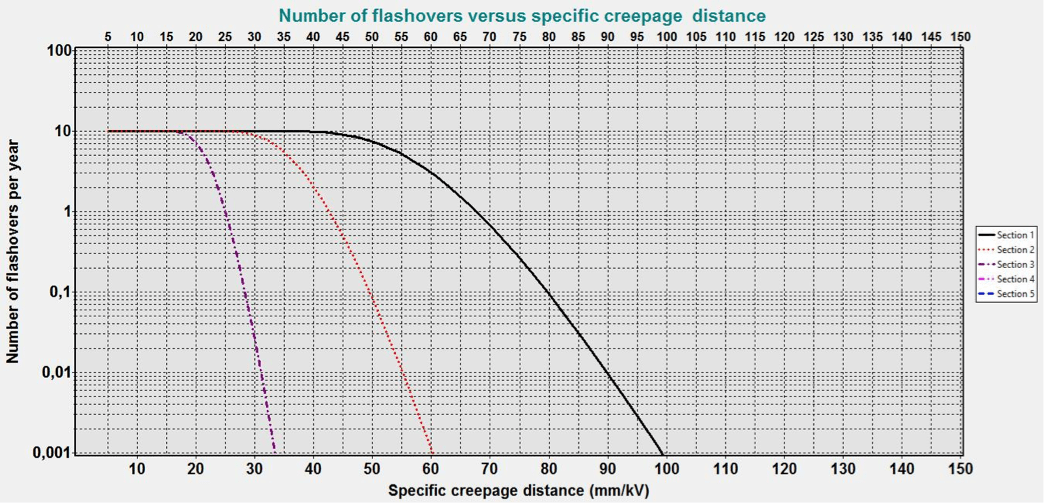
A general software program has been set up that can cover AC/DC ceramic and composite insulators with solid layer and salt fog type contamination. To illustrate the influence of different parameters, calculations are presented in the following example for anti-fog cap & pin insulators and composite insulators with a creepage distance to arcing distance ratio of 3.2 and with regard to AC application. Reference is made to solid layer and to the extreme case of ESDD=1 mg/cm2. The first case, which refers to a line equipped with ceramic cap & pin insulators with 10 pollution events/year and 100 contaminated insulators, shows the influence of NSDD. With reference to a target insulation performance of only one flashover every 10 years, the continuous line that corresponds to the laboratory condition (NSDD=0.1) indicates that a value of 53.7 mm/kV would be acceptable. But in the case of NSDD=1 (red curve), at least 67 mm/kV would be necessary. Where NSDD=10, 80 mm/kV would be necessary (violet curve).
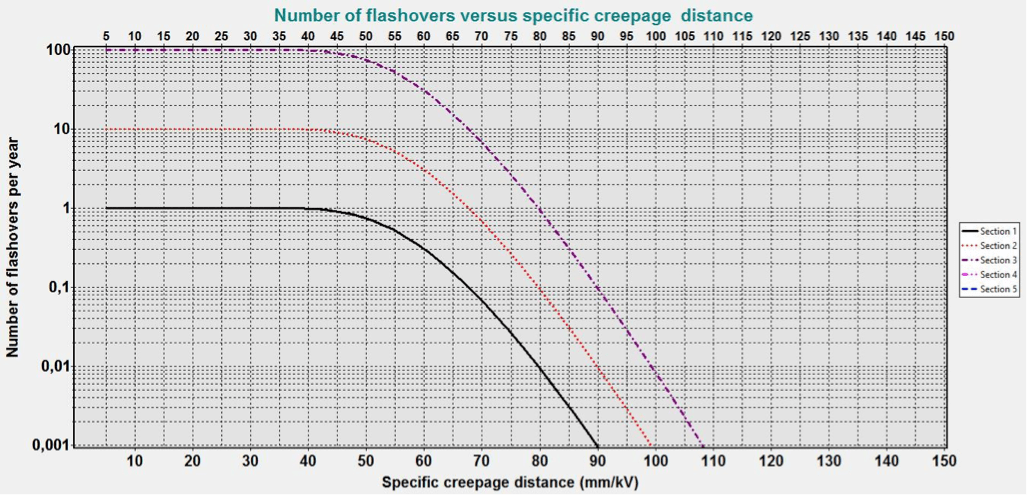
Obviously, a much higher USCD is necessary if a larger number of pollution events are expected, e.g. in some desert areas where ESDD=1 mg/cm2 and NSDD=10 mg/cm2 and the number of pollution events vary from 1 (black curve) to 10 (red curve) and 100 (violet curve). In the last case, to realize a target of only 0.1 flashovers/year (i.e. 1 flashover every 10 years), 90 mm/kV would be necessary (see Fig. 6).
Influence of hydrophobicity of insulators is shown in Fig. 7 that makes reference to insulators coated with RTV (10 pollution events, 100 insulators contaminated, ESDD=1 mg/cm2, NSDD=10 mg/cm2). Wettability of 7 (black curve), 6 (red curve) and 4 (violet curve) is assumed. It appears that, even if most of the initial hydrophobicity is lost, flashover performance of the marginally hydrophobic insulator is still much better than for the uncoated insulator.
However, it also has to be taken into account that polymeric materials are subject to premature ageing due to excessive leakage current and therefore actual ‘working USCD’ should be higher than found in the Figure. Similarly, the ‘working voltage’ should be sufficiently far from flashover voltage to assure low leakage current. This aspect can be dealt with in the program by requiring a much lower number of flashovers than for ceramic insulators. In the case examined here, for example, while 80 mm/kV would be necessary for W=7 (non-coated insulators) in order to assure a target of only one flashover every 10 years, a USCD of 60 can be selected for partially hydrophobic insulators (W=6), corresponding to very low probability of flashover (only one every 1000 years).
The software program can also be used to evaluate influence of many other parameters, such as creepage factor, number of contaminated insulators, diameter of insulators, etc. It should be pointed out that composite insulators would require even less creepage distance than shown in Fig. 7 due to their lower diameters (typical average diameter of 100 mm versus about 200 mm for cap & pin insulators).

Summary
1. Service experience has confirmed that IEC general indications are not always adequate for desert as well as desert-coastal environments.
2. Pollution severity can reach extreme values in these types of areas but can also vary greatly from site to site. Also, number of pollution events can be highly variable. Consequently, accurate pollution mapping is necessary to realize optimized design of insulation.
3. Insulator type should be specifically selected with consideration of the characteristics of the service environment and possibly tests should be carried out to assess performance of these insulators, simulating actual application conditions.
4. Preliminary design evaluation can be made by extrapolating available information on insulation performance.
5. To achieve final optimized design, a statistical approach must be used, as shown in the examples discussed.