CIGRE WG C4.303 Brochure 555, “Artificial pollution test for polymer insulators: results of a round robin test” reported on comparative pollution tests conducted at several different laboratories on two silicone line insulator samples. The same basic test procedure was utilized as for ceramic insulators with the main difference being that the surfaces of the polymeric insulators were first ‘pre-conditioned’ by dry kaolin before applying the standard slurry (i.e. water containing the required quantity of salt to reach a salt deposit density SDD of 0.3 mg/cm2 as well as 40 g/l of kaolin, leading to an NSDD value of 0.1 mg/cm2).
This edited past contribution to INMR by Alberto Pigini reviewed key lessons learned.
Past round robin pollution tests at different laboratories across the globe demonstrated good reproducibility and repeatability, especially when considering the spreads typically seen in such data. For example, flashover voltages varied from 126 kV to 142 kV in tests made just after contamination (with no recovery period) and from 125 kV to 155 kV (allowing 65 hours for recovery).

Due to pre-conditioning, surface hydrophobicity of these polymeric insulators was poor just after application of the slurry. Wettability class was about 7, which according to IEC 62073 is typical of ceramic insulators. By contrast, a WC of 1 is normal for most new, uncontaminated silicone-housed insulators. Moreover, WC barely changed even 65 hours after contamination, meaning negligible hydrophobicity recovery. Moreover, WC remained essentially the same both before and after the pollution tests, which saw wetting by fog and discharges along the insulators. There may have been limited recovery inside the pollution layer which, while not enough to influence outside WC, still resulted in slightly improved insulation strength after 65 hours (in this case, an average increase of 11%).
Similar tests have been conducted in China, however with a much higher quantity of inert materials in the slurry, leading to NSDD values some 5 to 10 times higher than for SDD. The resulting much denser slurry completely masks the insulator surface, thereby again resulting in a WC of close to 7. Hydrophobicity recovery in this case is even more difficult than in the testing scheme being proposed within CIGRE. Here is the problem:
The measured WC value of 7 from such testing is very different from what is typically found on polymeric insulators in service. For example, in a past report from ABB that assessed long-term service experience with dozens of hollow apparatus insulators made of silicone rubber, the WC measured after years of service at diverse contaminated sites across the globe varied from 1 to 3. Based on this, the representativeness of the proposed procedures would seem problematic and corresponding results would have to be considered as highly conservative. The test procedure completely masks the inherent hydrophobic characteristics of polymeric insulators and renders their performance close to that of ceramic insulators with the same geometry.

The main difference between such testing and real field experience lies in the fact that steady state contamination in service is reached only after a relatively long period. For example, tests made in the desert have indicated that about 3 years are needed for contamination to reach its steady state value. This gives the silicone material plenty of time to interact with the contamination layer, step-by-step, and this facilitates hydrophobicity recovery. By contrast, in these tests, the full so-called ‘steady state’ slurry was applied in a single discrete step.
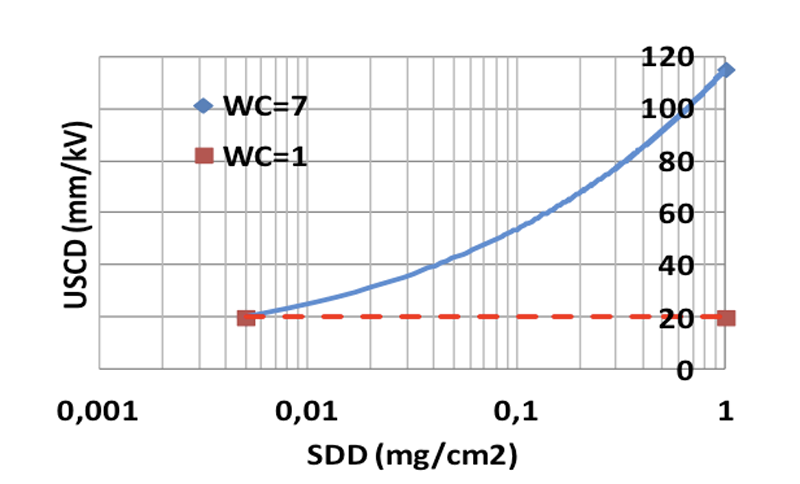
A simplified scheme to represent the expected performance of a polymeric insulator under pollution is reported in a chart that depicts expected unified specific creepage distance (USCD) as a function of SDD for both extreme WC conditions (1 and 7), also making reference to DC applications. For WC=1, the insulator surface is fully hydrophobic and a typical pollution flashover cannot occur. Rather, flashover occurs in air and is basically independent of pollution severity, being equal to or higher than the value that can be evaluated based on USCD, (i.e. the red line). In the case of WC=7, which is a performance close to that of ceramic insulators of the same geometry (given an average insulator diameter 250 mm), the blue line shows what can be expected.
Conclusions
• While from the pollution standpoint ceramic insulators are defined only by their geometry, performance of a polymeric insulator also depends on hydrophobicity and its capacity to recovery this property (to some extent expressed by instantaneous WC);
• Pollution performance of composite insulators can vary over a wide range depending on WC (as shown in the chart) especially at higher pollution severities.
• Pollution tests such as those proposed within CIGRE and which have the WC of test specimens close to 7, are excessively conservative and do not represent typical service conditions. While perhaps they can be useful for comparison purposes (e.g. to rank efficiencies of different profiles), they cannot directly be applied to design verifications. They nullify the basic advantage of polymeric insulators, taken as a design base – something that is essential for ongoing developments in HVDC and UHVDC.
To be truly representative, pollution tests should rather try to simulate typical WC values in service or at least to evaluate, by interpolation, expected performance under different WCs).