The German government has been pursuing the aim of increasing the share of gross electricity consumption supplied by renewable energy sources. By 2050, at least 80% of electricity is to come from renewable energies, such as solar and wind. This energy revolution will have a large impact on the future development of the high and extra high voltage power grids in Germany. While the proportion of renewable energies will increase over the years, nuclear power plants will be shut. Moreover, the major renewable energy sources with solar in the south of Germany and wind in the north are located in different geographical areas and are also far from load centers. This results in a need to transmit energy over long distances. At the same time, energy consumption in Germany will steadily increase. Due to above, expansion of the German power grid has been deemed necessary.
Despite the necessity, German Transmission System Operators (TSOs) presently face the challenge of a lack of public acceptance when it comes to building new lines. Additionally, permitting processes have become quite complex, so fulfilling the renewable energy mandates has become difficult. The use of HVDC links has been proposed by federal law as one measure to increase transmission capacity and to improve the dynamic performance of the transmission system. As a first step, existing overhead lines could be utilized where DC circuits and AC circuits would share the same towers; these are known as hybrid overhead lines. For such types of DC circuits, the TSO Amprion has undertaken efforts in gain knowledge about AC/DC hybrid lines and the proper design of the relevant components.
This edited 2022 contribution to INMR by Kübranur Varli, Stefan Steevens and Jeremy Unterfinger of Amprion explained that, after review, it became clear that insulators require careful scrutiny since they show significantly different behavior under DC stress than under AC stress.
While for AC insulators the main dimensioning parameter is typically the switching impulse in rainy conditions, for DC insulators it is the pollution severity of the ambient air which defines the required creepage distance and thus influences the required length of the insulator.
For the insulation coordination and the determination of the required minimum creepage distances, a combined approach of deterministic and statistical method was used. Data gained from field experiences and laboratory tests as well as artificial and on-site DC pollution measurements were used for the application of the statistical method using an adequate software (Insulation Selection Tool).
The following steps have been taken for the approach:
1. Determination of the type of insulator to be considered: Since DC insulators require much higher creepage distances than AC insulators, conventional porcelain insulators are not suitable, and thus the application of composite insulators was proposed. The main advantage of this type of insulators, which is attributable to its hydrophobic properties, is the pollution performance.
2. Determination of the required phase to ground and phase to phase clearances for different kinds of overvoltages in order to prevent flashovers.
3. Determination of the insulator requirements including the optimum housing profile, the insulator length, and the required unified specific creepage distance (USCD) depending on the on-site pollution severity: This was obtained from an assessment of existing DC insulators and on-site pollution measurements in order to gain the equivalent salt deposit density values (ESDD) and the non-soluble deposit density values (NSDD). Since AC and DC voltages will be found in the same corridor running in parallel and the line is to be switched between both, AC and DC, field experiences gained from AC and DC, were considered. The design criteria are based on “best practice” instead of “worst case”.
4. Creation of insulator drawings: Based on the steps above and simulations with grading rings, different insulator constructions were created and drawn.
5. Prototypes were produced according to the drawings.
6. Performance of verification tests: Type and design tests according to IEC 61109 were evaluated and performed for insulators for DC. A comparison of the accelerated ageing tests was done between AC and DC, and the results showed no reason to implement new test methods.

Differences of DC Compared to AC
Insulation Coordination – Overvoltages
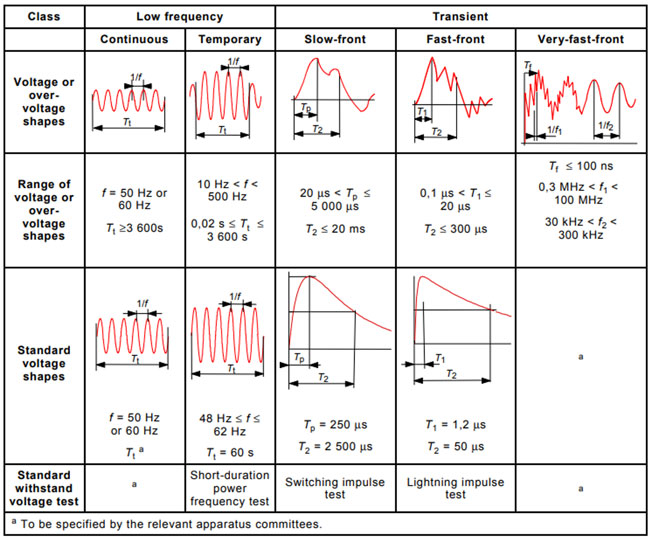
In order to determine the length of insulators based on the internal and external clearances of transmission lines, the insulation coordination is to be considered. Here, the examination of overvoltages which can appear in an overhead line is the first step. Overvoltages are divided into continuous voltages, temporary overvoltages, slow-front, fast-front and very-fast-front overvoltages (see Fig. 1).
Transmission lines are always dimensioned based on the maximum continuous operating voltages. For DC lines, the maximum continuous operating voltage equals the maximum DC voltage between conductor and ground. In hybrid lines, the maximum continuous operating voltage is the sum of the maximum DC voltage and the coupling of the AC component.
Temporary overvoltages in DC lines can appear under certain conditions such as errors in the converter control system. Usually, they are neglected while dimensioning transmission lines. Slow-front overvoltages on DC lines are mainly caused by ground faults. For DC lines, an overvoltage factor of 1.7 p.u. can be assumed. In hybrid lines, the use of an overvoltage factor of 2.0 p.u. is proposed. For AC lines, the overvoltage factor is 2.4 p.u.
Fast-front overvoltages are usually the result of direct lightning strikes onto the conductor or back flashovers. For hybrid lines, the insulation between both conductors will be a superposition of the fast-front overvoltage and the operating voltage. Very-fast-front overvoltages may appear at converters; however, they can be neglected while dimensioning transmission lines.
Pollution Performance
An important difference between AC and DC is pollution performance. In general, the flashover voltage and with this the insulation performance of an insulator decreases with increasing amounts of pollution on the insulator surface. The pollution performance differs significantly under AC and DC stresses and influences the design of insulators. First of all, pollution severity is much higher on DC stressed insulators than on AC stressed insulators in the same environment. Secondly, the non-uniformity of pollution is considerably higher on DC stressed insulators. Under AC, the pollution accumulation is primarily driven by aerodynamic processes. Dirt particles are carried to the insulator by wind and adhere to the insulator surface depending on the air circulation in the vicinity of the insulator. In regions without wind, the accumulation is primarily driven by the gravitation. In most of the cases it makes no difference if the insulator is energized or not.
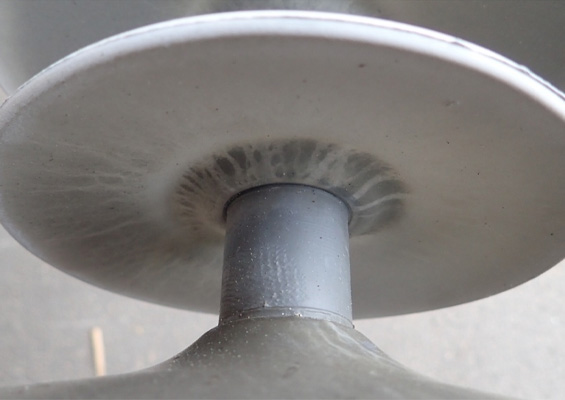
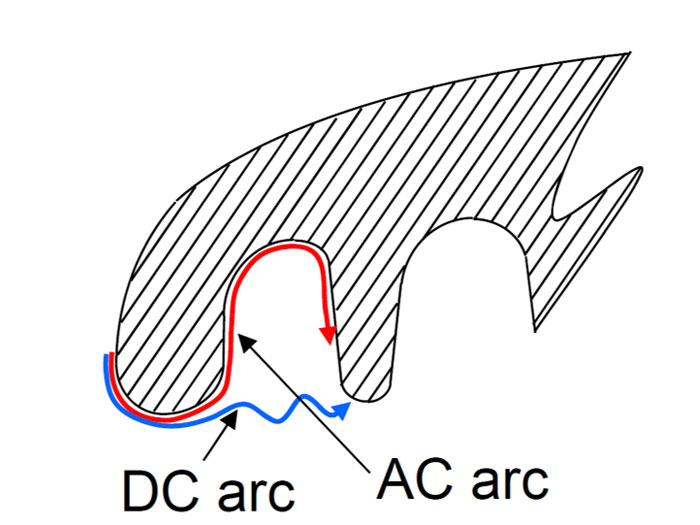
For insulators under DC, the effect of the homogeneous electric field has a major impact. Particularly in regions without wind, this effect is dominating. The dirt particles are attracted by the DC voltage. This leads to a higher pollution accumulation for DC in the same environment. The pollution layer on an insulator combined with moisture, for example, through rain, dew, or fog, can lead to a conductive layer on the insulator surface. This conductive layer can lead to a pollution flashover which in turn can lead to a failure of the insulator. This illustrates and is the reason behind why pollution performance is an important criterion for the dimensioning of outdoor composite insulators. Furthermore, even with the same amount of pollution, the insulation performance of DC stressed insulators is lower than the insulation performance of AC stressed insulators. The ratio of DCpeak to ACrms depends on several factors but varies usually in the range between 60% to 100%. Investigations have shown that the DC arc spreads differently along the insulator surface than the AC arc does. As can be seen in Fig. 2, the AC arc goes along the insulator surface while the DC arc bridges the air gaps.
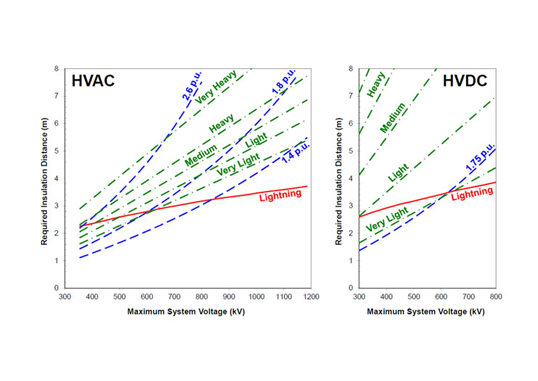
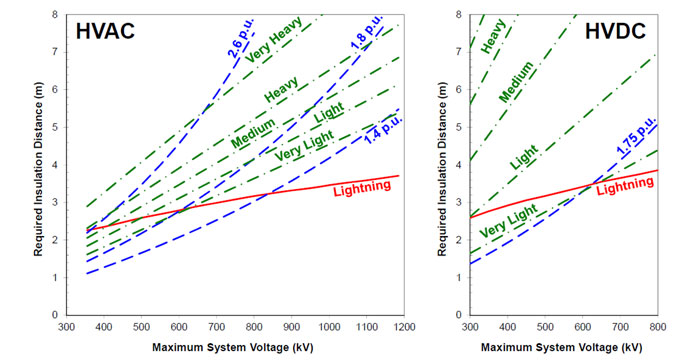
The difference is even better illustrated in Fig. 3. The required minimum insulation distances of AC and DC stressed insulators are shown in relation to the maximum system voltage with a pollution range from very light to heavy and lightning and varying switching impulse voltages, which represent the fast-front and slow-front overvoltages respectively. For AC, it is obvious that the required minimum insulation distances depend on the lightning impulse or switching impulse voltages in most cases. For DC, it can be seen that the initial required minimum insulation distance is generally high. Moreover, amplitude of the switching impulse voltages is less for AC than the amplitude for DC.
Material Ageing
The stability of composite insulators over long periods of time is dependent upon the ageing of the polymeric material, and this ageing can primarily be caused by hydrophobicity loss. The hydrophobicity of the polymeric material can be lost temporarily and partially through external influences such as partial discharges caused by pollution or by continuous corona enhanced by water droplets on the insulator surface. Continuous corona discharges can, for instance, appear due to improperly designed grading/corona protection devices in AC applications. When the hydrophobicity is lost, moisture on the insulator surface together with pollution can build conductive water layers instead of initially nonconductive water droplets. This will lead to high leakage currents and a lower flashover voltage while in operation. Without hydrophobicity, the probability of a flashover is much higher. Corona discharges can also lead to an erosion of the material, and again, this harms the material and leads to early ageing. In DC, the influence of partial pollution-driven dry-band discharges is much higher than in AC because the discharges are more stable as the voltage across the insulator never crosses zero.
Below, the topic of how insulators for DC lines were dimensioned and how the differences explained above were considered.
Procedures for Dimensioning DC Insulators
Overview
The dimensioning process was divided into four steps. In the first step, the required air clearances were determined for the slow-front and fast-front overvoltages using full scale field tests and calculations. Secondly, the insulator requirements were analyzed including the optimum housing profile, the insulator length, and the required USCD. The knowledge gained from the first two steps was used as input for the creation of insulator drawings and the production of prototypes. In the last step, various design verification tests were performed. Some tests have been ongoing.
![]()

Determination of Clearances
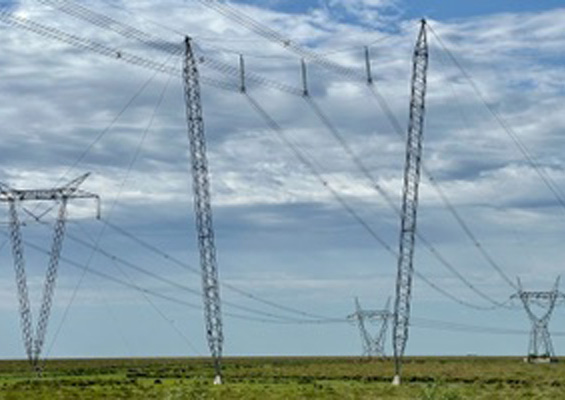
In order to increase the transmission capacity and to improve the dynamic performance of the system it was decided to upgrade existing overhead lines by converting one circuit from AC to DC operation, creating so called hybrid overhead lines. Ideas for standard Amprion tower types are illustrated in Fig. 4. The phase with positive polarity is in all constructions at the upper cross arm of the tower. Since radio interference and audible noise are mainly caused by positive polarity this should be at the most possible distance to any buildings.
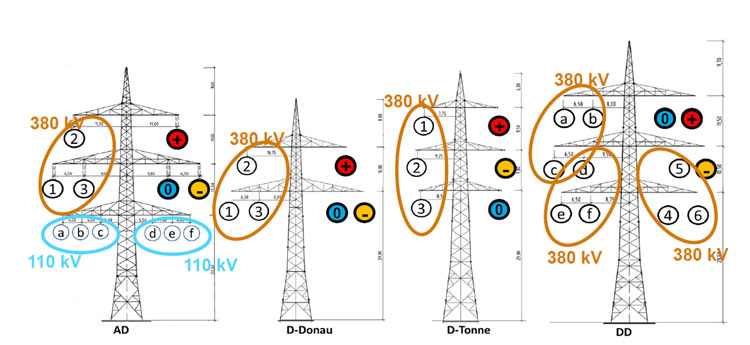
Taking a closer look at the right tower, for example, it can be seen that there are eight different clearances that need to be determined including phase to ground clearances and phase to phase clearances (see Fig. 5). As mentioned, the slow-front and fast-front overvoltages are of interest for DC lines. The determination of all eight clearances is described in the following sections for these two kinds of overvoltages.
Phase-to-Ground Clearances for Slow-Front Overvoltages (Del_sf)
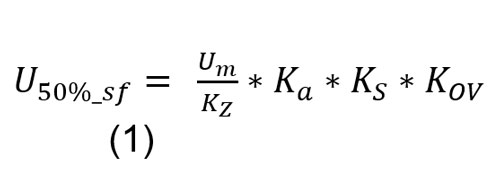
For all overvoltages, the determination of clearances is to be performed separately for phase to ground and phase to phase. For the slow-front overvoltages, the 50% flashover voltage needs to be determined first using equation 1. In this equation, U_m is the maximum operation voltage while the other parameters represent the different correction factors with:
Kz: standard deviation ((1-σ*z); zsf=0.06; zff=0.03)
Ka: atmospheric correction factor (approximately 13% at 1000 m)
KS: safety factor
KOV: overvoltage factor
K(g_sf): spark gap factor
In the next step the spark gap factor (Kg_sf) is needed in order to determine the clearances (D) using equation 2.
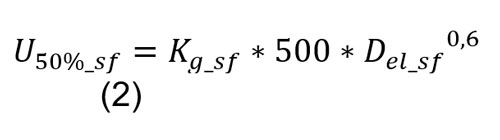
Since Kg_sf can be variable, full scale field tests were conducted by Amprion in order to determine reasonably accurate values (Fig. 6).
The tests resulted in the following values for Kg_sf:
The determination of the air clearances for phase to ground resulted in the following values:
Phase-to-Phase Clearances for Slow-Front Overvoltages (Dpp_sf)
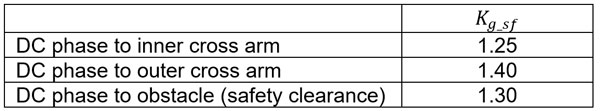
In this case the clearances between the two DC phases, between the DC phase and the AC phase and between the DC phase and the neutral phase need to be determined. For this, equation 2 can be used as well. However, here the voltage Um is to be determined according to equation 4. Only the voltage component for which the dielectric strength of air is lower needs to be multiplied with the overvoltage factor. In these cases, it is the positive voltage component. Besides, Kg_sf is dependent on a factor α (equation 3) which represents the ratio of the negative voltage component (U–) to the sum voltage (U+ + U–). For the determination of α, the voltage component with the lower dielectric strength needs to be multiplied with the overvoltage factor as well. The dependency of Kg_sf to the factor α is illustrated in Fig. 7, which has been verified during high voltage tests by Amprion.

The following values were gained for the phase-to-phase clearances for slow-front overvoltages:
Phase to Ground Clearances for Fast-Front Overvoltages (Del_ff)
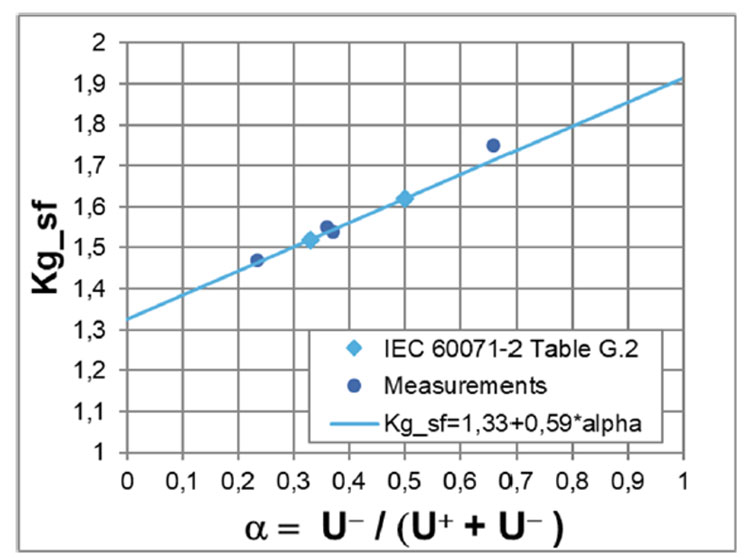
The fast-front overvoltages (lightning strikes) shall not lead to flashovers on grounded objects in the vicinity of the overhead lines or to the towers. Instead, the flashover shall appear on the insulator strings. So, the insulators have the task to limit the overvoltage. Due to the good dielectric behavior of composite insulators and optimized grading rings the U_(10%) -flashover voltage is, with 1720 kV for example, greater than the standardized insulation level of 1425 kV. This is why the clearances have to be determined in dependency on the flashover probability level of the insulator and not according to empirical methods.
For determination of the outer clearances to protect third parties, it is recommended to use the 1%-flashover probability. For the inner clearances, to avoid flashovers on the tower, the use of the 10%-flashover probability is proposed. An atmospheric correction is not necessary (Ka= 1) since both clearances have the same air ratios. Because an overvoltage with positive polarity will lead to a flashover faster than an overvoltage with negative polarity, usually only positive polarities are regarded for the determination of the clearances. However, since 90% of all faults are produced by negative lightning strikes, for DC it is recommended to test the insulation resistance for both polarities.
For this, the spark gap factor has to be determined separately for positive and negative polarities using equation 4 (representing 90% of lightning strikes) and equation 5, representing cases usually caused by back flashovers.
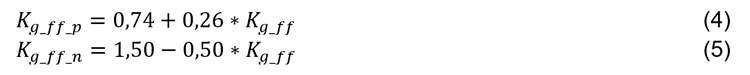
With Kg_ff_n and Kg_ff_p the clearances for the positive and negative polarities can be determined with equations 6 and 7.
The following values represent the phase to ground clearances for fast-front overvoltages:

Phase to Phase Clearances for Fast-Front Overvoltages (Dpp_ff)
For the phase-to-phase clearances for fast-front overvoltages, again, Kg_ff has to be determined in dependency on α, as described. In the next step, the spark gap factors for positive and negative polarity should be calculated using equations 4 and 5. Then the U50% voltage can be determined with equation 1. Here, Um is the sum voltage of the positive and negative component. The clearances can then be calculated according to equations 6 and 7.
Determination of Insulator Requirements
1. Design Review
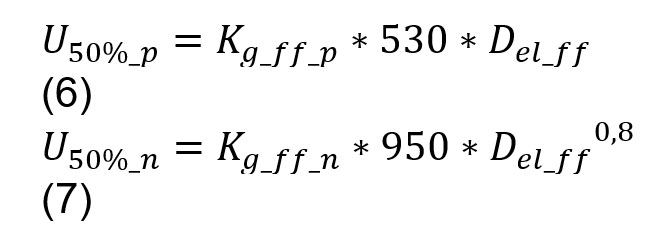
The determination of the insulator requirements for the future hybrid overhead line “Ultranet Osterath-Phillipsburg” was a joint project between Lapp Insulators, RWTH Aachen, and Amprion. Here, a literature study of different publications and standards concerning the topic of dimensioning transmission line insulators for DC and AC/DC was performed initially. The differing pollution behavior and dimensioning methods for DC lines were examined. Furthermore, experiences from two large projects from the insulator manufacturer Lapp were analyzed and used; the two large projects are the ±533 kV HVDC Apollo-Cahora-Bassa and the ±500 kV HVDC Pacific Intertie. Additional information from two projects in China, the Qinghai-Tibet ±400 kV HVDC and the Yongdeng-Baiyin 750 kV HVDC projects, were also used. With this information and the support of the specialized software “Insulator Selection Tool (IST)” [5], the criteria for the insulator dimensions were evaluated and applied to the design of the first DC insulators. A shot of the software dashboard with the utilized parameters is shown in Fig. 9.
It was initially decided to use composite insulators instead of porcelain due to their superior pollution performance and due to the need for higher creepage distances. The maximum operating voltage was set to 420 kV. The insulator length was, with 3.4 m, as long as insulators used for standard 420 kV AC lines. This was possible because the required clearances for the DC circuit can be met with an insulator length of 3.4 m. Artificial pollution tests with the intended insulator were used to estimate the required insulator length for a given pollution severity in terms of DC ESDD. The results indicated that the already selected insulator length of 3.4 m would be preliminarily appropriate for pollution levels in the range of 0.01-0.02 mg/cm2 for a DC voltage of maximum 420 kV. Thus, a maximum ESDD level of 0.02 mg/cm2 was used for the determination of the USCD. The mean time between pollution flashovers was set to at least 40 years. All these requirements were added to the insulator selection tool, and the required USCD was found to be 31.0 mm/kV.
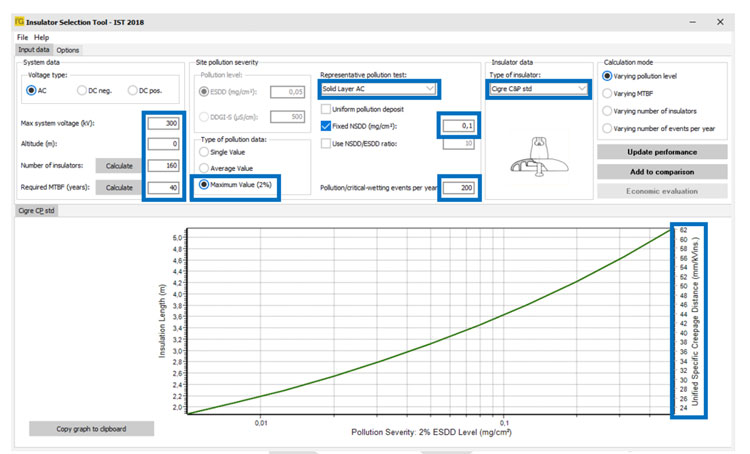

2. Insulator Drawings
Based on the results mentioned above, drawings of different designs including grading rings were created. In the next step, field simulations were done for each design with a typical Amprion tower construction with 420 kV DC voltage and both polarities (plus and minus). The influence of grading rings in different positions and the influence of the DC voltage on the lower cross arm energized with 110 kV AC voltage were examined (see Fig. 10). Here, standard requirements, i.e. average electric stress of 0.42 kV/mm along 10 mm of surface and 0.35 kV/mm for the triple point were applied. These values are going to be included in the Cigré TB, which is under development by the Cigré WG B2.57 and are also in progress to be included in the new version of IEC 61109. The values were also recently evaluated in a comprehensive study.
3. Production of Prototypes & Tests for Verification
In the next step, prototypes of one insulator design were produced in order to perform the electrical type and design tests according to IEC 61109 for verification. Since there will not be any mechanical differences of the insulator compared to insulators for AC, only electrical tests were performed.
For the type and design tests, existing service experiences of HVDC lines were used, especially experiences from China. Also, a comparison of the accelerated ageing tests between AC and DC was done including the tracking and erosion test and the evaluation of the hydrophobicity behavior. The comparison has shown that no new tests have to be developed for DC. In summary, all electrical type and design tests were performed according to the tests for AC insulators and were passed by the newly created DC insulators.
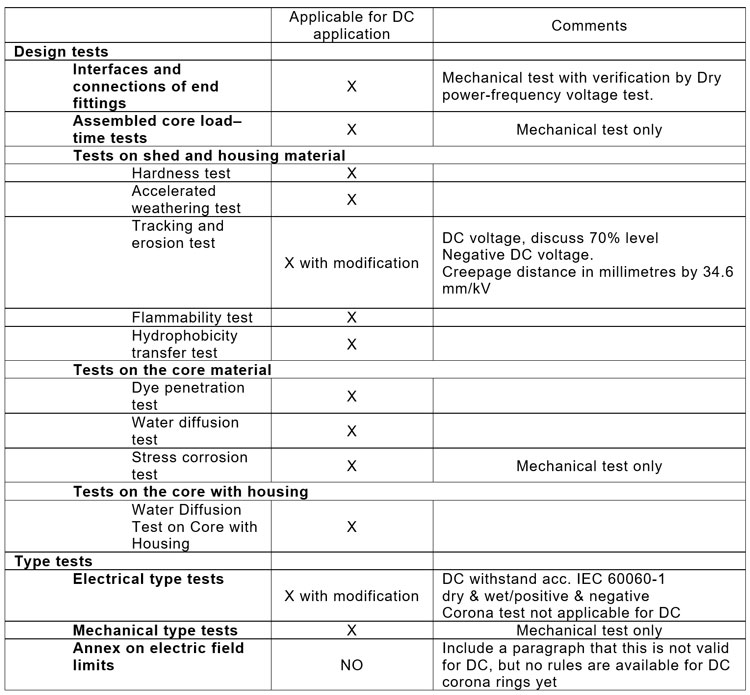
However, the considerations mentioned above were done in 2015. With the development of the state of technology and experiences gained, currently it is known that modified test methods are needed for some tests to qualify composite insulators for DC. In Table 6 the applicability of design- and type tests for DC applications is summarized. The table is adopted from the draft of the IEC 61109 which has been under revision.
4. Evaluating Pollution Performance
In order to verify the appropriate ESDD-Level of 0.01 mg/cm2 – 0.02 mg/cm2 for the dimensioned composite insulators with a length of 3.4 m for a DC voltage of 420 kV, pollution measurements were performed. For Amprion, the area along the right of way of the future hybrid overhead line “Ultranet” is of special importance, thus the air pollution in this area was examined. If the pollution stress along the right of way of Ultranet is higher than the estimated range, the mean time between pollution flashovers could be less than the required 40 years, which is assumed for the planning of the project. This has been verified by determining the DC ESDD from a 12-month measurement program using three different methods. This included pollution measurements using Direct Dust Deposit Gauges (DDDGs), measurements of ESDD-/NSDD – Levels on insulator samples, and leakage current measurements (see Fig. 11).
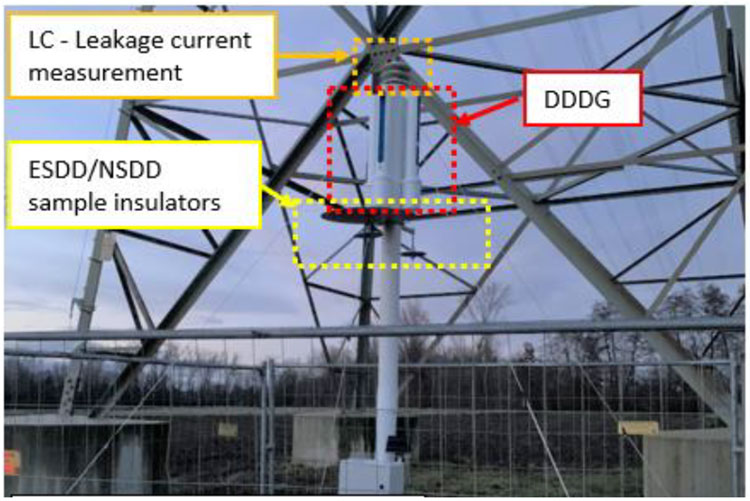
The pollution was measured at 5 geographically different sites along the right of way of Ultranet. All five sites were equipped with Directional Dust Deposit Gauges (DDDG) recommended by IEC 60815. At three of the sites, the DDDGs were additionally equipped with an IPMI leakage current monitor and composite insulator samples (insulator sheds) for direct measurement of ESDD and NSDD. Each of the measurement technique was used independently to determine the AC pollution level. Measurements were done monthly.
In the next step, the AC ESDD values have been converted into DC ESDD values. Procedures and formulas from the relevant standard IEC 60815-4 were followed for the conversion. The general procedure is as follows:
1. Correction (K_p) for pollution accumulation difference between AC and DC as recommended by the DC standard, clause 6.2.
2. Correction (K_d) on diameter considering the diameter of the insulator (combined effect of reduction of pollution flashover performance and reduction of natural pollutability for insulators with larger diameters), clause 6.6.
3. Correction (KNSDD) for NSDD to consider the influence of NSDD on the pollution flashover performance of insulators, clause 6.4.
4. The DC ESDD is finally defined by the following relation:
DC ESDD = Kp ∙ Kd ∙ KNSDD ∙ AC ESDD.
The absolute maximum DC ESDD obtained for a single site and measurement method was 0.021 mg/cm2. However, the average DC ESDD from all sites and methods is 0.01 mg/cm2 and is considered as more representative for the Ultranet right of way. This is on the lower boundary of the preliminary estimated range of 0.01 mg/cm2 – 0.02 mg/cm2 and should provide satisfactory performance of the OHL. All types of measurements performed during the one year at any of the measurement sites showed low levels of pollution. It should be stressed that continuous leakage current measurements did not reveal trends for pollution accumulation over time, only a balance between the pollution accumulation and natural washing. With this test, the preliminarily evaluated low level of pollution for Ultranet was confirmed.
New Test Methods
With the passing of time, some new root causes of failures of composite insulators have become known that could not be revealed by the current standardized type and design tests. As a result, some new test methods have been identified in order to ensure the quality of composite insulators including the newly designed composite DC insulators.
Evaluating Core-Housing Adhesion of Composite Insulators
Several failure investigations confirmed that the root cause of the failures in service was due to poor adhesion at the interface between the fiberglass core and the silicone rubber housing. This poor adhesion, however, was not revealed by the IEC steep-front tests intended to verify the integrity of interfaces of composite insulators. Following these revelations, a group of nine European power companies (both TSOs and DSOs) together with Independent Insulation Group, I2G (Sweden) started a collaborative research project intended to develop a robust and effective test for the evaluation of the level of adhesion at the core-housing interface.
The goal of the project was to develop practical test methods on how to identify the presence of low adhesion in composite insulators by sample testing insulator batches and for inclusion as a design and sample test in relevant IEC standards. The research project established practical guidelines on how to reveal low adhesion of composite insulators by sample testing of the batches before installation. It is currently accepted that the proposed test procedure (100 h of water diffusion followed by pull-off test) fulfills formal IEC requirements for any new test, as the tests covers representativity, repeatability, reproducibility, and cost-effectiveness. The new test method is already in the stage of being considered for implementation in relevant CIGRE TB and IEC standards.
Evaluating End Fitting & Sealing Quality of Composite Line Insulators
Another sensitive part of the insulator design is the so-called triple point (where air and housing meet the metal end fitting). The insulator part around the triple point has to be properly designed and manufactured since a poor-quality sealing may influence the long-term performance of composite insulators and can result in damage leading to failure of the insulator. At present, there is no reliable standard test to evaluate the quality of the different sealing methods. This issue became the driving force for a research project between Amprion and I2G intended to summarize up-to-date knowledge of the different fitting/sealing designs and to propose and verify innovative test methods to evaluate the integrity of the sealing. The test program consisted of seven sealing designs from six different manufacturers covering several different standard designs, meant to be representative of the existing sealing methods in the market. It was found that the complexity of the design of sealing does not necessarily improve the performance. Simpler designs also showed good results.
Finally, the corrosion and saltwater boiling test proposed in the project seems to be a promising test for a quick evaluation of the sealing. In the first part of this test, galvanic corrosion is intentionally initiated for pre-stressing. The end fitting is placed into a metallic container filled with 10 liters of salt water. The salt water is a mixture of tap water and NaCl, with a high salt concentration of 100 g/l. Galvanic corrosion is accomplished by applying a DC voltage of approximately 10 V between the metal end fitting (positive polarity) and the metallic container (negative polarity) for a time period of 2 h.
In order to concentrate the current in the area of interest, i.e. at the interface between the metal end fitting and sealing/housing, the main part of the end fitting surface is electrically insulated from the surrounding water using plastic foil and insulating tape (see Fig. 12). The area at the end of the end fitting exposed to salt water is in this way limited to 2,000 mm2. An additional electrode (negative polarity), in the form of a hose clamp, is also attached around the insulator 10 – 15 mm away from the end fitting. This arrangement resulted in a DC current of 10 – 15 A. The set-up is presented in Fig. 13. The exposed metal surface of the end fitting is wiped every 30 min in order to prevent a reduction of the current due to corrosion by-products covering the surface.
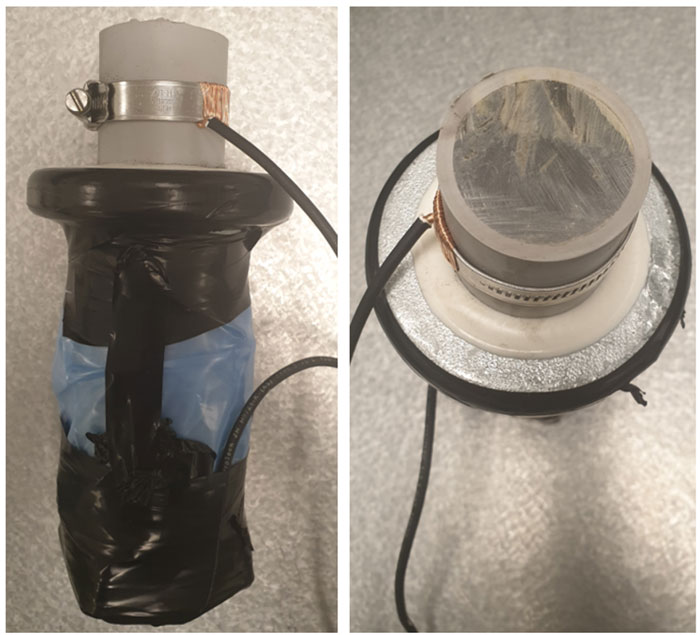
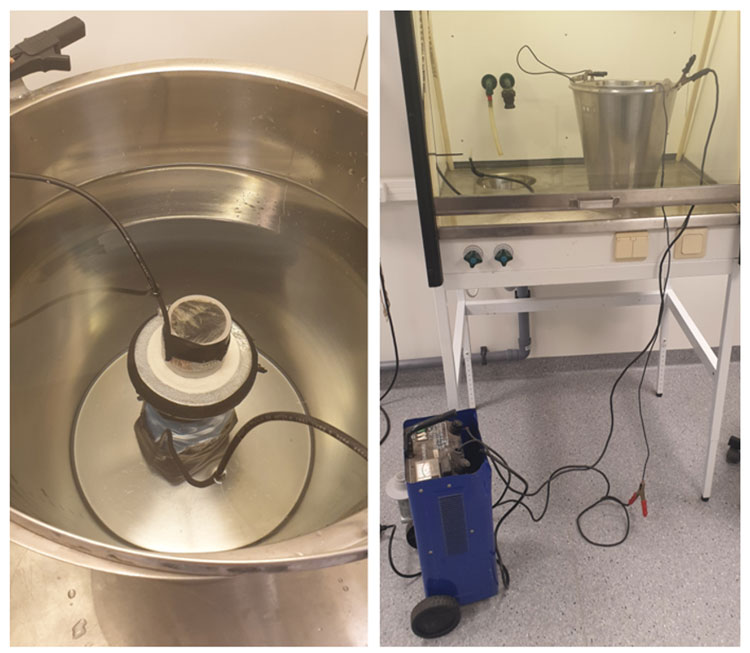
Container placed in fume hood and connected to power supply (right).
After the corrosion test, the end fitting is cleaned and placed in a new container of salt water and is boiled for 24 h in order to test the pre-stressed samples for potential water penetration. After the boiling is completed, the end fitting is allowed to cool down to room temperature (in water) before a close-up visual inspection for potential water penetration (signs of trapped water), corrosion, and any other kinds of deterioration is performed.
Summary
The following steps were taken to dimension composite insulators for DC lines. It was initially decided to use composite insulators instead of porcelain insulators due to their superior pollution performance and due to the need for higher creepage distances for DC lines. In the next step, the insulation coordination was done using full scale tests and calculation methods in order to determine the required phase to ground and phase to phase clearances for slow-front and fast-front overvoltages (relevant overvoltages for DC lines). The investigations resulted in the following required clearances.
Then the insulator requirements were determined. The maximum operating voltage was set to 420 kV. The insulator length was, on the basis of two reasons, determined to be 3.4 m. The first reason is that they should be as long as insulators used for standard 420 kV AC lines and, secondly, the required clearances for the DC circuit should be met. Artificial pollution tests with the intended insulator showed that the insulator with a length of 3.4 m would be preliminarily appropriate for pollution levels in the range of 0.01-0.02 mg/cm2 for a DC voltage of maximum 420 kV, and thus a maximum ESDD level of 0.02 mg/cm2 was used for the determination of the USCD. Another requirement was that the mean time between pollution flashovers be at least 40 years. Using these requirements, the insulator selection tool from STRI showed a required USCD of 31.0 mm/kV.
In the next step, insulator drawings and prototypes were created for use in type and design tests.
For the type and design tests, existing service experiences of HVDC lines were used, especially experience from China. Also, a comparison of the accelerated ageing tests between AC and DC was performed including the tracking and erosion test and the evaluation of the hydrophobicity behavior. The comparison showed that no new tests have to be developed for DC. All electrical type and design tests were performed according to the tests for AC insulators and were passed by the newly created DC insulators.
However, with development of the state of technology and experience gained, currently it is known that modified test methods are needed for some tests to qualify composite insulators for DC. These differences mainly include the tracking and erosion test and the electrical type tests, and they remain under discussion.
References
[1] German Renewable Energy Law, 2022
[2] Cigre D1_101_2014: “Behaviour of insulators under hybrid electrical AC/DC field stress“, 2014
[3] Cigré D1_112_2016: “ Performance of polymeric insulators in hybrid AC/DC overhead lines under polluted conditions“, 2016
[4] VDE V 0210-9 Freileitungen über 45 kV – Teil 9: Hybride AC/DC-Übertragung und DC-Übertragung
[5] I. Gutman, J. Lundquist: “Specialized Software for Electrical Design of Overhead Lines”, World Congress, Tucson, USA, 20-23 October 2019
[6] IEC 60071-1: “Insulation coordination – Part 1: Definitions, principles and rules”, 2019.
[7] TB 518 – Outdoor insulation in polluted conditionsGuidelines for selection and dimensioning
[8] Dr. C. Baer – Selected topics on the behaviour of composite insulators und AC and DC, component and material testing, Cigre WG D1.72, Paris, 30.08.2018
[9] Dr. K. Hindelang, Dr. J. Lambrecht – A Contribution on the Evaluation of the Erosion Resistance under DC Applying the Incline-Plane-Procedure, Cigre WG D1.72, Paris, 30.08.2018
[10] P. Sidenvall, I. Gutman, A. Deckwerth, L. Diaz, P. Meyer, J.F. Goffinet, K. Halsan, M. Leonhardsberger, M. Radosavljevic, P. Trenz, K. Varli, K. Välimaa: “Limits of electrical field for composite insulators: state-of-the art and recent investigations of insulators purchased by power utilities”, Cigré Science & Engineering, N. 24, February 2022, p.p. 1-14
[11] Draft of IEC 61109: “Insulators for overhead lines, composite suspension and tension insulators for electrical systems with a nominal voltage greater than 1000 V – definitions, test methods and acceptance criteria“.