Since inception, IEC standards 60815-1 to -3 have helped guide engineers charged with specifying insulation for overhead lines and substations operating in polluted service environments. Recently, efforts have been underway to revise this standard to make it easier to implement and a Working Group within CIGRE is being set up with this specific goal.
This second part of an edited contribution to INMR by Brazilian insulation expert and member of IEC36 MT 11, Darcy Ramalho de Mello, discusses problems that can arise during practical dimensioning of an insulator for pollution using the existing IEC 60815 standard. Case histories that illustrate these problems are also presented.


Standardized Methods to Obtain Site Pollution Severity Value
Approaches 2 and 3 within IEC 60815-1 indicate that measurement of SPS will guide selection of candidate insulators and also state the time scale recommended to obtain such information, i.e. “For measurement of site pollution severity, a period of two to three years is normally considered as sufficient for saturated pollution accumulation. This period may be longer or shorter according to the variations of weather conditions (rain, fog or dryness) and pollution events. At least one year pollution accumulation is the minimum period only allowed for some special cases.”
One problem in this regard, however, is convincing a utility about the relatively long time frame needed to collect these measurements. Moreover, even if this were possible, there is still the threat of theft or damage to equipment used to collect contaminants over this extended period. Sometimes such equipment is installed inside substations for security but then there is the risk that it may not be near enough to the route of the new overhead line to be representative of its pollution environment.
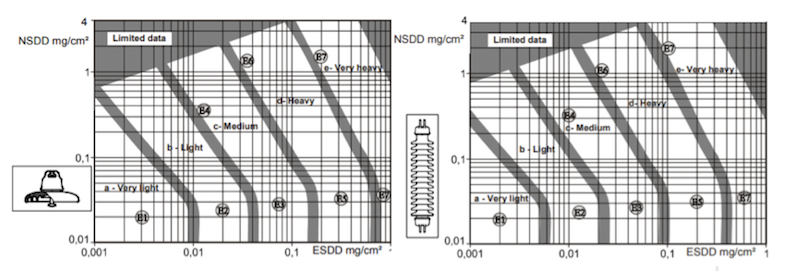
Measurement of equivalent salt deposit density (ESDD) and non-soluble deposit density (NSDD) is the most common procedure used to determine SPS value and to assess any possible increase in pollution over the service life of a transmission line or substation. IEC/TS 60815-1 suggests methods to calculate ESDD and NSDD for Type A pollution. For Type B pollution, IEC/TS 60815-1 explains how to measure site equivalent salinity (SES) and presents the relationship between SPS and SES. For locations with both types of pollution, IEC/TS 60815-1 recommends use of soluble (DDGIS) and non-soluble (DDGIN) dust deposit gauge collection indices.
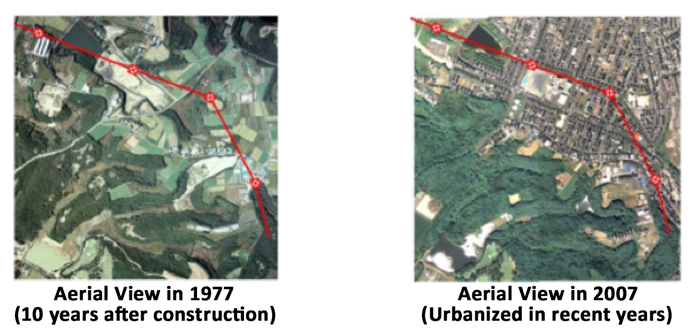
These concepts can be applied in any typical case scenario, such as when it is necessary to assess a possible increase in SPS due to expected growth of human activity near substations and transmission lines (see Fig. 13). As indicated in IEC/TS 60815-1, pollution is collected from the top and bottom surfaces of a cap & pin insulator and ESDD and NSDD values are calculated. But most guidance ends there. The only way to obtain the real SPS based on ESDD and NSDD is if the insulator used to collect the pollution is one of the reference insulators (as shown in Fig. 14). No correction factors are given should the insulator used for collecting pollution be different. While the literature does propose correction factors showing the ratio between pollution level on a reference insulator profile and that on other profiles in the case of vertically installed insulators, these are not considered in IEC/TS 60815-1.
Apart from this problem collecting pollution, should an AC line in operation require shutdown due to need for cleaning pollution, practical experience has shown that measurement of ESDD and NSDD levels is recommended at 3 points (levels) along the insulator and/or string, namely at the second shed from the top, in the middle and at the second shed from the bottom. Despite the fact that this practice is now common among many utilities, it is not clearly included in IEC/TS 60815-1.
Obtaining an SPS value using the recommendations in IEC/TS 60815-1 requires mounting a non-energized string with reference insulators (e.g. 9 cap & pin insulators or a single long rod insulator) or alternatively using a directional dust deposit gauge (DDDG). Yet a constant challenge is convincing new line designers of:
1. the necessity to mount such a pollution gathering structure for between 12 and 24 months along the future line route; or
2. that a similar structure needs to be mounted inside a substation to monitor evolution of pollution over time.
Table 1 outlines the advantages and disadvantages of both methods.
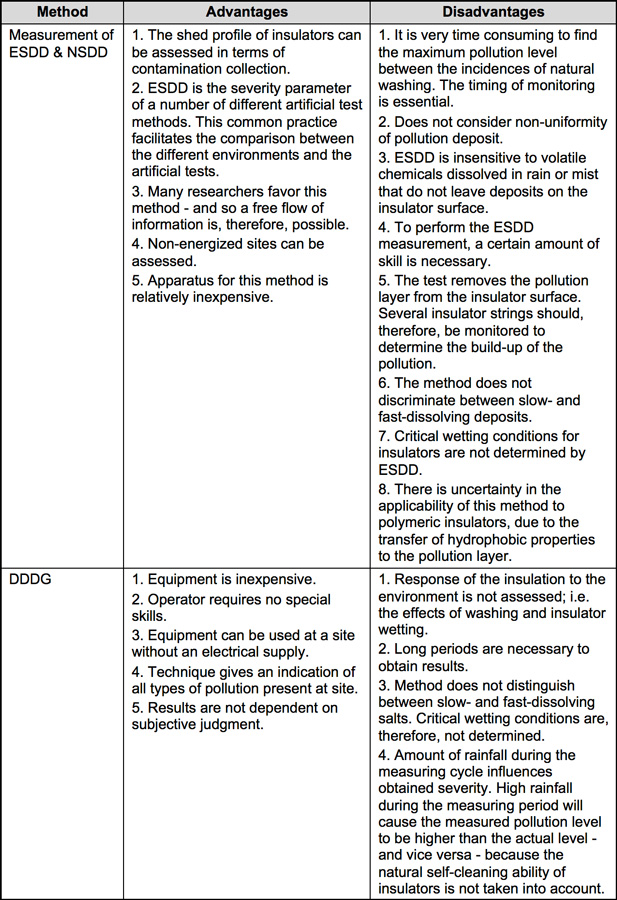
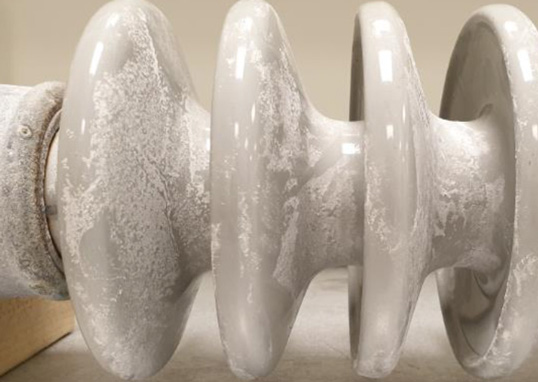
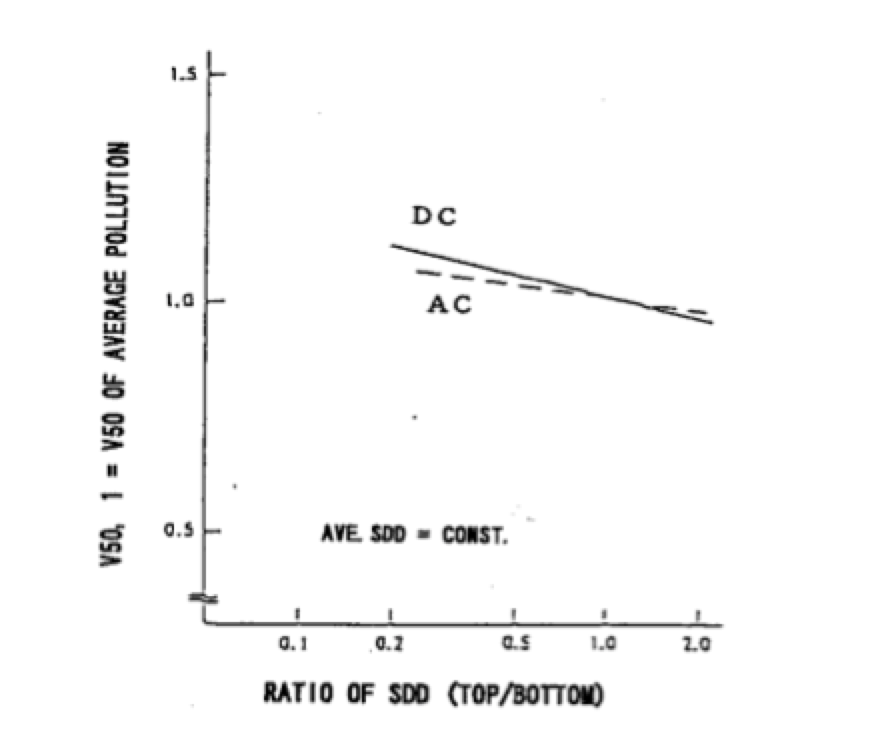
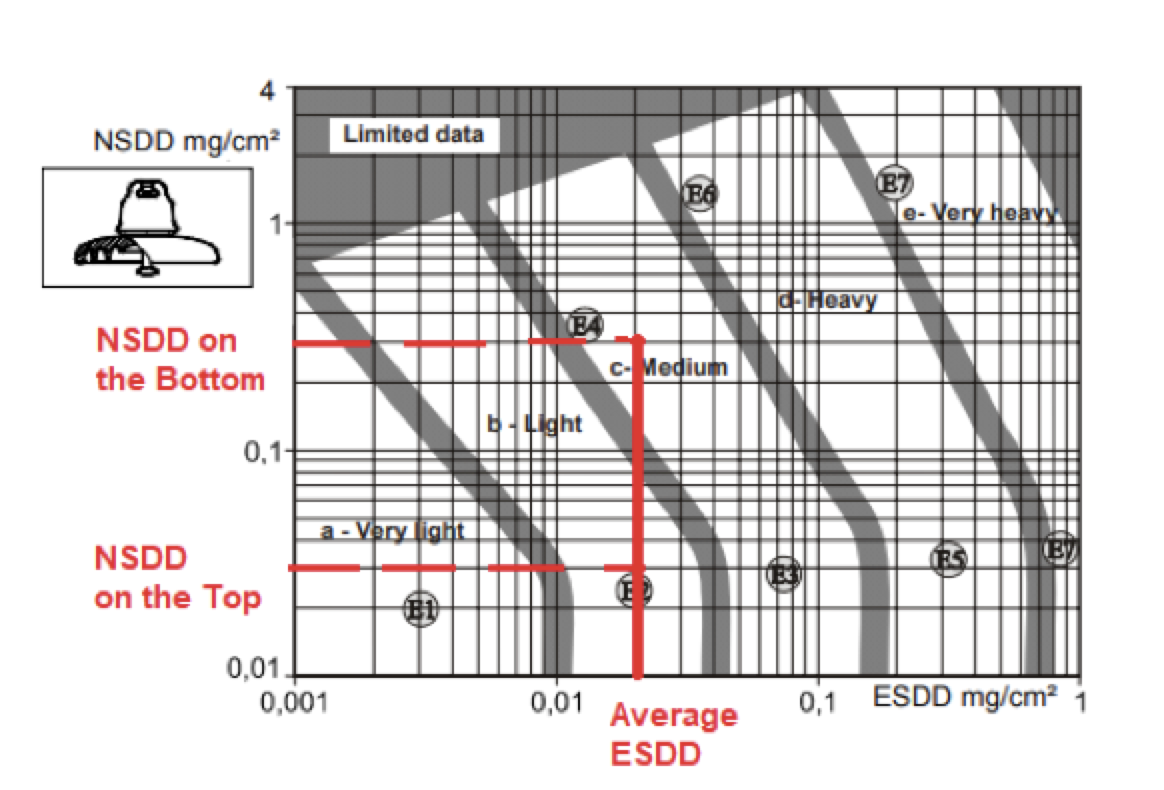
Probably the most significant of the disadvantages from Table 1 is the fact that the pollution layer on an insulator is non-uniform, meaning that ESDD measured on the top and bottom surfaces is usually not the same. Rather, pollution severity on the top surface is much lower due to the cleaning action of rain. For example, such non-uniform distribution of pollution affects cap & pin insulator flashover strength under both DC and AC energization, as shown in Fig. 15. While IEC/TS 60815-1 recommends considering average ESDD when top and bottom ESDD values are measured separately, nothing is stated about NSDD should top and bottom values also be measured separately. This can lead to confusion if a reference cap & pin insulator is used to obtain SPS value. The following scenario might appear when collecting pollution on top and bottom surfaces, i.e. an average ESDD, a top NSDD value and a bottom NSDD value. Depending on where the pollution was collected, it is even possible to end up with two different SPS values for the same region (see Fig. 16).
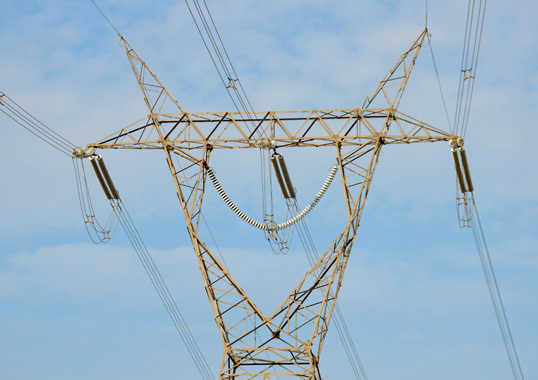
Moreover, for any type of configuration, different pollution deposit densities will be experienced on the cap & pin insulators making up the string. Under AC energization, for example, non-uniform distribution of contamination on insulator surfaces can have appreciable effects on flashover voltage of the string, as shown in Fig. 17 with different ratios of top-to-bottom (T/B) surface SDD. Similarly, under DC energization, insulators situated toward the end of a string generally collect more pollution than those in the middle (see Fig. 18). Such non-uniform pollution distribution can also affect DC flashover voltage, as per Fig. 19.
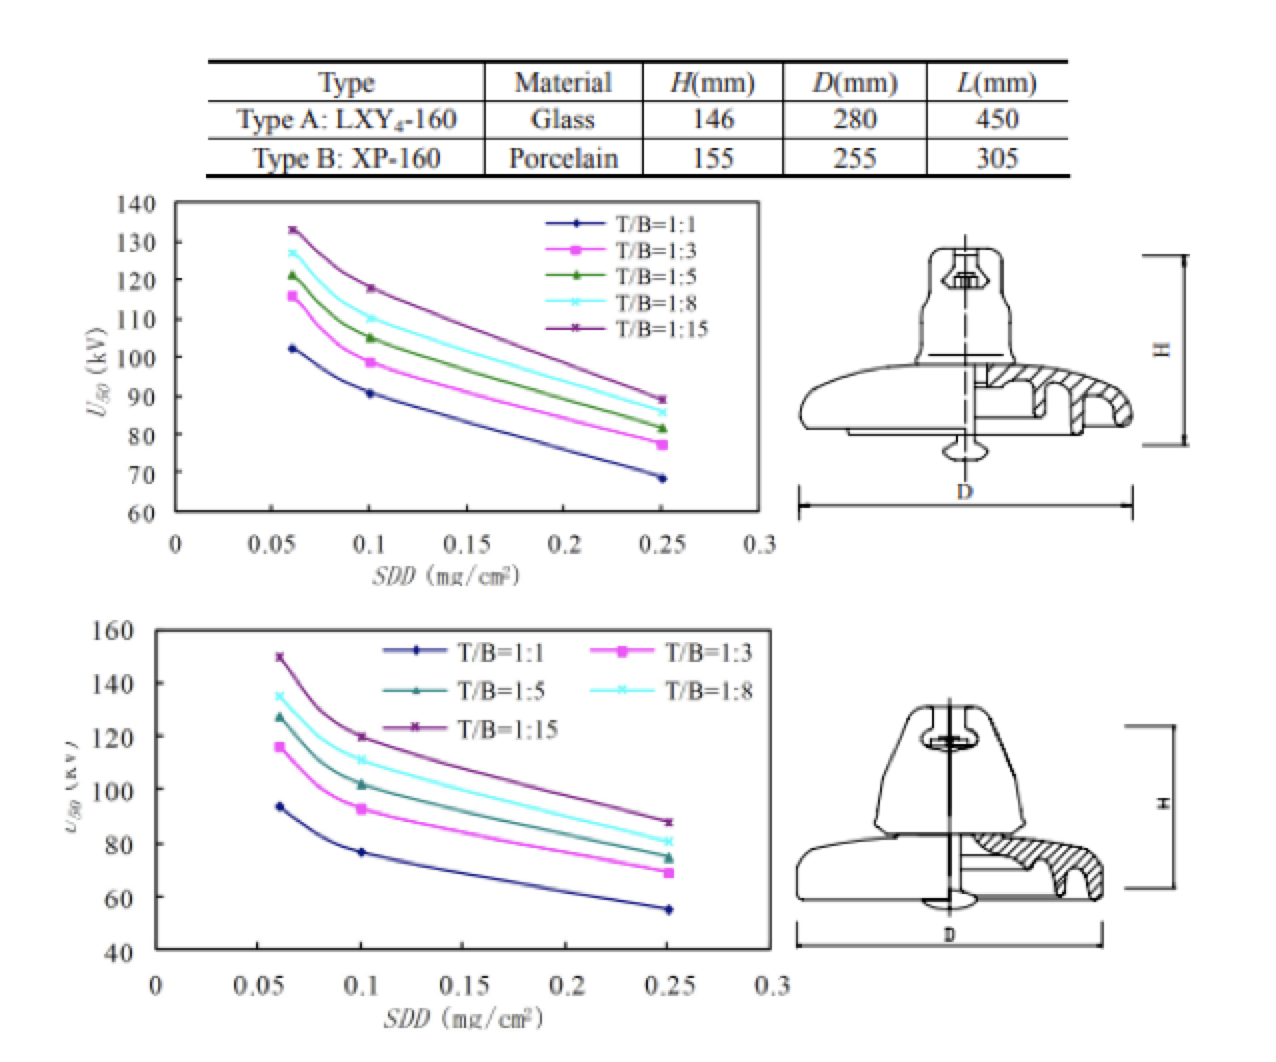
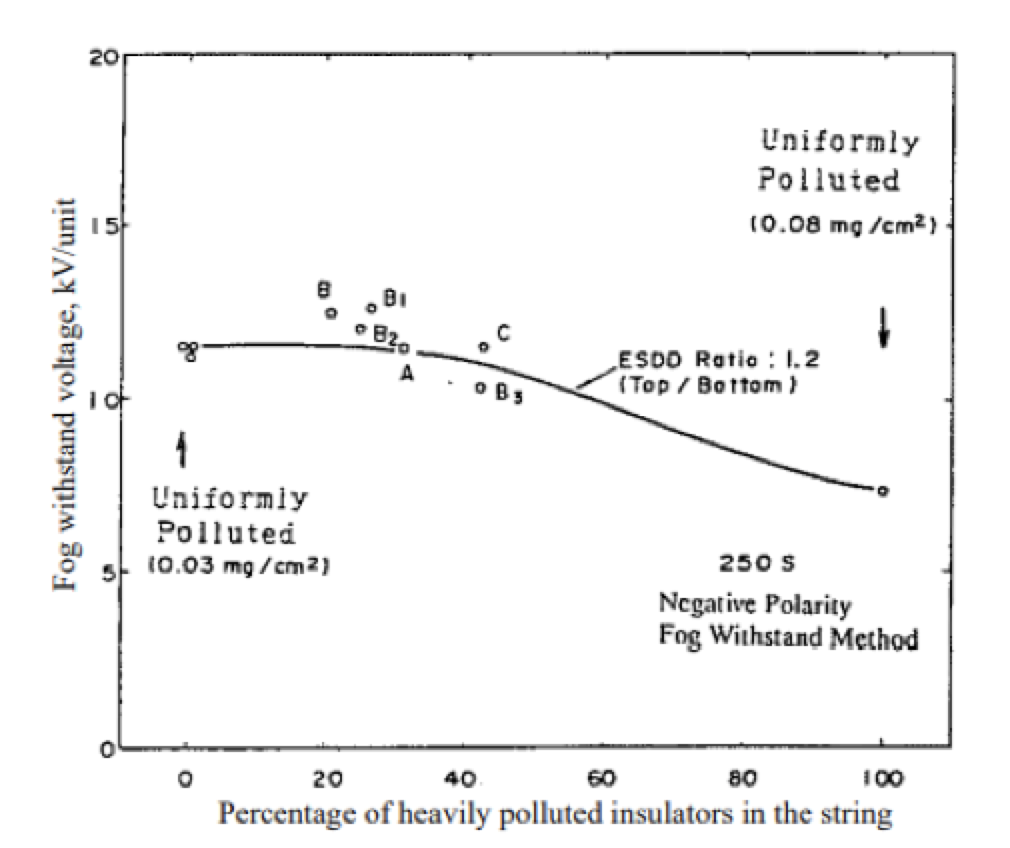
Fig. 19 illustrates the fog withstand voltage of a non-uniformly polluted DC insulator string where the more heavily polluted insulators (i.e. 0.08 mg/cm2) are situated toward the ends as a function of the ratio of heavily polluted insulators in the string. Although such non-uniformity of pollution distribution on the surface of insulators operating in polluted areas has been repeatedly established by research, dimensioning of insulators with respect to pollution is always done based on the performance characteristic of real insulators under uniform artificial pollution. As shown in Figs. 17 & 19, this is the worst-case condition and could result in ‘oversizing’ insulators.
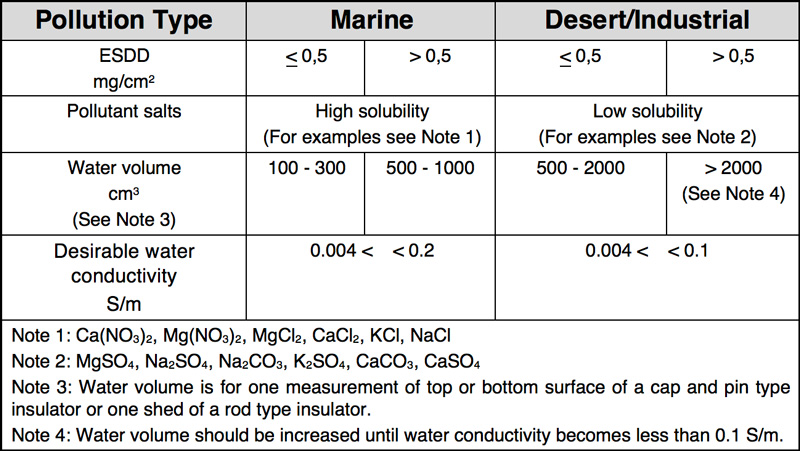
IEC/TS 60815-1 notes that the methods used to measure ESDD and NSDD do not require expensive equipment and are easy to perform. This standard indicates a volume of 100-300 cm3 of distilled/de-mineralized water (or more, if required) for each surface. The problem is that such a volume of this type of water is not easily obtained or transported in the field. If tap water is used, its conductivity value must be subtracted from the total conductivity obtained using the collection procedure. It is also necessary to calculate the volume of water required in total so that there is no shortage during removal of the pollutants. Table 2 presents recommendations by Suzuki of the total volume of water needed for ESDD measurements. More volume may be required for heavy pollution, especially of the desert/industrial type. Water volume is determined to ensure proper conductivity, e.g. less than 0.1 or 0.2 S/m. If conductivity is higher, there may be risk that an excessive amount of salts remain un-dissolved. Ideal size of the containers used to store the water mixed with pollutants for transport to and analysis in a laboratory is yet another consideration.

Annex C of IEC/TS 60815-1 also indicates the need to carry out quantitative chemical analysis of pollutants to allow close examination of service conditions and to identify the chemical components of any soluble salts. But the standard does not inform on how to use the information obtained from this. It is clear that the in-service withstand voltage of insulator strings is influenced by different types of pollutants, i.e. active pollution and inert pollution. It is therefore important to ensure analyzing not only the non-soluble material but also the water used to wash the insulator after the procedure to obtain NSDD so as to know the type of soluble salts that exist in the collected sample.
Active Pollution
This pollution is directly at the origin of leakage currents and resulting phenomena such as arcing activity and flashover that lead to reduced insulator string withstand voltage. Active pollution can be classified into two types:
• conductive pollution that is permanently conductive i.e. pollution with metallic conductive particles, metallic deposits, bird droppings, acid rain or salt fog;
• pollution that needs to dissolve, such as salt deposits near the sea, salt contained in desert sand, gypsum coming from the soil or quarries, cement, fly ash, chemical pollution due to industrial activity or use of fertilizers and treatments in agriculture. In this case, the volume of water needed to dissolve these pollutants is important.
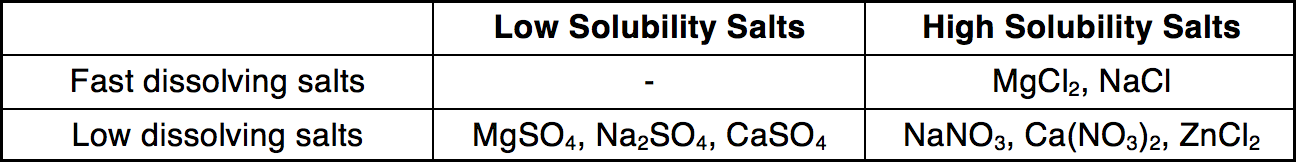
In regard to conductive pollution, global conductance of the pollution layer is the principal element when ranking level of severity. But in the case of soluble salts, global conductance depends on the amount of pollution in a dissolved state and therefore on the amount of water spread out on an insulator’s surface. Two salt characteristics, i.e. solubility and dissolving velocity, are important (see Table 3). For example, the more pollution is soluble and the faster dissolving it is, the less the pollution layer needs water (from rain, fog, etc.) and time to form a highly conductive layer and eventually lead to flashover. On the other hand, this type of pollution is also easily purged. For the same pollution severity level, insulator string withstand voltage will therefore depend on salt properties and on characteristics of the wetting process.
Inert Pollution
This type of pollution is not conductive but can indirectly influence withstand voltage of an insulator string. If the material constituting the inert pollution is hydrophilic, as for example the kaolin or tonoko used in artificial pollution tests, water does not take the shape of droplets but rather forms a film. In addition, a thicker film of water is retained on the insulator surface. During wetting periods, more soluble salts are dissolved in a continuous film of solution. Global conductance is therefore higher. Laboratory tests have demonstrated that, for any given amount of active pollution, insulator string withstand voltage can decrease by as much as 50% when volume of inert pollution grows from 0.1 mg/cm2 to 30 mg/cm2.
Another disadvantage of standardized methods to obtain SPS is that these do not consider impact of the environment. It has become clear based on field experience that, apart from the insulator itself, the environment in which an insulator operates will determine severity of the pollution layer. Translating environmental impact into parameters that can be used to design insulation therefore presents a fundamental problem when designing external insulation with respect to polluted conditions. This is due to the wide range of possible environmental conditions found in coastal, industrial, agricultural and desert regions as well as areas with ice and snow or at high altitude. Combinations of these conditions also occur. A further complication is that environments have an inherent statistical behavior that is to a largely unpredictable.
The most important atmospheric parameters that influence pollution accumulation, conductive film formation and self-cleaning of insulators are rain, temperature, humidity, wind and fog. Duration and intensity of rain are among the most important factors to consider. For example, light rain and mist tend to wet a surface but with no real cleaning effect, thereby leading to more accumulation of surface contaminants. By contrast, longer and heavier rainfalls wash the insulator surface and prevent occurrence of any localized concentration effect. Temperature also has a great influence on the corrosion process of an insulator since it controls the time of wetness value as well as the concentration of the viscous film. As such, it is a highly complex parameter on a drying surface. Moisture in the air that is not precipitation can be deposited on the insulator surface and create a thin transparent film that condenses as the surface temperature falls below the dew point. Wind profile (i.e. speed and direction) is another important factor since wind carries pollutants to the insulators (mainly salt from the sea). However, it is very complicated to assess the impact of wind on pollution deposition and on the flashover process since it has both pollution depositing and cleansing effects.
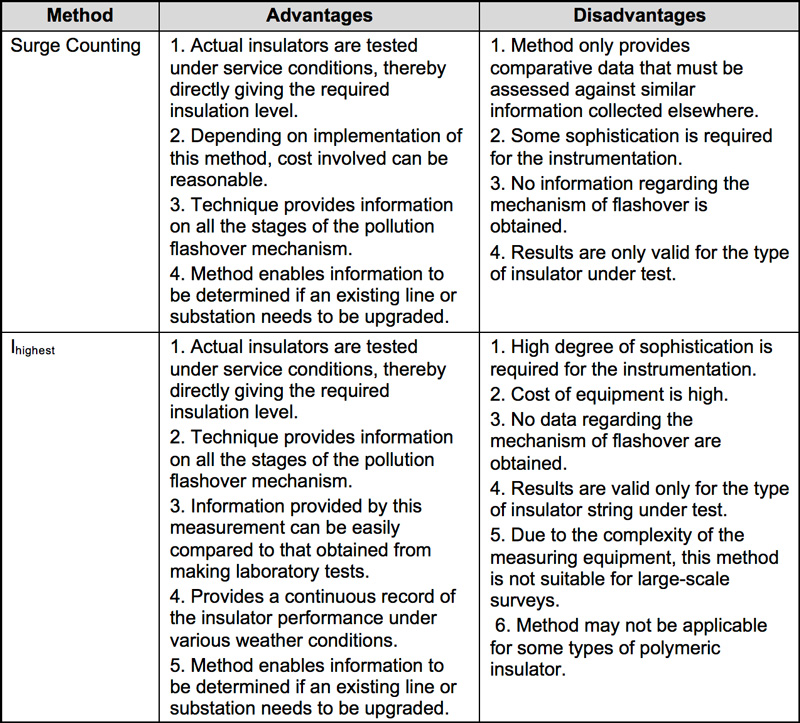
In order to obtain a ‘snapshot’ of the impact of pollution and to eliminate the costs and human resources needed to continuously measure ESDD/NSDD values, several Brazilian utilities have been developing tools to measure leakage current. There are two methods of measuring the current collected at the grounded end of the insulator:
• Surge Counting
In this method, number of leakage current pulses above some fixed amplitude conducted on a test insulator that is energized at its service voltage are counted over a given period of time.
• Ihighest Measurement
In this method, the highest peak of leakage current is recorded during a given time period on an insulator that is continuously energized at its service voltage. This has been considered a suitable parameter to indicate how close an insulator is to flashover.
Both methods have advantages and disadvantages, as discussed in Table 4.
Insulator Selection for Polluted Conditions
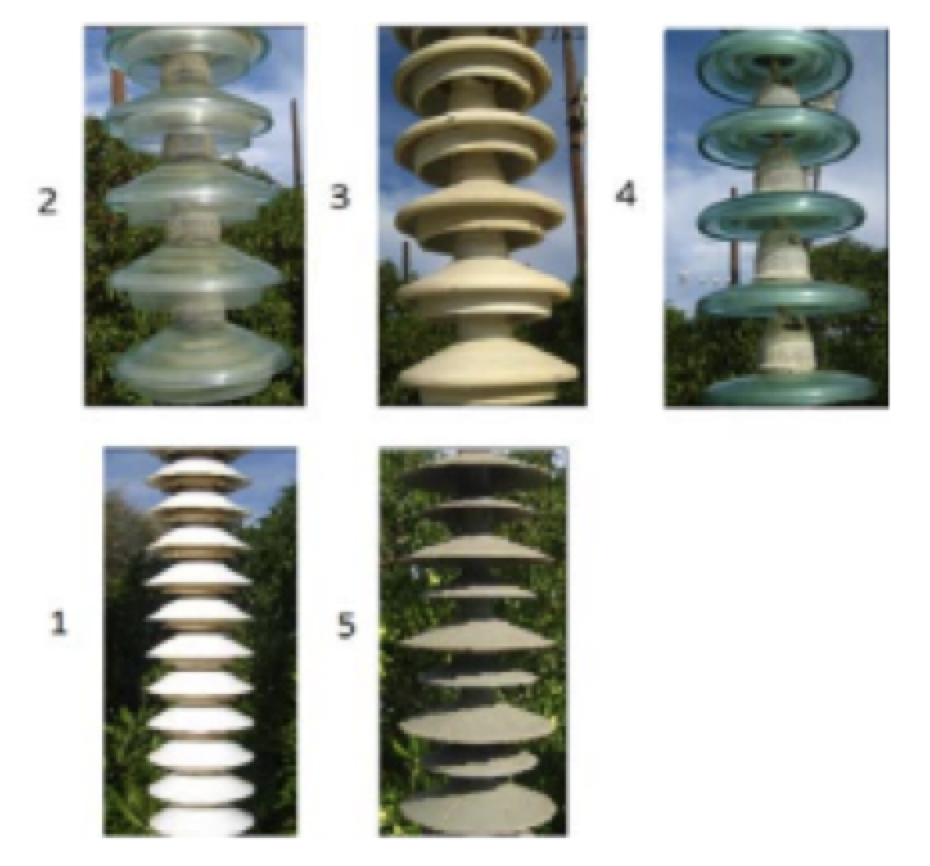
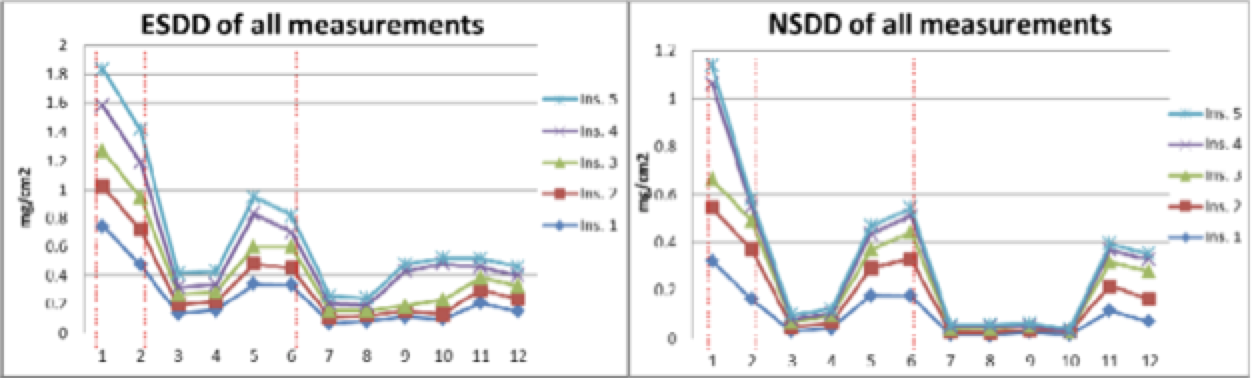
IEC/TS 60815-2 and IEC/TS 60815-3 are applicable for selecting porcelain, glass insulators and polymeric insulators, respectively, for AC systems and for determining their relevant dimensions. These standards state the principal advantages and disadvantages of the main alternative profiles based on pollution accumulation and self-cleaning properties. There is also evaluation of the parameters involved in each profile definition. But to understand the performance of different possible profiles, it is necessary to carry out long duration tests at a high voltage outdoor pollution test station. Figs. 20 & 21, for example, show results of a series of measurements of ESDD and NSDD conducted at the Talos Test Station on Greek island of Crete.
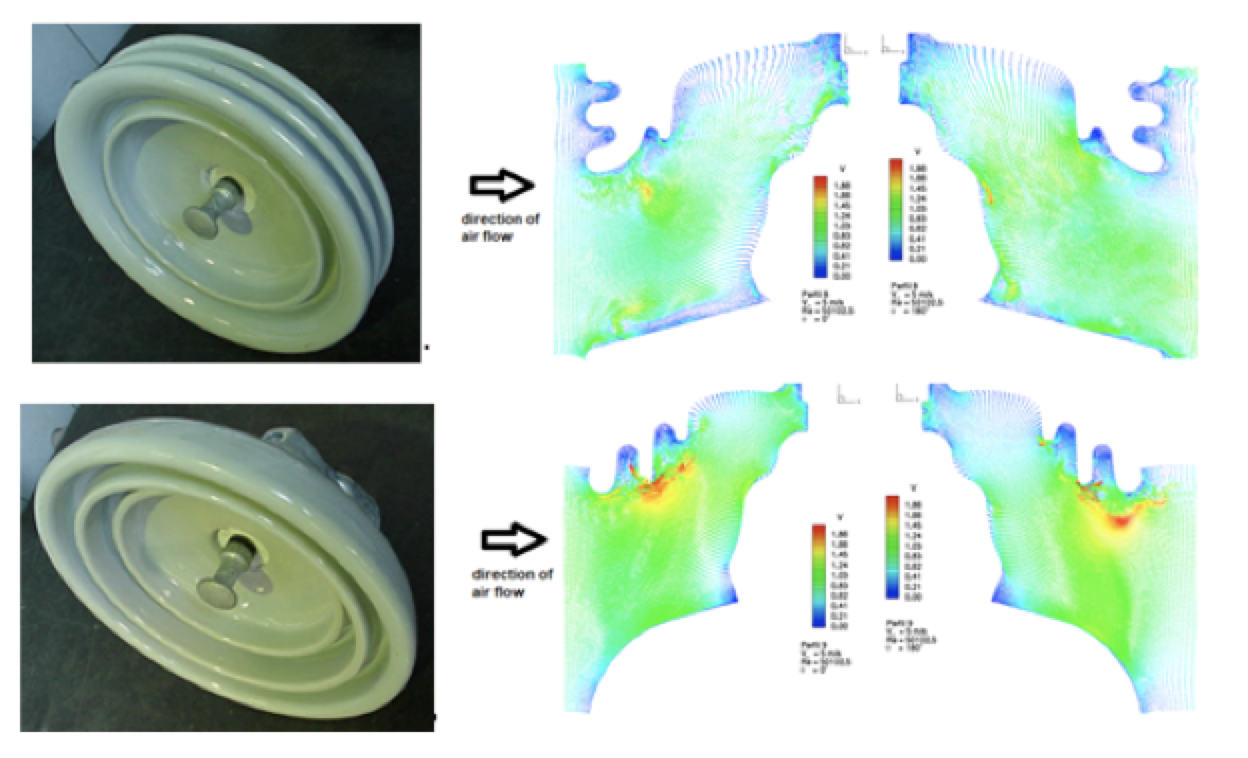
If testing at an outdoor test station is not possible, the non-standardized Dust Cycle Method can be used. This test methodology considers electric field, insulator profile and material as well as the specific factors that influence pollution deposition and therefore well represents the process of natural pollution accumulation. Application of dust is followed by consecutive cycles of wetting and the different insulators tested are ranked according to number of cycles until flashover. Another possibility is using computational study of fluid dynamics to evaluate the geometry of the bottom of an insulator mounted in a string under the action of wind (see Fig. 22). The simulation promotes airflow along the insulator body and verifies deposition of pollutants. This methodology is useful in development of new profiles for reduced cost insulators.
Yet another factor to be considered when selecting insulators for polluted conditions is that IEC/TS 60815-3 presents the possibility to adjust minimum USCD for composite insulators made with a hydrophobicity transfer material (HTM) downwards by up to one pollution class. Based on this, some utilities have decided to apply this same principle to glass insulator strings coated with RTV silicone. Studies are being carried out in this regard but since there are no results so far there may be some risk in adopting such a strategy.
Pollution Tests
When Approach 2 from IEC/TS 60815-1 is used in selecting insulators, it is advisable to perform laboratory pollution testing with candidate insulators and type of pollution will determine the most suitable test method to be used. Unfortunately, there is still no consensus on a representative test method for polymeric insulators due to the inherent hydrophobicity of HTM polymeric insulators. While non-HTM polymeric insulators can be tested in the same manner as ceramic insulators, IEC 60507 and IEC/TR 61245 state that these test procedures cannot be applied to polymeric insulators – a guidance that should cover both HTM and non-HTM insulators.
When comparing candidate ceramic type insulators for a new project, it is advisable to determine maximum withstand salinity at a given test voltage, as per IEC 60507 and IEC/TR 61245. But at the end of this process, it is also advisable to perform a non-standardized quick flashover salt fog procedure (QF) to assess the condition of insulators when new. Salinity to be used in this test is the same as used in the dimensioning process. The objective of this non-standardized test is to have data available to allow comparing performance after removal from several years of operation, as indicated in CIGRÉ Technical Brochure 691.

Conclusions
Much additional effort and study remain necessary to dispel remaining doubts about the best procedure to select insulators for polluted service conditions. At the same time, many electric utilities still need to be persuaded to actually use pollution standards when dimensioning insulators for a new project.
References
[1] IEC 815, “Guide for the selection of insulators in respect of polluted conditions”, First Edition, 1986.
[2] IEC/TS 60815-1: “Selection and dimensioning of high-voltage insulators intended for use in polluted conditions – Part 1: Definitions, information and general principles”, Edition 1 (2008-10)
[3] IEC 60507: “Artificial pollution tests on high-voltage ceramic and glass insulators to be used on a.c. systems”, Edition 3, 12/2013
[4] IEC/TR 61245: “Artificial pollution tests on high-voltage ceramic and glass insulators to be used on d.c. systems”, 03/2015
[5] IEEE Standard 1523: “IEEE Guide for the application, maintenance and evaluation of room temperature vulcanizing (RTV) silicone rubber coatings for outdoor ceramic insulator”, 2002
[6] CIGRÉ WG B2.69: “Coatings for Protecting Overhead Power Network Equipment in Winter Conditions”, Technical Brochure nr 631, 06/2021
[7] S. Wallstrom: “Biofilms on silicone rubber for outdoor high voltage insulation”, Doctoral thesis at KTH, School of Chemical Science and Engineering (CHE), Fiber and Polymer Technology, Sweden, 2005
[8] CIGRÉ WG B2.63: “Compact AC overhead lines”, Technical Brochure nr 792, 02/2020
[9] CIGRÉ WG C4.303: “Outdoor insulation in polluted conditions: Guidelines for selection and dimensioning – Part 1: General principles and the a.c. case”
[10] CIGRÉ WG D1.44: “Pollution tests of naturally and artificially contaminated insulators”, Brochure nr 691, 07/2017
[11] CIGRÉ Task Force 33.04.01: “Polluted insulators: A review of current knowledge”, 06/2000
[12] Z. Zhijin, Z. Jiayao, W. Donghong and J. Xingliang: “Effects of Non-uniform Pollution on the AC Flashover Performance of Suspension Insulators”, Journal of Electrical Engineering Technology, 2016; 11(4), pp 961-968
[13] R. W. S. Garcia, R. Bosignoli and E. Gomes Jr: “Influence of the non-uniformity of pollution distribution on the electrical behavior of insulators”, 3rd International Conference on Properties and Applications of Dielectric Materials, 06/1991, Tokyo, Japan
[14] Y. Taniguchi, N. Arai and Y. Imano: “Natural Contamination test of Insulators at Noto Testing Station Near Japan Sea”, IEEE Transactions on Power Apparatus and Systems, Vol.PAS-98, No.1 Jan/Feb 1979, pp 239 – 245
[15] L. Fangcheng, Q. Chunxu, L. Yunpeng, G. Wenyi and L. Ruihai: “A Comparative Study on Contamination Deposited Characteristics of ±800kV DC Line Insulators”, IJCSI International Journal of Computer Science Issues, Vol. 10, Issue 1, No 3, January 2013, pp 37 – 43
[16] S. A. Suflis, I. F. Gonos, F. V. Topalis and I. A. Stathopulos: “Study of the dielectric behaviour of non-uniformly polluted insulators”, XIIIth ISH, 2003, Rotterdam, Netherlands
[17] R. Boudissa, A. Bayadi, A. Haddad and R. Baersch: “Effect of Pollution Distribution Class on Insulators Flashover under AC Voltage”, 47th International Universities Power Engineering Conference (UPEC), 09/2012, Uxbridge, UK
[18] R. Suzuki: “Assessment of Water Volume for DDSE Measurement”, NGK Report No. TF-11078
[19] Eric Spangenberg: “Pollution Evaluation”, Reunion of IEC WG11, Warswaw,28/09/1999
[20] IEC/TS 60815-2: “Selection and dimensioning of high-voltage insulators intended for use in polluted conditions – Part 2: Ceramic and glass insulators for a.c. systems”, Edition 1 (2008-10)
[21] IEC/TS 60815-2: “Selection and dimensioning of high-voltage insulators intended for use in polluted conditions – Part 3: Polymer insulators for a.c. systems”, Edition 1 (2008-10)
[22] M. Dimitropoulou, D. Pylarinos, K. Siderakis, E. Thalassinakis and M. Danikas: “Comparative Investigation of Pollution Accumulation and Natural Cleaning for Different HV Insulators”, Engineering, Technology & Applied Science Research, Vol. 5, No. 2, 2015, pp 764 – 774
[23] A. Eklund, I. Gutman and R. Hartings: “The dust cycle method: a new pollution test method for ceramic and non-ceramic insulators”, International Conference on Power System Technology, 10/1994, Beijing, China, vol. 2, p.p. 1254 – 1257
[24] A. E. M. Meloni, A. Morgestern Jr., D. R. de Mello, M. R. D. Mauricio and R. W. Garcia: “Evolution of a New Anti-pollution Insulator for Coastal Areas”, Latin America Transmission & Distribution Seminar, paper nr 333, 2004 (in Portuguese)
[25] CIGRÉ Working Group D1.44: “Pollution tests of naturally and artificially contaminated insulators”, Technical Brochure 691, 07/2017