Since inception, IEC standards 60815-1 to -3 have helped guide engineers charged with specifying insulation for overhead lines and substations operating in polluted service environments. Recently, efforts have been underway to revise this standard to make it easier to implement and a Working Group within CIGRE is being set up with this goal in mind.
This edited contribution to INMR by Brazilian insulation expert and member of IEC36 MT 11, Darcy Ramalho de Mello, reviewed some of the problems that can arise during practical dimensioning of an insulator for pollution using the existing IEC 60815 standard.
Role of Standards & Background on IEC 60185
Performance of insulators used on overhead lines and at air-insulated substations is a key factor determining reliability of power systems. Insulators must not only withstand normal operating voltages but also overvoltages that can cause disturbances, flashovers and line outages. Reduction in performance of insulators occurs mainly due to pollution depositing on their surfaces from airborne contaminants that then form a conducting or partially conducting layer when wetted. This ultimately dictates flashover performance. Since it is not normally practical to prevent such a layer from forming, insulators must be designed so that their flashover performance remains sufficiently high to withstand all types of anticipated voltage stresses, in spite of the pollution layer.
Many papers have been published about dimensioning insulators for pollution. IEC 60815 standards offer a guideline for this work in the context of how a technical standard is defined, namely ‘a document established by consensus and approved by a recognized body, which provides, for common and repetitive use, rules, guidelines or characteristics for activities or their results, aiming at obtaining an optimal degree of ordering in a given context’. This definition considers that technical standards should be based on consolidated results of science, technology and accumulated experience, aimed at optimizing benefits. Technical standards help things work properly by providing world-class specifications for products and ensuring quality, safety and efficiency. Application of technical standards is also efficient to reduce process failures since this guarantees a level of quality, which is always a positive since it assures greater product reliability. However, it is noteworthy that none of the above points guarantee that a standard will be easy to apply.
The former edition of IEC 60815 (1986), for example, was based mostly on knowledge obtained from experience with conventional porcelain and glass insulators on AC systems and was therefore applied only for such insulators. This standard specified minimum specific creepage distances for different levels of pollution severity but did not consider all aspects of the environment that can impact performance of different insulator profiles. As such, apart from some restrictions on insulator profile and corrections for diameter, the old IEC 60815 implied that no additional factors needed to be considered when designing insulators for polluted service conditions. In fact, that is why designers in some countries do not consider pollution a real problem.
Revision of IEC 60815 took place from 1998 to 2014 and divided this standard in four technical specifications. The first three were published in October 2008 and consisted of Part 1: Definitions, information and general principles; Part 2: Ceramic and glass insulators for a.c. systems; and Part 3: Polymer insulators for a.c. systems. Part 4: Insulators for d.c. systems was published in 2016. However, one of the main problems has been that the new standards introduced concepts that made it difficult for many users of the former standard to convert into practical application. Based on recent studies, in 2017 it was recognized that Parts 1, 2 and 3 needed revision and this work has since been ongoing within IEC 36 MT 11. Now, upon completion of this revision, it has been recognized that some ideas cannot be implemented because they require more study to arrive at consensus. Establishment of a new CIGRE WG to support further revision and prepare the groundwork for major future improvements will therefore be of great value.

Insulator Selection & Dimensioning
IEC/TS 60815-1 recommends three approaches to select suitable insulators from catalogues based on system requirements and environmental conditions. Unfortunately, application of these approaches is not always straightforward.
Approach 1
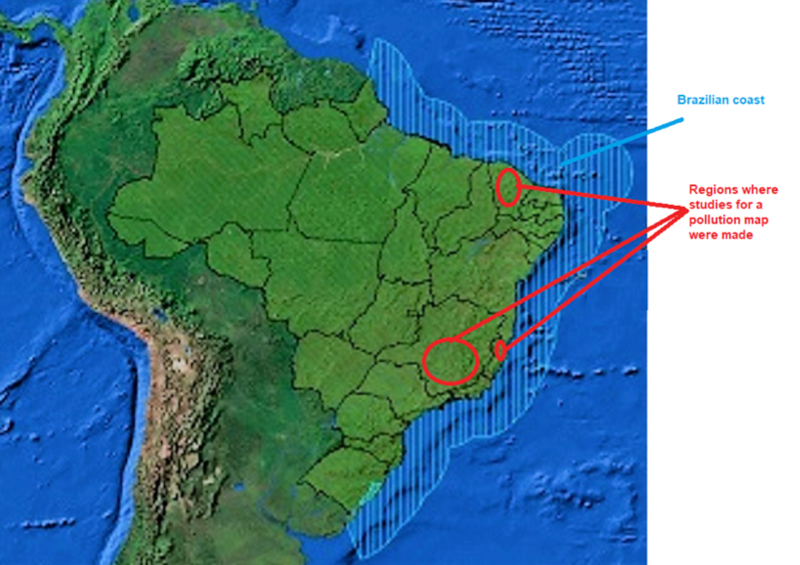
This approach considers a dynamic interaction between an insulator operating on an overhead line or substation and its service environment. This interaction can also be represented at an outdoor insulator test station. One problem, however, is that this approach requires either existence of a pollution map or that there are already other lines or substations operating near the planned route of any new project. But in the case of Brazil, for example:
• There is still no national pollution map and only three regions performed studies in the past to obtain local pollution maps (see Fig. 1);
• There is no outdoor pollution test station to verify candidate insulators for domestic application, even though the country has a coastline measuring almost 7400 km;
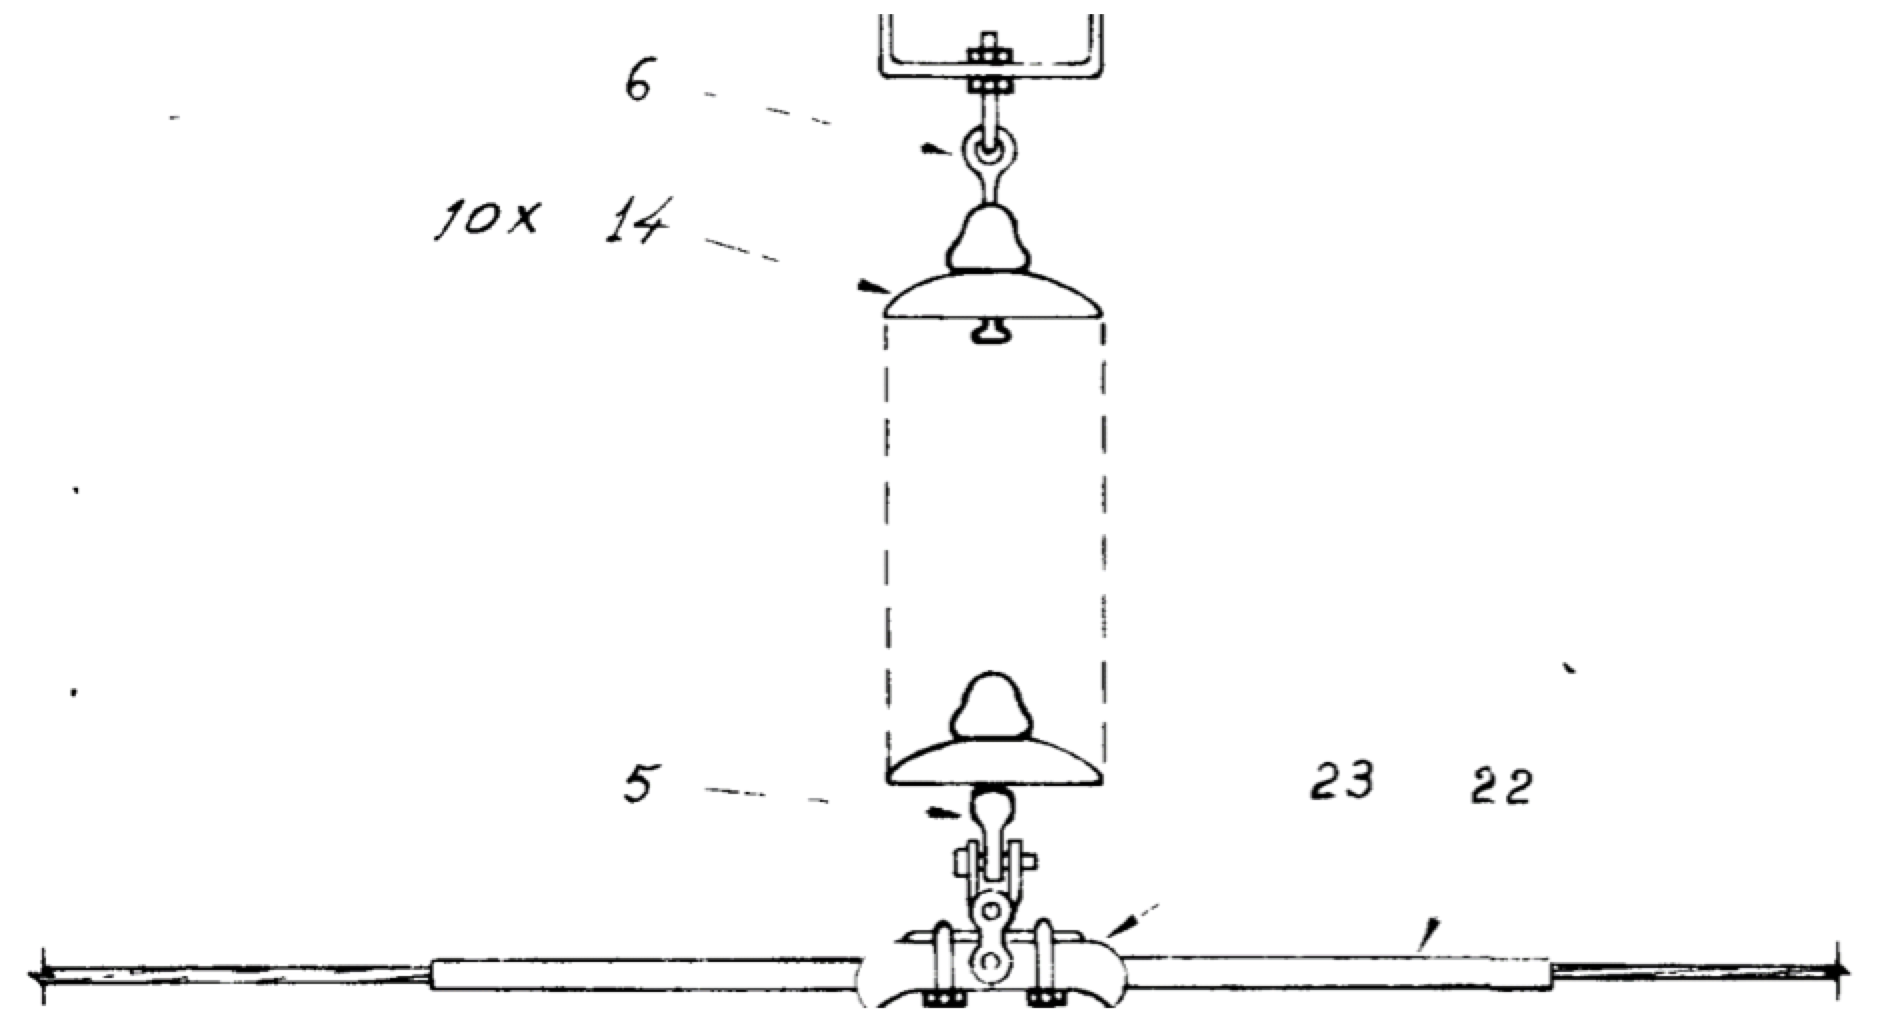
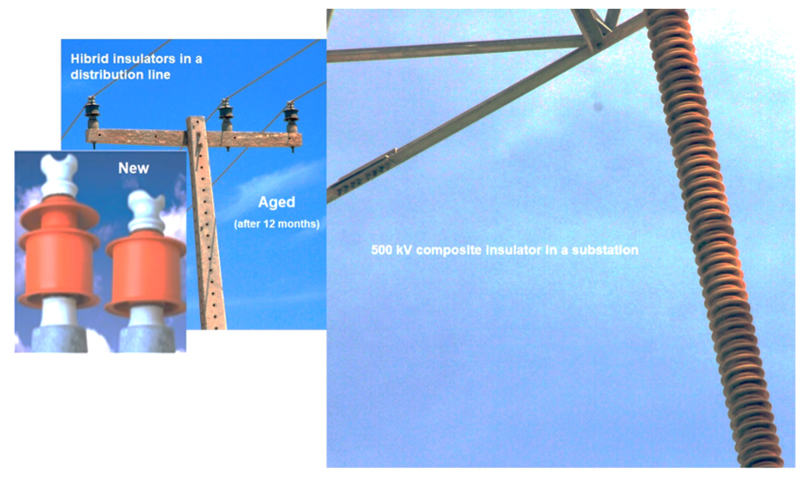
• It can be difficult to obtain information about the pollution performance and creepage distance adopted for existing transmission lines and substations located near the routes of new projects. Moreover, when such information is available, it is often out-of-date. For example, a 345 kV line was planned to pass over two 138 kV lines in a region close to an industrial hub of steel mills. Those responsible for the 138 kV lines produced the string drawing shown in Fig. 2. But the unified specific creepage distance (USCD) of 35 mm/kV obtained with this drawing (10 U120B insulators in a project from 06/1969) did not correspond with the actual insulator profile for the region. After discussion with the maintenance team for these lines, it was discovered that in fact three more glass insulators had been added to each string and that, even then, these had to be washed twice a year. Eventually, composite insulators were selected as replacements after a rigorous pollution study. The USCD of these composite insulators was the same as had been used for the 345 kV line project.
Another problem is the time needed to obtain information. IEC/TS 60815-1 indicates that service experience is representative given satisfactory operation over a period of 5 to 10 years, which may be longer or shorter given the frequency and severity of climatic and pollution events. But in Brazil those charged with design of any new transmission line usually have only 3 to 4 years to develop a project, including line routing, location of substations, choice of equipment and components, etc. As such, with only months to go, line designers still do not have values to define USCDs for the insulators in purchase specifications. Since time is limited and there is no information to allow use of other approaches, designers typically rely on information from nearby lines, even if these do not have the satisfactory operating history as per the standard.
Approach 2
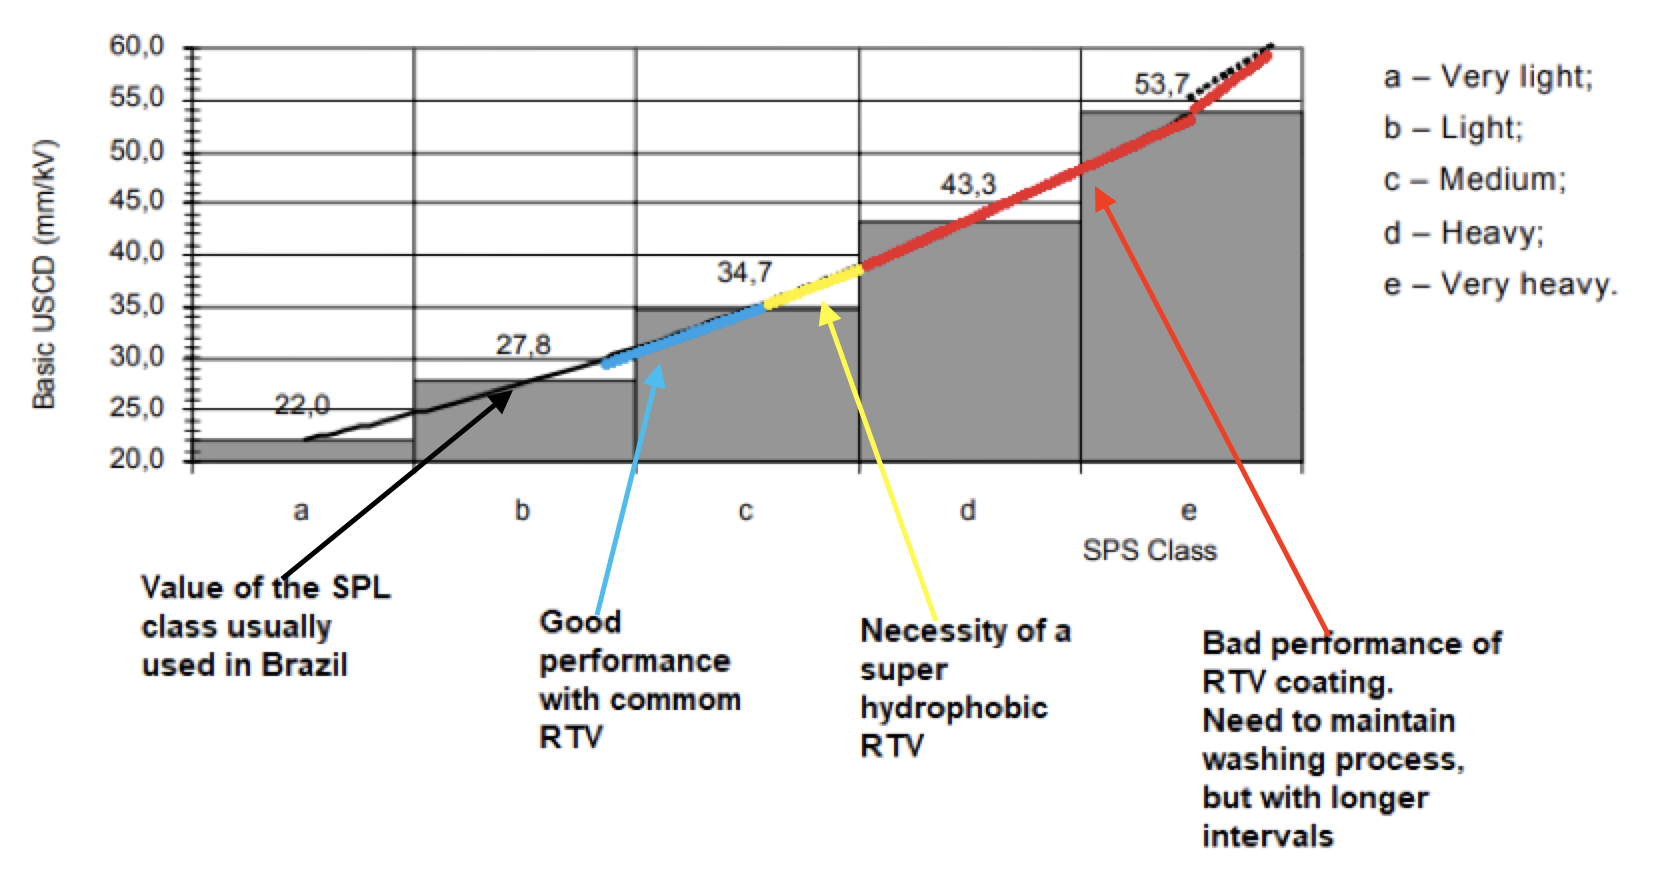
With this approach, the dynamic interaction between the environment and the insulator is represented by laboratory tests and a parameter termed ‘site pollution severity (SPS)’ is measured or estimated. Unfortunately, this interaction cannot be fully represented based on the laboratory tests specified in IEC 60507 and IEC/TR 61245. The problem appears whenever using composite insulators since there is still no standard to perform pollution testing for such insulators. Recently, IEC 36 called for experts to participate in a Working Group to develop a technical specification for determining the AC and DC pollution flashover and withstand voltage characteristics of insulators made using hydrophobicity transfer materials (HTM) that are exposed to outdoor or indoor pollution.
Problems however can appear during estimation of SPS. For example, the Brazilian Electrical Energy National Agency (ANEEL) is responsible for organizing infrastructure projects for the electrical sector and requires that utilities must determine the USCD to be used in their projects. Each utility then normally contracts a line designer to prepare the specifications. Usually, line designers do not consider pollution a problem and commonly use 27.8 mm/kV (i.e. light pollution SPS) in their specifications, regardless of where a line or substation will be located. ANEEL allows 6 months after a new project has been completed to make adjustments and no fines are levied in the event of a service interruption during this period. Should flashovers occur during this 6-month adjustment period due to incorrect insulator dimensioning for the pollution environment, the utility begins washing, initially using an outside contractor but later with its own staff to reduce costs. Clearly, this is not ideal.

Approach 3
With this approach, correction factors are applied for the dynamic interaction between the environment and the insulator. While this can prove rapid and economical for selection and dimensioning, it might lead to underestimating SPS or to a less economical solution overall due to ‘oversizing’. As in Approach 2, it is necessary to carry out research into the climate and environment as well as to identify and analyze all possible pollution sources.
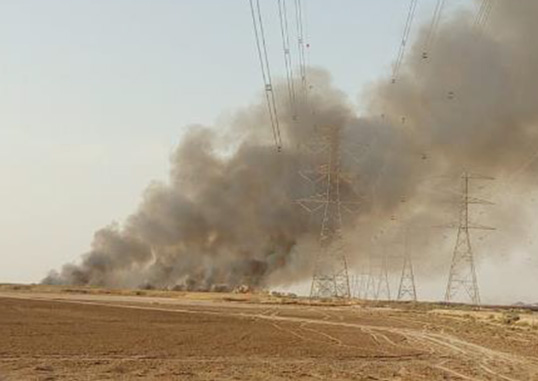
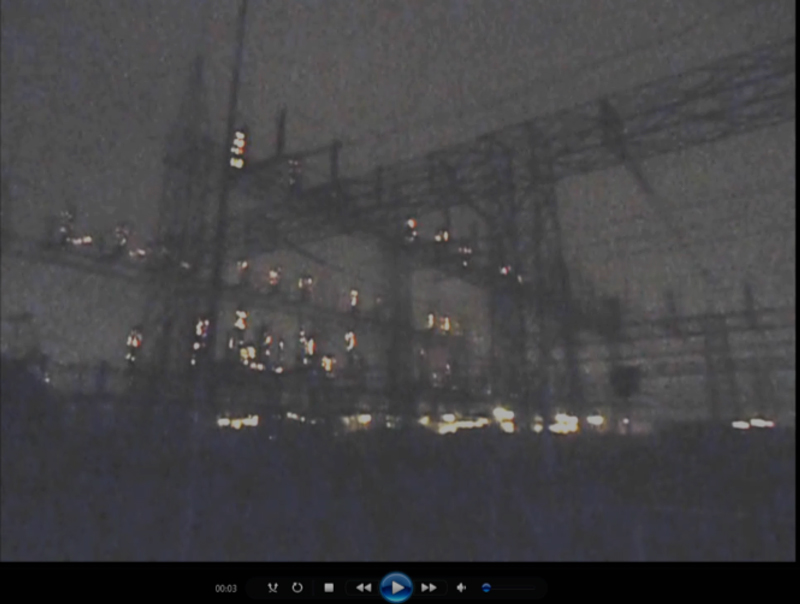
IEC/TS 60815-1 states that estimating climate and pollution sources is not an immediate process and can require several weeks or months. Nonetheless, utilities that operate wind power plants in Brazil commonly use only a few weeks to arrive at this estimation. Moreover, they consider that since substations are located more than 50 km from the sea, the applicable environment for any project is E1, i.e. associated with a ‘very light’ SPS. In the end, they usually settle on ‘light’ for the SPS value. But these utilities fail to consider that the wind that moves their 13-ton turbine blades blows in from the sea and carries salt. The net result is often widespread substation problems due to pollution (see Fig. 3).
In general, the combination of wind speed and distance from the coast determines how much salt is deposited at an inland substation. Also, the greater the distance an air mass has traveled over the ocean, the more salt particles it will contain and the greater the likelihood that these attain higher elevations. This means that even insulators located quite a distance inland can still experience flashovers due to salt contamination. In Brazil, for example, substations with less than optimal insulator dimensioning have to be washed every 12-15 days to prevent flashovers.
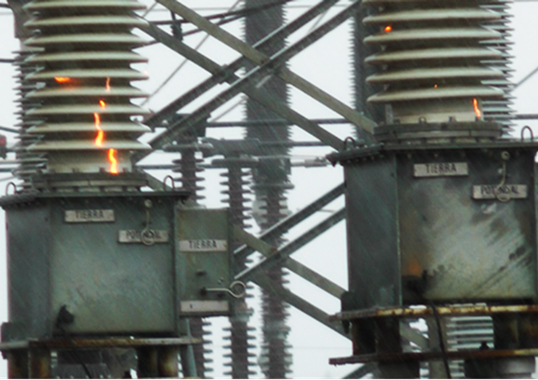
To compensate for such design failures and to reduce the cost of washing, application of room temperature vulcanized (RTV) coatings has now become a common solution. IEEE Standard 1523 states “it is not recommended to use RTV coatings as a solution to bad design such as too low leakage distance for the specific contamination condition”. Experience with application of RTV coatings in Brazil has shown that, depending on the real SPS of an installation site, if the project had used ‘light’ for its SPS value, application of coatings can either eliminate need for washing or at least allow for longer intervals between scheduled washings (see Fig. 4).
Another factor to considered when analyzing the pollution environment of a project is local presence of sand. As seen in Fig. 5, 6 and 7, for example, the thin sand found at Lençóis Maranhenses, a coastal region in Brazil’s northeast, combines with strong winds to act like sandpaper on surfaces of composite insulators.


Yet another factor to consider, especially in tropical areas such as the Amazon, are biological growths on insulators (see Fig. 8). While IEC/TS 60815-1 states that this topic needs to be considered, it does not explain how. Contamination by growths such as moss, lichen and other species on transmission line and substation insulators can increase both corona intensity and leakage current. In 2014, a Brazilian utility was heavily fined because an ANEEL inspector considered the substation to be dirty due to presence of biological growths on insulators.

Evaluating influence of biological growths on insulators should begin with identification the specific organisms involved as well as their relative influence on performance. This task is made more complex because this must be evaluated with the growths still alive.

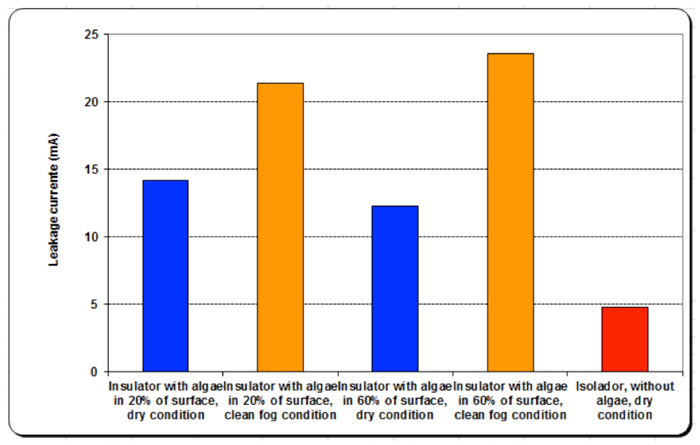
When alive, biofilms have the ability to retain water on an insulator surface, which results in increased leakage current levels under wet conditions (see Fig. 9). Dead biofilms, by contrast, present the same behavior as a dry pollution layer. If findings suggest a significant influence on performance, the following tasks are recommended: defining the specific forms of these growths; assessing alternative solutions to control these contaminants on surfaces of existing insulators; and finding preventative solutions for new insulator installations.
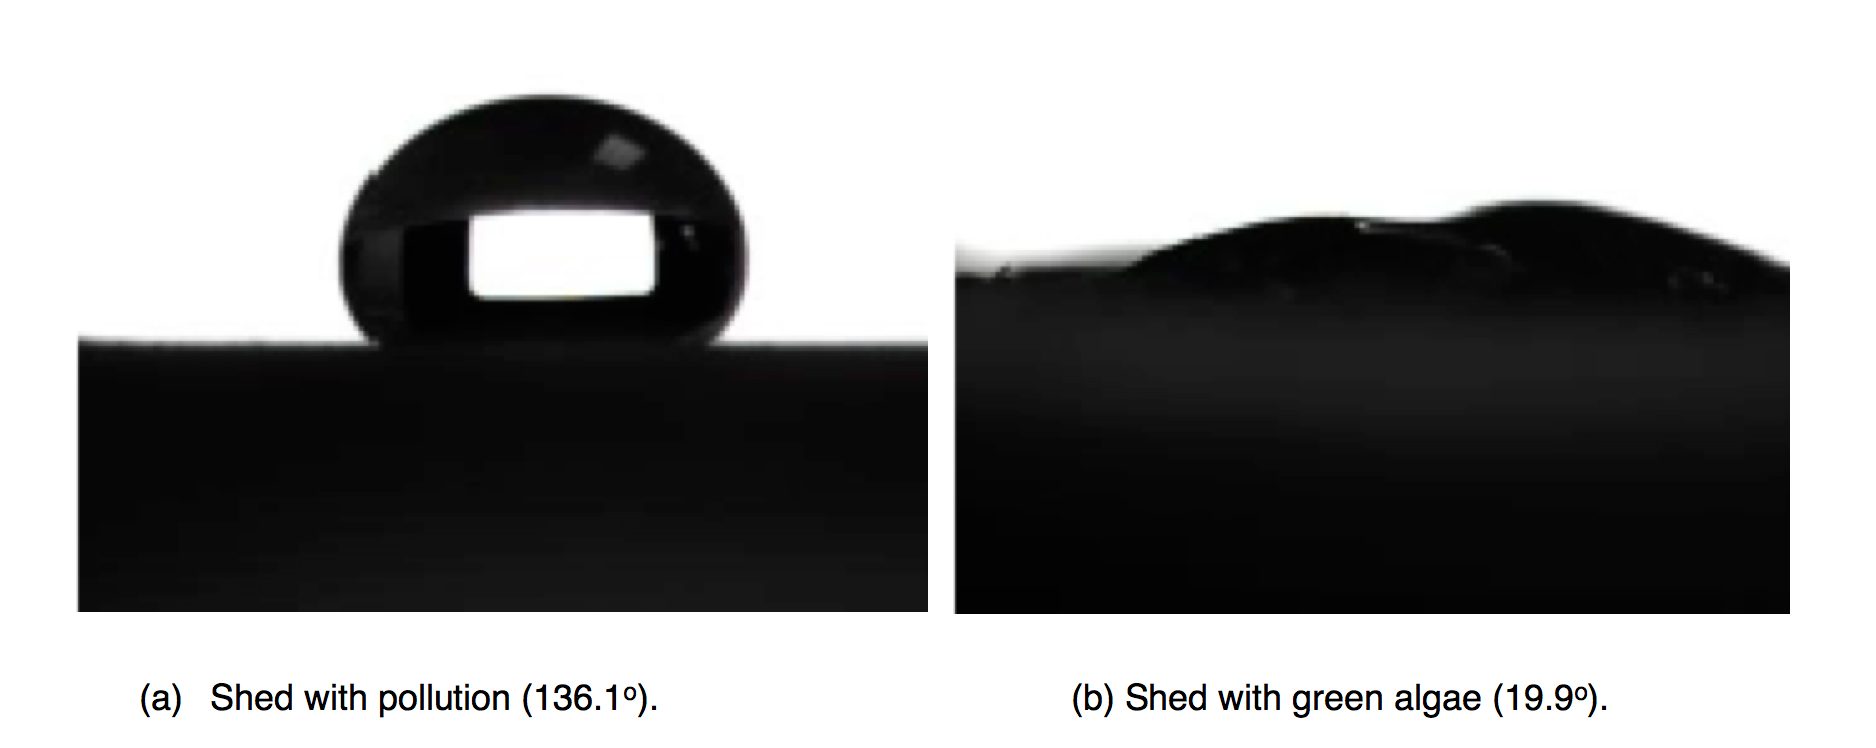
Available service experience has suggested that biological growths are usually not critical from the flashover point of view and no flashovers in service attributed to them have been reported. Yet field observations of composite insulators with these growths confirm that these can still reduce surface hydrophobicity (see Fig. 10). Normally, this does not occur along the full length of an insulator surface because growths are usually found mostly in sun-shaded areas.
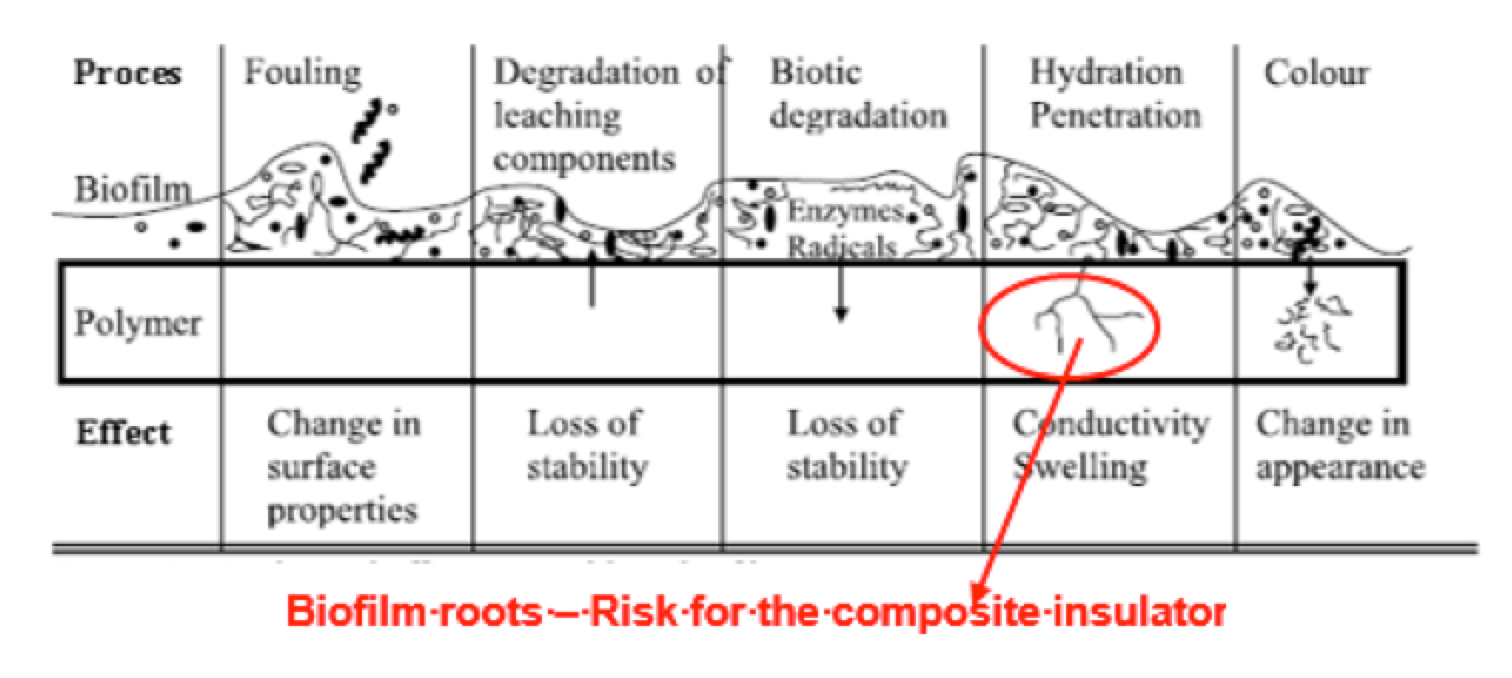
Based on current knowledge, biological growths are mainly a surface phenomenon that can attack and modify the housing material of composite insulators. But risk of reduction in ageing performance is generally deemed low. Still, more investigations are needed for sub-tropical and tropical countries with specific biological species. For example, experimental studies have shown that certain algae cells produce protein enzymes and free radicals that influence the degradation process. Penetration by roots can even make structural changes in a housing and allow moisture penetration, i.e. a risk to insulation performance (see Fig. 11).
Until now, it is felt that there is no urgent need for removal of biological growths from insulators in service and thus it is mainly a management decision based on appearance and how this might be perceived during an inspection. The most applicable procedure to remove biological growths is cleaning but it is possible that this might also wash away low molecular weight silicones located on the surface and temporarily reduce hydrophobicity. As such, the question of how to most effectively clean affected insulators remains unresolved and in need of further investigation.
Cleaning by high-pressure washing is generally not recommended. Rather, manual cleaning with special lint-free cloth and mild detergent in water is preferable. Research to develop biocides to prevent biological growths is ongoing but seemingly still without a practical commercial solution. In Brazil, work to develop a transparent RTV coating containing a biocide has yielded positive results but only for a specific type of biofilm found in the Amazon (see Fig. 12).

In conclusion, laboratory investigations have been performed worldwide on insulators with biological growths, either removed from service or artificially grown for testing purposes. The different types of pollution tests included variants of clean fog tests with the insulator polluted by biological growths subjected to artificial wetting and voltage. Results showed that in the worst-case scenario (i.e. when insulators are contaminated both by normal contaminants and a high level of biological growths) flashover voltage might drop by up to 40% compared to for new clean insulators. However, such findings cannot be used statistically to estimate impact on risk of flashover and reliability, as confirmed by service experience.