By design or necessity telecommunications cables are often installed in proximity to or in the same service corridor as high voltage overhead lines. The electrical energy of conductors can have significant impact on the performance and safety of these cables and it is critical to ensure that electromagnetic interference (EMI) and dangerous levels of electrical energy are not being induced into them.
This edited contribution to INMR by experts at Integrated Engineering Software in Winnipeg, Canada discusses simulations to determine the effects of terrain and other parameters that can influence interaction of HV lines and nearby communications cables.

Transmission towers are usually 10 to 40 m high with typical spans varying from 200 to 400 m. Given this, the Finite Element Method (FEM) is not generally suitable to conduct simulations in such situations. Rather, the Boundary Element Method (BEM) is more applicable to very large domains where FEM approximation would have too many elements to be practical.
The COULOMB BEM solver is especially well suited to simulate this problem. It is based on a boundary integral equation that allows the unbounded problem to be entirely defined at its boundary, thereby reducing the number of variables required to solve it. This methodology can be used to find potential gradients not only over the surface of conductors but also anywhere of interest in space.
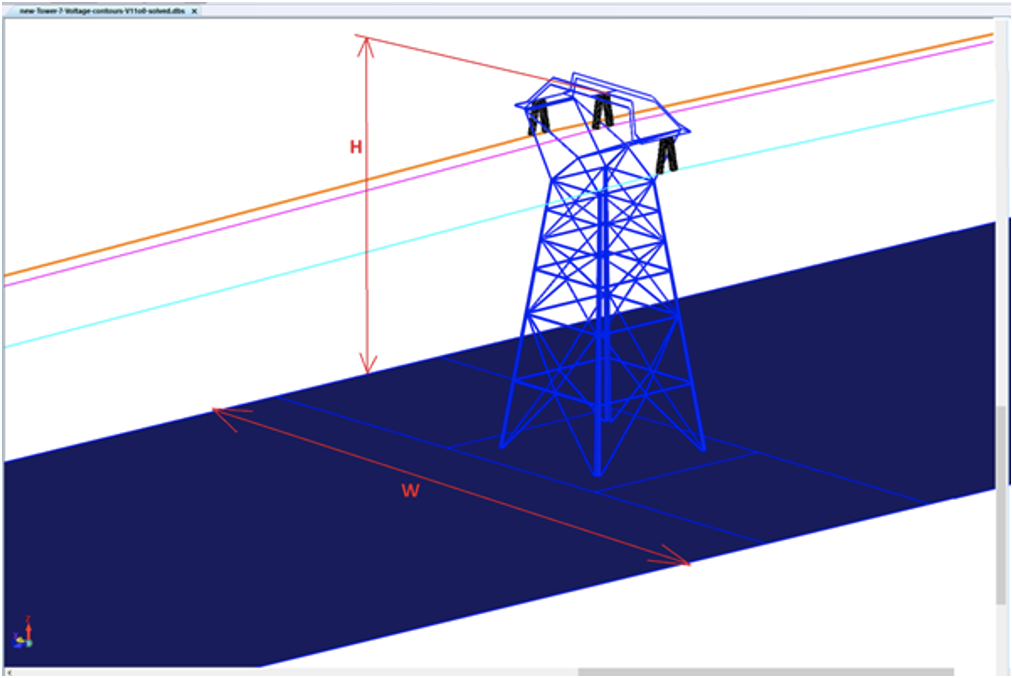
As example, for W being the width of the ground plane and H being tower height, the following cases were considered:
(a) W=H, for analyzing electric field on the ground and 1 m above ground;
(b) W=3H, for analyzing field in the space between an overhead line and 1 m above ground.

It should be noted that number of 2D triangular elements on the ground increases with increasing size of ground plane and solver will therefore take longer. This time can be reduced if lower (1/100) triangular element density (i.e. number of triangular elements per unit area) is taken versus element density on insulator strings and metal hardware. Electric field analysis for W=H and W=3H shows that there is not much difference between E-field variations for both cases (see Figs. 2a and 2b). As such, the W=H case is considered suitable to analyze the problem since it reduces complexity while also generating accurate results.
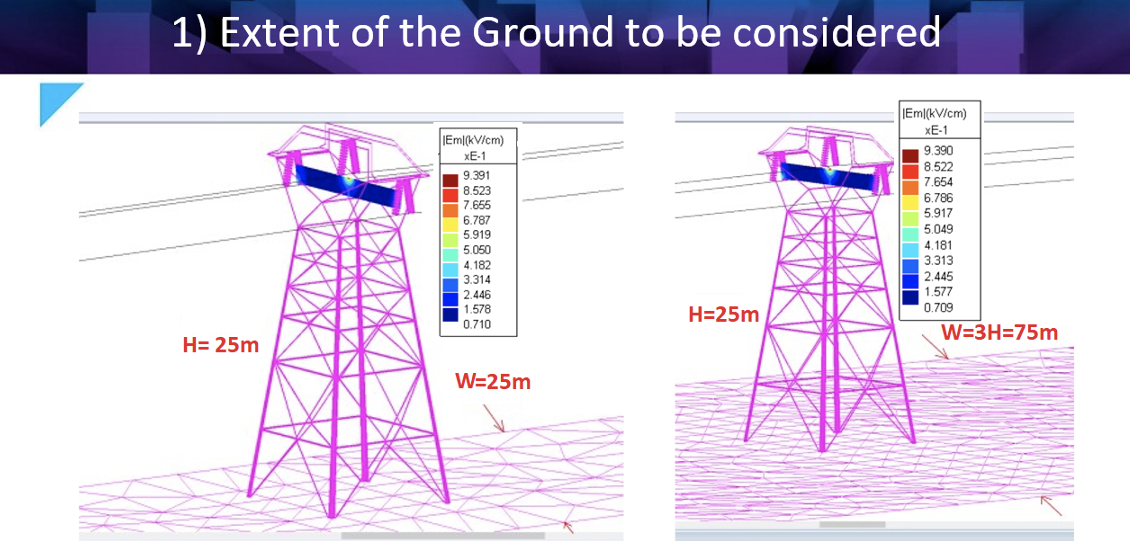
Fig. 3 shows the transmission line set-up with 200 to 400 m separation between adjoining towers. If the overhead line is considered a thin long cylinder with radius 1 to 3 cm, it would then require a vast number of 2D triangular discretization elements and the model would be difficult to solve. To simplify, the overhead line could be assumed as linear segments that would need 1D discretizing elements.
For purpose of comparison, both cases were analyzed, i.e. linear segments and thin cylinder overhead lines. Plot of E-field along Line AB for both cases shows that results for linear segments overlap the plot for thin cylindrical line with less than 1% difference (see Fig. 4). Hence, simulation of power lines as linear segments is recommended to reduce number of elements and offer a quicker solution.

Maintaining desired sag in overhead lines is important. Hence while calculating fields at the communications cable, its sag must also be simulated. If amount of sag is too low, the conductor is exposed to a higher mechanical tension that might eventually lead to breakage. By contrast, if amount of sag is high, the conductor can swing at higher amplitudes due to wind and come into contact with adjoining conductors.
For equal tower heights, maximum sag is: S = u *L*L/(8T), where u is the weight per unit length of overhead line, L is span length, and T is optimum mechanical tension applied to the line. The shape of the sagged line is very close to a parabola. Usually, parameters u and T are not readily available but maximum sag S can be determined. Fig. 5 plots E-field along the communications line and it is evident that the field near points A & B is significantly higher than at the mid point, C.

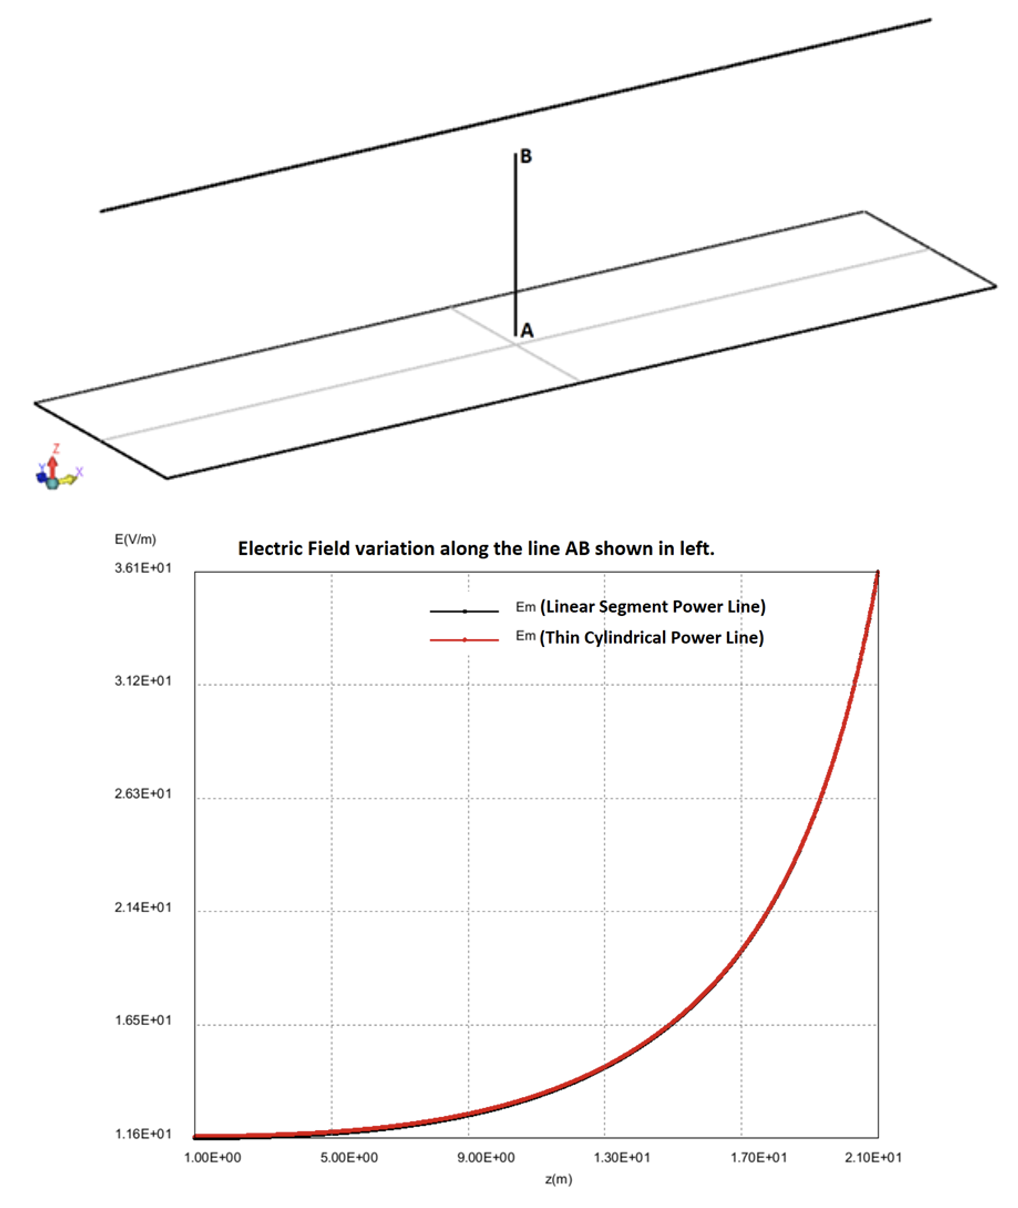
It can be time consuming to simulate a transmission tower due to complexity of the model. Given this, it is better to model only that part where the insulator strings are attached to the conductors while approximating the rest of the tower as a solid structure. To verify this assumption, both cases were simulated to assess any difference. Fig. 6 plots electric field for the actual tower geometry and also for part of that geometry with communications lines only. Since the plots for both cases overlap, simulating only a portion of the tower can produce accurate results while also saving time.
Evaluation of electric field from insulators and connected metal hardware along communications lines is another important aspect in such a simulation (see Fig. 7). E-field is large only in and around a few (e.g. 5 or 6) sheds on either end. Note that tower is at ground potential. If the E-field on the first sheds on either side of the string is less than the breakdown field, E-field on other sheds will be much less than critical. Therefore, modeling only the first few sheds on either end is important while the rest of the model can be treated as a cylindrical insulator.

Symmetry and periodicity conditions in COULOMB were utilized to reduce size of the model as well as time and disk space required to obtain a solution. The prime requirement for using a symmetry condition in a design is that the geometry and materials have mirror symmetry about one or more of the principal planes. COULOMB allows defining symmetry about any of the three main Cartesian planes: X = 0 (YZ plane), Y = 0 (ZX plane), and Z = 0 (XY plane).
Insulators and metal hardware are axisymmetric objects and can be modeled in the simulation as two 180° sections or four 90° sections. This simplifies the model and electric field can be conveniently calculated at the side of interest.
Fig. 8 plots electric field along the first 7 sheds of the insulator looking from four sides. The results show that axisymmetric modeling can be a realistic alternative to 3-D modeling to accurately compute electric field.