Power companies need to evaluate design Site Pollution Severity (SPS) for new overhead lines and substations as well as for uprating and refurbishment projects. According to IEC 60815-1 and IEC 60815-4, there are several parameters/methods to measure SPS, comprising both direct and indirect pollution measurements. All require that measurements be performed once a month over a minimum of a year. Over a typical 1 to 2 year measurement campaign, that means from 12 to 24 measurement points will be available. The highest value is recommended for estimating SPS. At the same time, IEC 60815-1 recommends choosing the 2% value to estimate SPS, which requires additional data. As such, there is growing interest in pollution modeling using weather parameters and larger volumes of data.
At present there is no need to search weather parameters such as wind speed and direction as well as rain intensity from meteorological stations. These are available on different databases, often with a resolution of one measurement per hour and more freely with the resolution 4 hours. This provides thousands of points per year instead of only 12.
Increased interest for pollution modeling has been confirmed by three related papers published at the 2022 INMR WORLD CONGRESS in Berlin. This edited contribution to INMR by Igor Gutman and C. Ahlholm of I2G in Sweden in cooperation wth Kjell Halsan and B. Thorsteinsson of Statnett in Norway reviewed verification of the most promising weather model for modeling SPS.

Improved Methods for Pollution Modeling
The first attempt for practical modeling of ESDD was presented at the CIGRE Session in 2014, “Application of weather models for the evaluation of design ESDD for harsh pollution conditions.” Further, a modified Japanese wind model (the Taniguchi model) considering natural contamination and natural self-cleaning was developed. Correlation between the Directional Dust Deposit Gauge (DDDG) measurements and the main pollution parameter – ESDD – was established. The approach for the modification and improvement was as follows:
• The first series of calculations were made for the same time period as available DDDG measurements and were used to calibrate the model, which is test site dependent;
• Then, long-term weather data was used to backtrack the historical level of pollution, in terms of ESDD;
• Once historical ESDD variations become known, a massive volume of data consisting of thousands of ‘measurements’ can be used as input for statistical or deterministic dimensioning of insulation, according to IEC 60815-1.
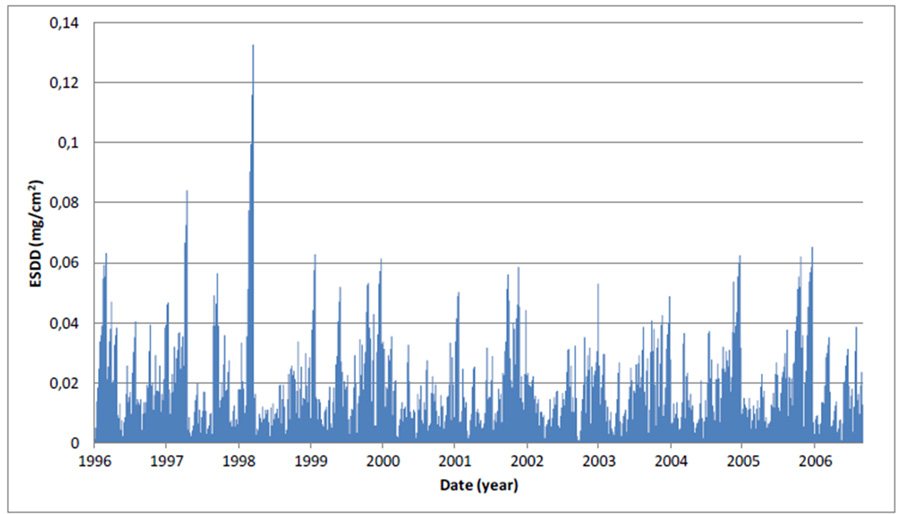
This approach would provide an estimate of SPS including historical variations that might not be captured during any single year of direct ESDD or indirect DDDG measurements. Fig. 1 offers an example of such modeling for a substation affected by coastal pollution on Sweden’s west coast. The model consistently predicts seasonal peaks in contamination due to winter storm that are typical for this area, thereby confirming validity of the results.
More than 20 different modifications of DDDGs were historically installed in different locations across Norway collecting data for different practical projects. This data was used for further improvement of ESDD modeling. First, several more advanced approaches were investigated using meteorological parameters to predict ESDD levels. For example, in recent years researchers have demonstrated increased success in tracking the density of Particulate Matter (PM) using satellites and ground-based results (which normally complement each other) and then defining the fractions associated with sea salt, man-made inorganic ions, dust and carbon black.
Pollution accumulation on insulators is always modeled and simplified by two processes:
1. natural contamination (accumulation of contamination on insulator surfaces); and
2. natural cleaning (washing of the insulator surface).
The models usually consist of the so-called source function, which describes how much pollution from airflow (salts in this case) ends up on an insulator surface over any given time. By means of recursive summation of the source function, it becomes possible to calculate how much pollution has accumulated on the surface of an insulator over a given period. Natural cleaning by precipitation having a certain intensity reduces the amount of pollution accumulated. The time-stamped amount of pollution on insulators is thus always a balance between accumulated salt from the source function and cleaning by precipitation.
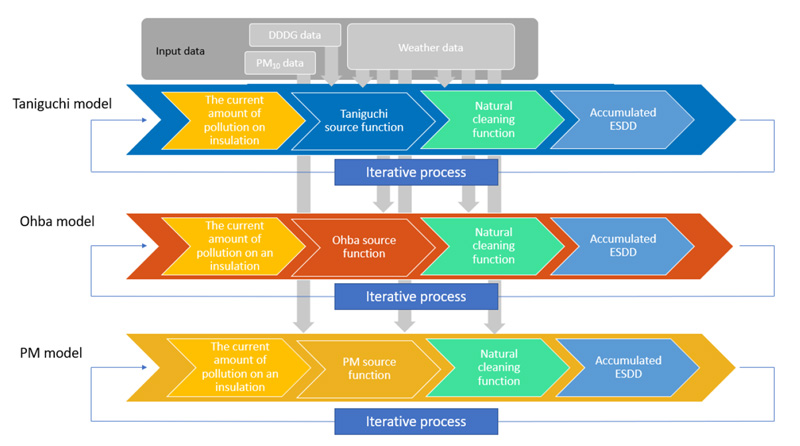
Both natural cleaning and pollution source functions are in turn dependent on weather data. Thus, weather data at any given time will determine the amount of accumulated pollution and the portion of pollution that has been cleaned off. Three models, intended to calculate the amount of sea salt on insulators in terms of ESDD and all using mesoscale based weather data, have already been developed. A schematic of these is presented in Fig. 2:
• Taniguchi Model based on the wind speed;
• Ohba Model based on accumulation of particles from the air on insulators, allowing for the influence of topography;
• Particulate Matter model (PM) based on the standard parameter, PM, which describes the mixture of solid or liquid airborne particles, typically measured in µg/m3.

Comparing Three Models & Verification of Results
Design ESDD from different sites in Norway was used for the first verification of results obtained by the three different models (i.e. Taniguchi, Ohba and PM). The design ESDD was established for 11 measurement sites based on application of different approaches, including: analysis of different historical and recent pollution measurements; analysis of the environment; analysis of service experience, etc. This ESDD value was then compared with modeled 2% maximum design ESDD as calculated by the three models (see Fig. 3).
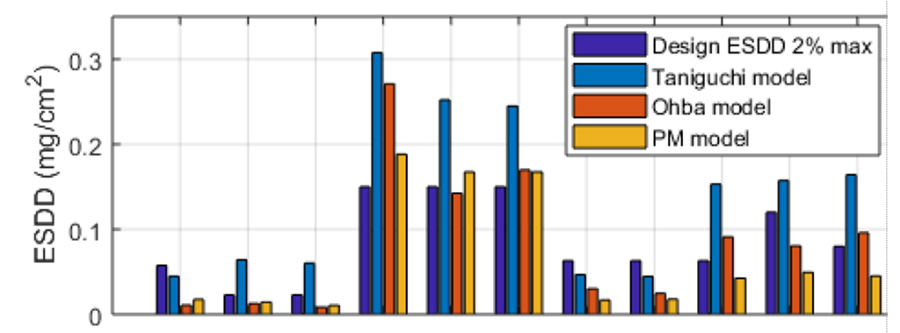
What was found is that the Taniguchi Model calculates ESDD on average about 0.05 mg/cm2 higher than design ESDD whereas the Ohba Model calculates approximately the same average ESDD as design ESDD. The PM Model provides a slightly lower ESDD than design ESDD (about 0.02 mg/cm2). Based on this, the Ohba Model was considered the most promising for further application and improvement.

Modification of Ohba Model & Verification of Results
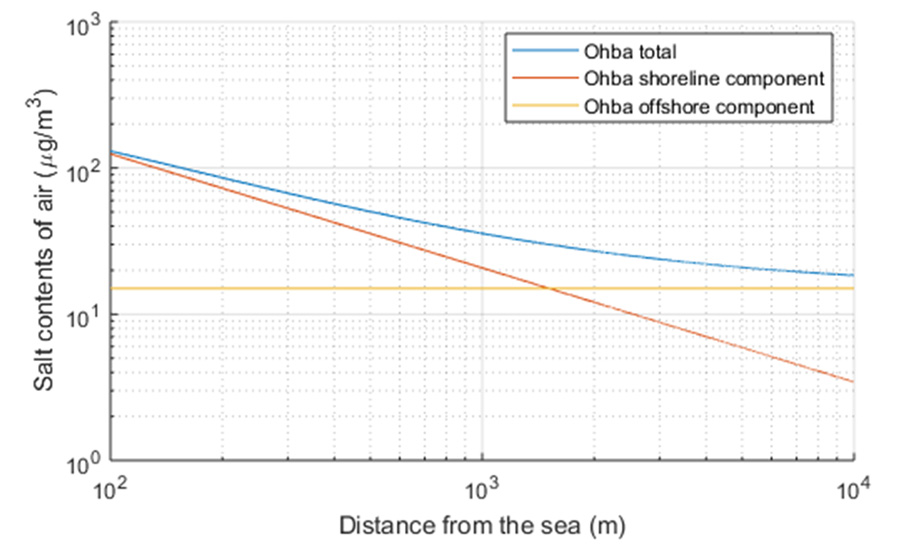
The Ohba Model considers difference in wind speed over the sea and over land, i.e. influence of topography. Based on different measurements in Japan, relationships were established between rate of sea salt production on the coast, flux of salt from offshore areas and wind velocity at sea (see Fig. 4). As can be seen, offshore production of salt is a constant function, independent of distance to the sea. The onshore component, however, declines rapidly with distance to the sea. Moreover, a ratio of sticking probability was proposed for a standard cap and pin insulator compared to the test tube (i.e. cylinder) used during these experiments.
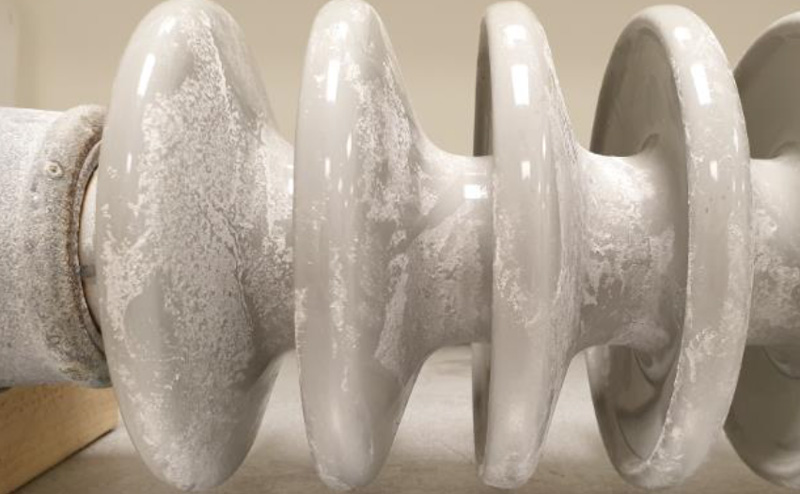
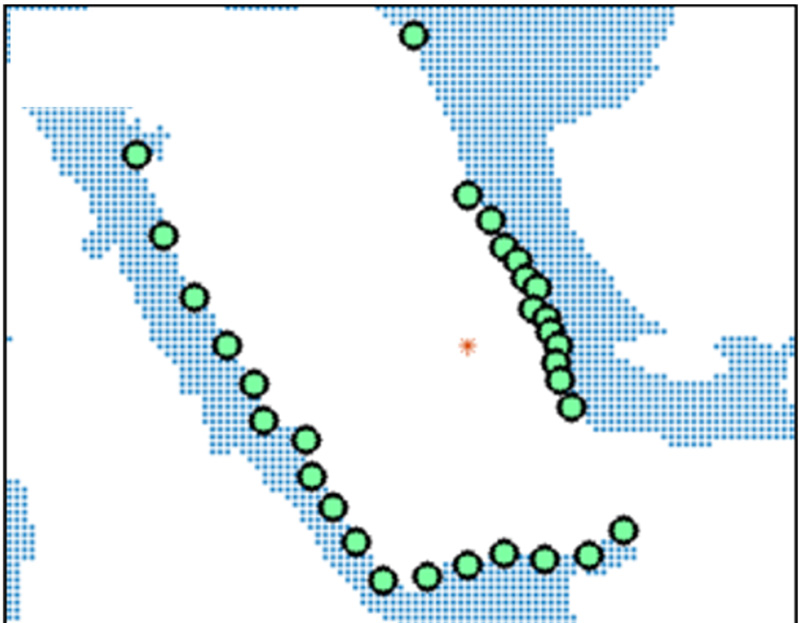
A more careful evaluation of the feasibility of the Ohba Model was performed for a Norwegian coastal area with fjords where pollution-induced events were suspected. Two measurement sites were used for verification of results. A new DDDG measurement site was established and used for a 17-month measurement program (Site 1). An additional site (Site 2) represented the place where pollution flashover of an insulator string has been confirmed. The flashed over string was then removed for pollution measurement (see Fig. 5). Average ESDD was 0.2 mg/cm2 and local maximum along the string was 0.7 mg/cm2.

The meteorological parameters used for calculations of ESDD include temperature (to delete possible snow and ice induced flashovers), precipitation as well as wind speed and direction on an hourly basis. The spatial resolution was 2.5 x 2.5 km. A few improvements were implemented in the calculations using the Ohba Model.
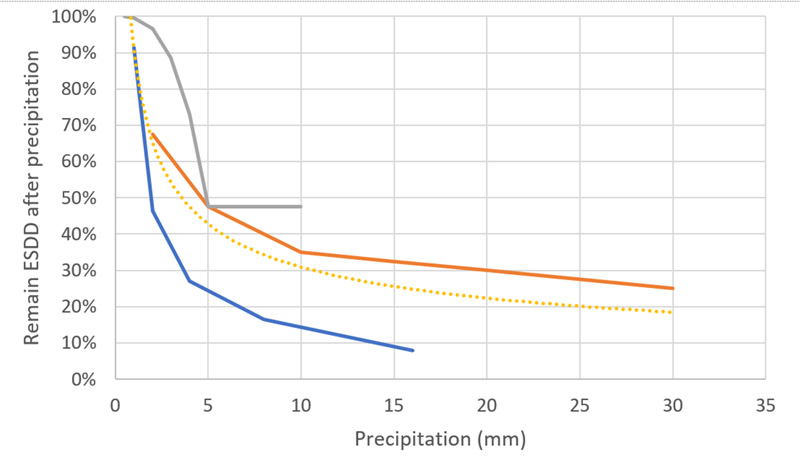
Firstly, based on a search of the literature, a threshold level was established at around 1-2 mm of precipitation, where no cleaning occurs. This small amount of moisture remains on the insulator surface until its dries out with no cleaning effect. For higher amounts of precipitation, cleaning effect increases rapidly. Past published data was used to fit a power function for natural cleaning that describes average remaining ESDD for a given amount of precipitation (see Fig. 6). In addition, the time interval used to determine cleaning and temperature criteria for cleaning to start (i.e. 12 h and minus 3°C) were also included in these calculations.

Further improvement of the Ohba Model included establishment of a new land to sea map, which was essential to increase accuracy of results. The map finally used had a high resolution of 100 m, which is significantly better than the 1 km used in the first calculation (shown in Fig. 3). The new land sea map was able to resolve all coastal areas (this is a complicated fjord type environment) that are larger than 100 m. Fig. 7 shows an example of such a land-sea map.
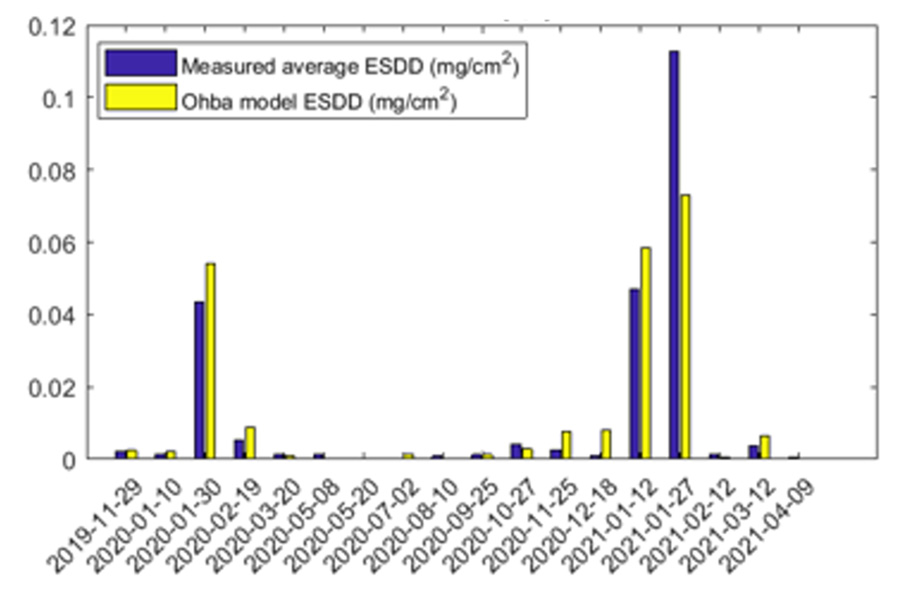
The Ohba Model uses a range of specific parameters, as used during his experiments. These include diameter of sea salt particles (2-5 µm) and diameter of the test tube used for pollution accumulation (0.01-0.04 m). These parameters were optimized using parametric analysis to improve performance of the model. In the end, a combination of particle diameter 3 µm and tube diameter 0.04 m was considered optimal for final calculations. All three improvements, i.e., modified natural cleaning function, a mask with 100 m resolution and optimized salt particle parameters were eventually used in the calculations. Fig. 8 presents results for Site 1. On average, the correlation R2 criterion for Site 1 reached 0.86.
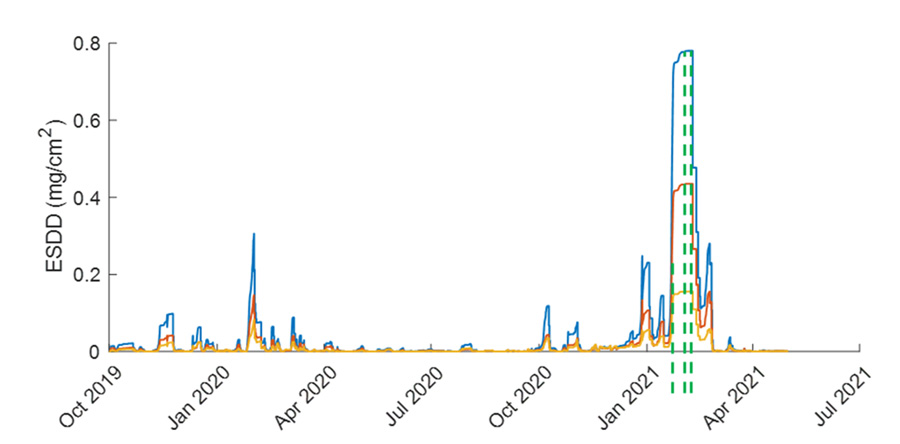
The same parameters were used to calculate ESDD at Site 2 and results are shown in Fig. 9. Time of faults is presented together with time-series ESDD for each of the three towers located closest to the flashover event. In general, the model predicts higher ESDD than the measurements. However, the local maximum ESDD of 0.7 mg/cm2 is close to that predicted by the model, which is considered promising.

Summary
A large volume of field measurements provided data to allow verification of pollution modeling. The Ohba Model, preliminarily considered as most promising for modeling pollution, was further modified and improved. These improvements allowed obtaining a high correlation factor of R2=0.86 between modeling and actual measurements at one coastal site.
The improved Ohba Model was even verified for predicting ESDD locally and with high resolution compared to earth faults observed and direct pollution measurements on available insulators that had flashed over. It is concluded that the model can detect areas where faults occur or are at increased risk of occurring. More work however is needed to obtain a resolution at a single tower level.
A MATLAB script using the modified Ohba Model has been created and is ready to be used as a complementary tool for pollution measurements to determine site pollution severity. This work will help increase reliability of overhead lines operating in coastal areas.
REFERENCES
[1] I. Gutman, C. Ahlholm, K. Halsan, B. Thorsteinsson, M. Radosavljevic, K. Rezaei, K. Varli, W. Vosloo, A. Wagner, R. Wesley: “Development of IEC-Based Methodology for Site Severity Assessment”, 2022 INMR World Congress, Berlin, Germany, 2022
[2] IEC/TS 60815-1: “Selection and dimensioning of high-voltage insulators for polluted conditions – Part 1: Definitions, information and general principles”, Ed. 1.0, 2008-10
[3] IEC/TS 60815-4: “Selection and dimensioning of high-voltage insulators for polluted conditions – Part 1: Definitions, information and general principles”, Ed. 1.0, 2016-10
[4] M. Marzinotto: “Estimating Insulator Contamination from Site Meteorological Parameters”, 2022 INMR World Congress, Berlin, Germany, 2022
[5] M. de Nigris: “Monitoring, Mapping, Modelling & Mitigating Pollution: Application Experience on the Italian Transmission System”, 2022 INMR World Congress, Berlin, Germany, 2022
[6] I. Gutman, C. Ahlholm, K. Halsan, R. Eide, L. Carlshem, W.L. Vosloo, J.-F. Goffinet: “Application of weather models for the evaluation of design ESDD for harsh pollution conditions”, CIGRE Session 2014, Paris, France, 2014, D1-212
[7] Y. Taniguchi, N. Arai, Y. Imano: “Natural Contamination Test of Insulators at Noto Testing Station Near Japan Sea”, IEEE Transactions on PAS, vol. 98, no. 1, p.p. 239-245, 1979
[8] Chisholm, W., Ahlholm, C., Gutman I.: “Dust & Sea Salt Pollution Mapping: Satellite versus Ground Truth Results”, 2019 INMR World Congress, Tucson, USA, 2019
[9] R. Ohba, K. Okabayashi, M. Yamamoto and M. Tsuru: “A Method for Predicting the Content of Sea Salt Particles in the Atmosphere”, Atmospheric Environment, vol. 24A, no. 4, pp. 925-935, 1990