Ageing & Pollution Tests: Tools for Design & Systematic Evaluation

HV/HP Testing

Application of composite insulators at substations has been steadily increasing due to reasons of improved safety as well as their excellent pollution performance, especially at installations with harsh environments. The main concern for these insulators, however, has related to possible premature ageing, potentially impacting long-term performance as well as service life. Over the past decades, many artificial and natural ageing tests and procedures have been developed to enhance knowledge and experience in this regard. In parallel, special artificial pollution laboratory tests have been designed to allow for the hydrophobic surface properties that are essential for good pollution performance.

This edited contribution to INMR by Dr. Jens Seifert of Reinhausen Power Composites reviews the historical development that influenced the standardization process within CIGRE and in IEC. Results with different test methods are also compared with test station experience.  


Background

Technical Brochure No. 142 was the first international document published regarding natural and artificial ageing and pollution testing of polymeric insulators. The challenges were summarized as: “Unfortunately, pollution tests of polymeric insulators in the laboratory present special problems. Such insulators, when new, are difficult to contaminate or wet and surface conditioning, by conventional techniques might not always produce realistic test results. Development of proper pollution test for polymeric insulators is a challenging technical problem. The major difficulty is method of contamination”. Since the hydrophobicity properties (i.e. loss, recovery and transfer) are dominating factors, adjusting to the relevant state can also be problematic.

Other challenges for ageing tests are: “It is necessary to understand the ageing mechanism of polymeric insulators…several types of accelerated ageing tests are currently in use. It must be noted that these test procedures are time consuming and sometimes not possible to perform on full-scale samples”. It is also questionable whether accelerated conditions under more severe test stress properly reflect real natural ageing conditions. Does some scale factor really exist between accelerated ageing tests and actual insulator service life?

Among the main ageing mechanisms for these insulators are:

1. ageing by water penetration (g. polarization of interfaces, hydrolysis);
2. ageing by UV radiation;
3. thermal ageing of the organic material (e. from elevated temperature);
4. impact of abrasion (g. from sandstorms, etc.);
5. corona effects (g. from high electrical field stresses);
6. effect of electrical discharges (g. partial surface discharges).

Most of these ageing mechanisms are reflected by the design tests in IEC 62217, such as the water diffusion test, the UV weathering test and the tracking and erosion test. Additional test developments also consider multiple and/or combined stresses (e.g. UV, thermal, electrical discharges) such as the 2000h and 5000h tests from FGH, ENEL, EDF and EPRI. The impact of high electrical field is presently under review in the revision of IEC 61109.

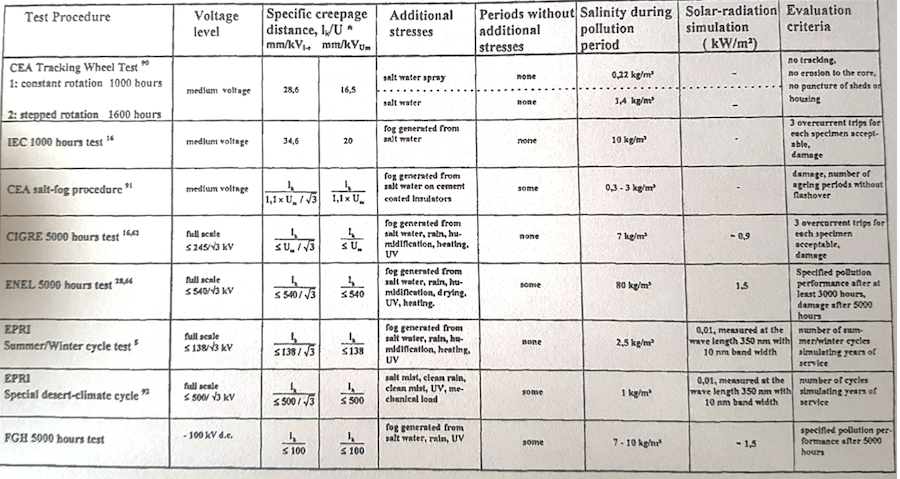
Table 1 summarizes development of testing from the 1970s to the 1990s, indicating test parameters as well as associated evaluation criteria. Some tests were intended to simulate special local climatic conditions or typical environmental situations that were considered as critical to ageing of polymeric materials. In particular, multiple-stress tests are highly complex and designed mainly to evaluate ageing of the housing.

Table 1: Original Test Development Survey

Unfortunately, few comparisons have been made between artificial (i.e. accelerated) laboratory test results and natural long-term ageing results, mostly at natural test stations. Yet such correlations and knowledge of the approximate acceleration factor are essential to assess whether an artificial ageing test is representative. Multiple-stress tests are also time consuming, costly and availability of laboratory facilities to perform them is limited. The 1000h salt fog tracking and erosion test was selected for the main body of IEC 61109:1992 while a modified 5000h test was defined in Annex C as “Ageing Test under Voltage Simulating Weather Conditions”. With establishment of IEC 62217 Ed. 1.0:2005, the 1000h test was defined in the main body while the wheel test and the 5000h multiple-stress test were defined in Annex A and B (both normative at the time).

As such, all three tests were normative and clear separation between ‘Tracking and Erosion’ and ‘Ageing Tests’ was not fully explained to users. During work on IEC 62217 Ed. 2.0:2012, a questionnaire was distributed asking for the preferred tracking and erosion test. The 1000h test was selected by National Committees and it was decided to conserve the wheel and the 5000h test in IEC TR 62730 as reference mostly for special customer requests and specifications. While the wheel test is considered as a ‘tracking and erosion test’, the 5000h test is better characterized as an ageing test. IEC TR 62730 is presently under revision to improve test repeatability by better definition of the spray method (i.e. indirect versus direct). Due to increasing demand from the marketplace, there will need to be consideration as to whether a multiple-stress test can be integrated into the standard as an ‘ageing test’ in addition to the 1000h tracking and erosion ‘design test’ and, if so, how.

Pollution tests for polymeric insulators are needed to establish pollution performance and therefore dimensioning. Among others, the following pollution tests have been studied and evaluated over the past 35 years:

• salt fog tests with defined salinity (in terms of kg/m³ salt fog density);
• clean fog tests with solid pollution layers (in terms of SDD in mg/cm² solid layer salinity);
• both above tests with artificially contaminated insulators;
• clean-fog test with naturally polluted insulators;
• rapid (solid layer) test;
• quick (clean fog) test;
• dust cycle method (DCM);
• dry salt layer method (DSL).

Up to now, relevant standards still do not exist but current work within CIGRE offers reason for optimism that such test standards will be established and representative as well as repeatable test procedures for insulators with hydrophobic surfaces/ hydrophobicity transfer mechanisms (HTM) will soon be defined. In 2021, a group of international experts collected experience across different countries and compiled a survey. Based on this consolidated knowledge, IEC TC36 decided at its Plenary Meeting in June 2021 to start a new project to develop a standard for artificial pollution testing with consideration given to the ‘HTM effect’. It is expected that this work will be completed within 36 to 48 months.

Advertisement

Examples of Ageing & Design Tests

IEC 62217 – 1000h Test

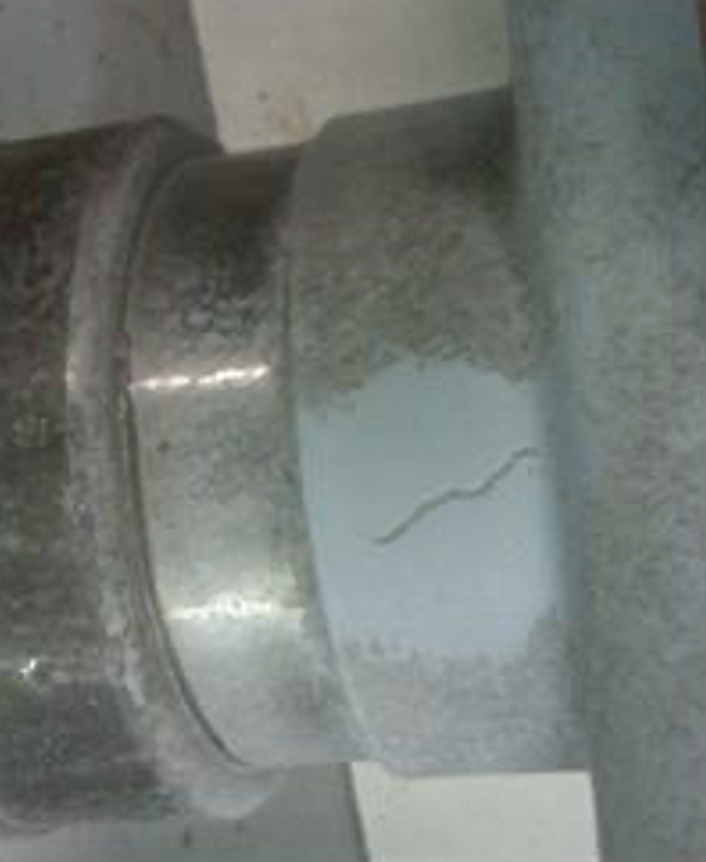
Also known as the 1000h salt fog test, this was developed as a design test and not an ageing test. However, research with different polymeric housing materials at the 20 kV Nordstrand Marine Test Station in Germany found that there was correlation between results of the 1000h test and long-term test station results in regard to tracking and erosion patterns. Today, this test is the standard IEC tracking and erosion design test, considered as representative, repeatable and cost efficient. Hydrophobicity is intentionally suppressed after about 100h and discharges are initiated to provoke tracking and erosion. Such an ageing profile is typical for marine applications with permanent salt fog (e.g. close to coastlines). This test was successfully passed, i.e.:

• no tracking occurred;
• erosion depth (< 3 mm) did not reach the core;
• no shed, housing or interface was

Different shed profiles and dimensions were tested successfully, with both LSR and HTV types of insulators.

Fig. 1: Examples of tracking and erosion (1000h salt fog test) LSR and HTV insulator types.

IEC TR 62730 – 5000h Test                                                                                       

This consists of accelerated weather ageing cycles, combining multiple stresses: humidification, heating to +50°C, rain, simulated radiation and salt fog (based on IEC 62217 Annex B 2005-10 with humidification, heating to +50°C, rain, simulated radiation and salt fog). The test was removed from IEC 62217 in its 2nd edition but conserved in IEC TR 62730 since it was no longer regarded as a design test but rather an ageing test. The test profile was developed to simulate conditions in Italy and France, i.e. with Mediterranean climates of high UV stress, elevated temperatures, natural pollution and vicinity to coastlines. Similar ageing patterns have been found at test stations located in these areas (e.g., Martigues). No scale factor has yet been established between laboratory testing and natural test station experience. While this test is not mandatory for IEC qualification, it is nonetheless used in the specifications of different TSOs in the Middle East, North Africa and Southern Europe.

Insulators have been tested with the following ageing cycle:

Fig. 2: Accelerated weather ageing cycle – daily period.
Fig. 3: Example of test setup (5000h ageing test) LSR type.
Fig. 4: Hydrophobicity test after 5000h ageing test.
Fig. 5: Slight erosion observed after ageing test.

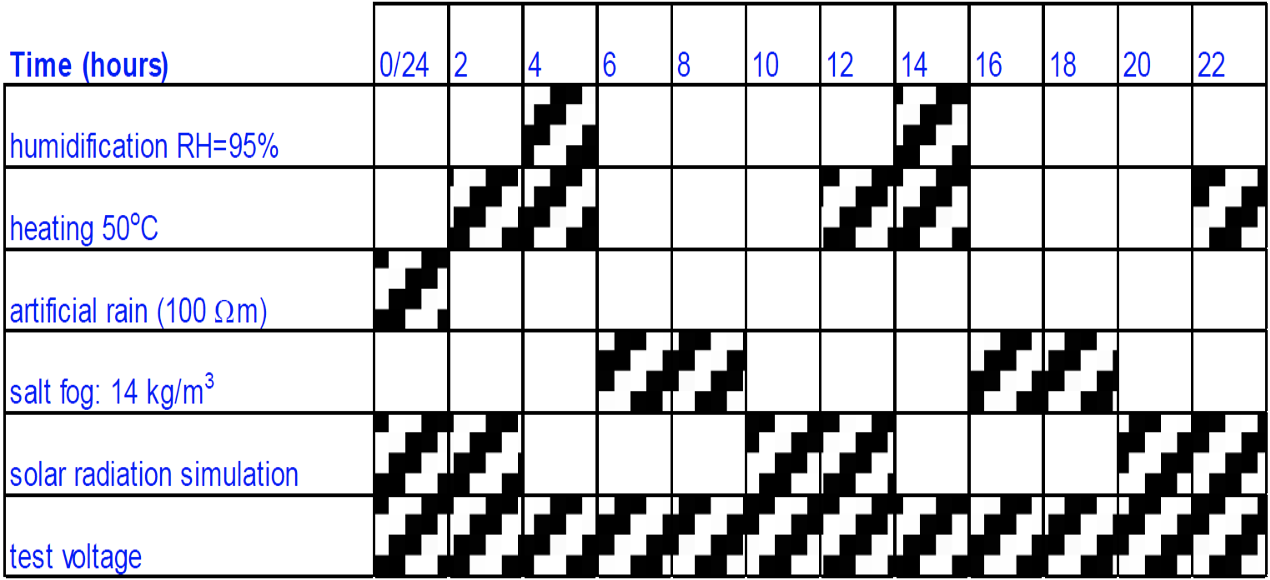
Test insulators (i.e. both solid rod and hollow core types) were visually examined after the 5000h ageing test. The test was successfully passed with the following results, applying to both LSR and HTV types:

• hydrophobicity tests (wettability class WC 2 to WC 4);
• slight erosion (1 mm depth < 3 mm max. criteria);
• No sheds were punctured.

Terna – 2000h Test

This is also considered a multiple-stress ageing test and is performed in accordance with Terna (Italian TSO) specifications. The test shall reflect the specific conditions in of Italy (e.g. severe salt fog pollution along coastlines) and has been performed on full size (1:1) samples. Recently, tests on short samples are also accepted.

Fig. 6: Test set-up (Terna 2000h multiple stress test) on cable termination – HTV type.

Satisfactory results have been observed after 2000h multiple stress testing according Terna specifications for 245 kV cable terminations of both LSR and HTV types, in actual configuration.

Advertisement
 

Pollution Tests: Examples with DC Stress

Solid Layer Method                                                                                                    

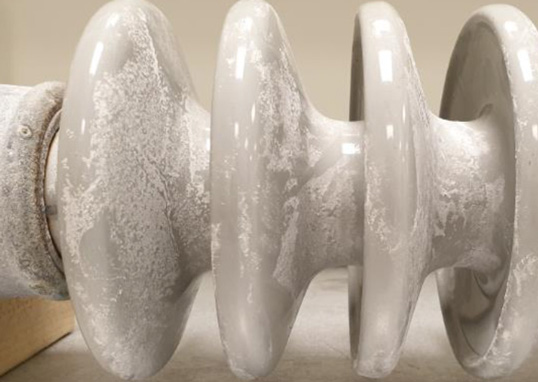
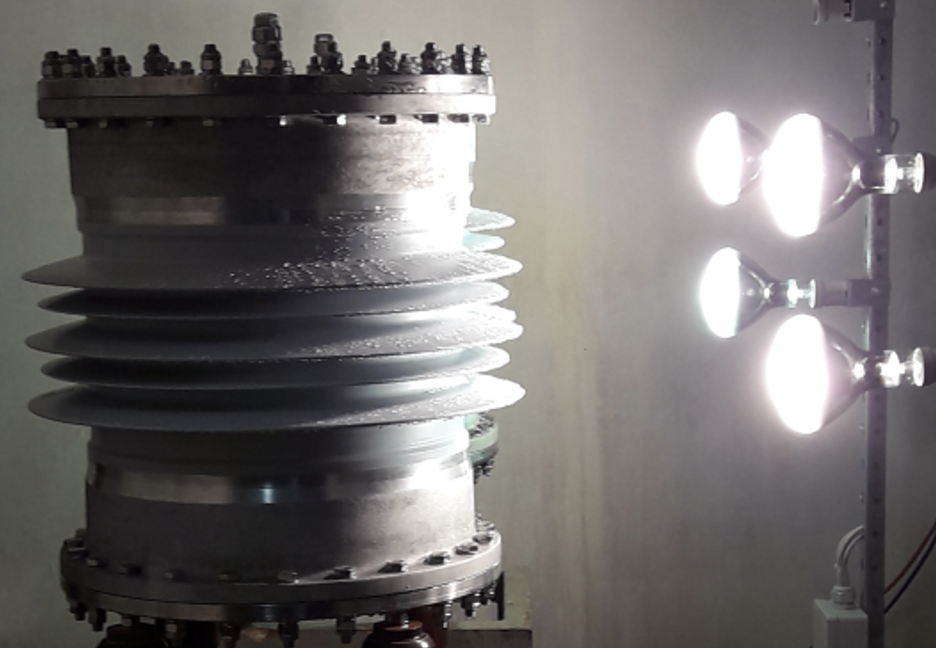
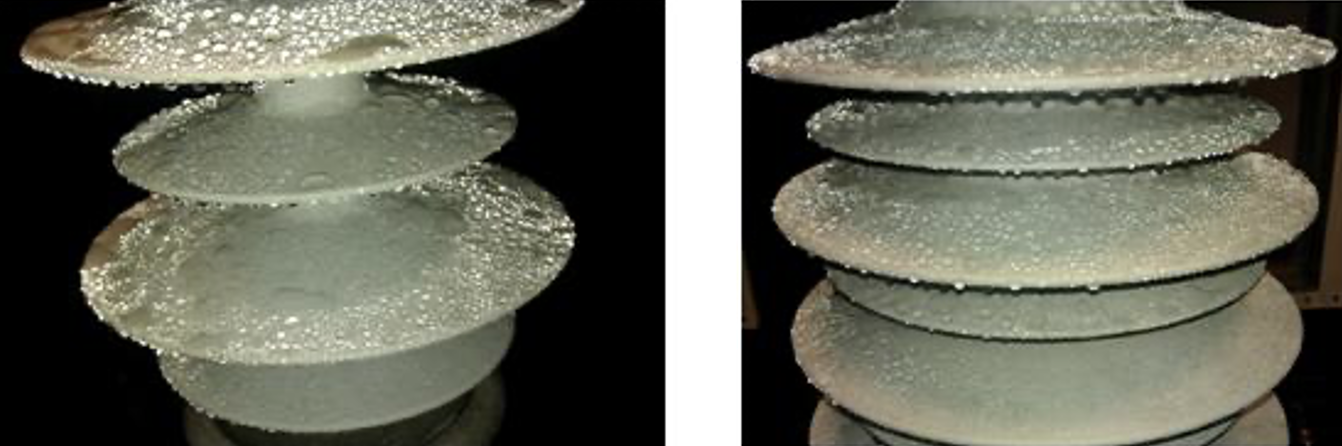
The test object is coated with a uniform dry layer of some defined solid pollution and then energized and humidified. Pre-conditioning of insulators and test procedure were adjusted based on the test method of CIGRE TB 555. To allow pollution of the hydrophobic housing material, a thin layer of dry kaolin powder is applied on the insulator surface before application of the pollution layer. Contamination of the insulator surface is performed with DC voltage according to IEC TS 61245 by a mixture of kaolin, water and sodium chloride. Measurement of pollution is performed according to IEC TS 60815-1. After a defined drying period of 20 to 48h, the polluted test sample is placed in the test chamber and steam fog used for wetting the layer.

During these tests, voltage is applied by the ‘Up & Down’ test method. Therefore, the test object is subjected to an initial voltage for 15 min and voltage is then raised in increments of 10% of test voltage every 1 min until flashover. After flashover, the voltage is re-applied and raised as quickly as possible to 90% of the previously obtained flashover voltage and subsequently increased in steps of 5% of the initial flashover voltage every 3 min until flashover. Voltage is then again raised rapidly to 90% of the most recently obtained flashover voltage, held for 3 min and then increased in steps of 5% every 3 min until flashover. This test is continued for a minimum duration of 100 min and a minimum of 10 flashovers. The key result of this test is the lowest flashover voltage occurring during the Up & Down test method.

Salt Fog Method                                                                                                           

The test object is subjected to some defined ambient salinity. For salt fog tests, no additional preparation or pre-conditioning of the insulator surface is performed.

The test procedure has now been replaced by a modified ‘Up & Down’ method, as per the solid layer method. The test object is subjected to an initial voltage at the reference salinity for 20 min and voltage is then raised in steps of 10% of test voltage every 5 min until flashover. After flashover, voltage is re-applied and raised as quickly as possible to 90% of the previously obtained flashover voltage and thereafter increased in steps of 5% of initial flashover voltage every 5 min until flashover. Then, the voltage is again raised rapidly to 90% of the last obtained flashover voltage, held for 5 min and then increased in steps of 5% every 5 min until flashover. After a standard deviation of <5% of the last 5 flashovers is reached, the test is completed with the result being the mean value of the last 5 flashover voltages.

Test Parameters                                                                                                            

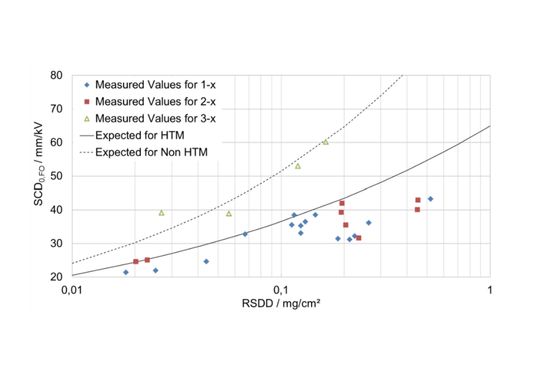
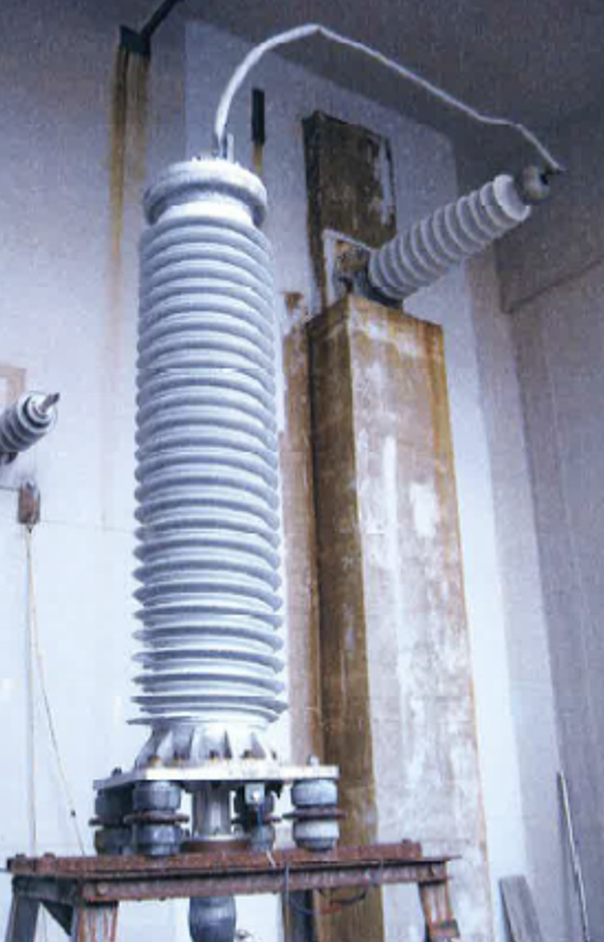
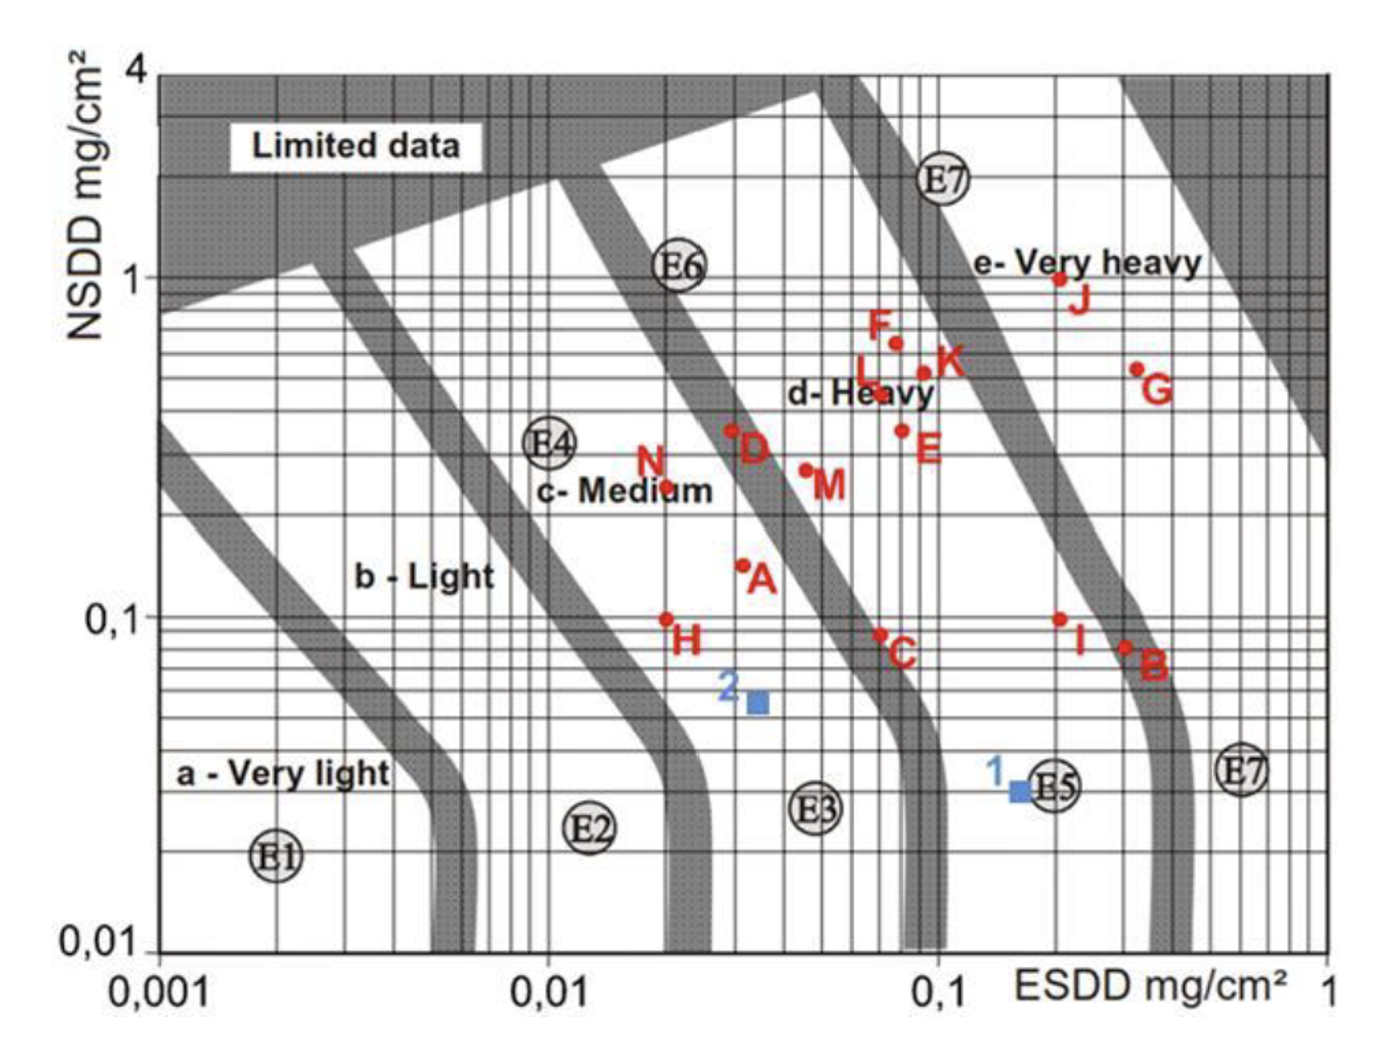
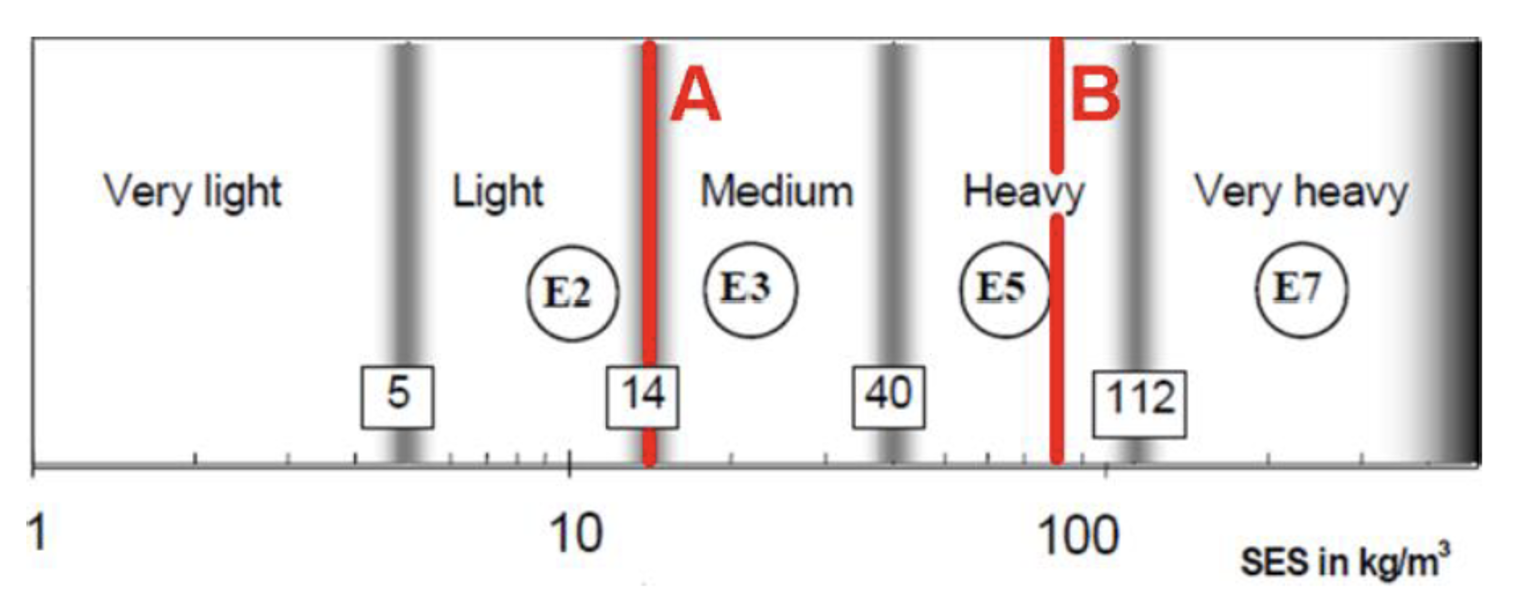
Different insulator designs are tested. All samples are designed with a length of 2 to 3 m and shed profiles are in line with IEC TS 60815-4, e.g. a creepage factor of 4. These can be assigned to three main groups: 1-x, 2-x and 3-x respectively. Within each group, housing material and basic design principles are the same. Tested housing materials are made using HTV silicone and LSR. The second number on the label of each test sample represents the respective sample within the group, the samples may have different diameters, shed overhang, and shed spacing. Figs. 7 and 8 show the pollution layers being tested with their respective ESDD (Equivalent Salt Deposit Density) and NSDD (Non-Soluble Deposit Density) values as well as tested salinity in correlation with the site pollution severity classes according to IEC 60815-1.

Fig. 7: Different artificial (red) and natural (blue) pollution layers used in tests (based on diagram from IEC TS 60815-1).
Fig. 8: Different salinities in tests (based on diagram from IEC TS 60815-1).

Normalizing Test Results                                                                                               

To compare test results obtained on insulators of different dimensions, minimum flashover voltages are converted into specific creepage distances (SCD), which are based on calculation rules of IEC TS 60815-4. This also allows for diameter correction for average diameters (Da) > 250 mm to standard diameter condition. Consequently, the index ‘0’ for applied diameter correction and index ‘FO’ for normalized flashover values are given (i.e. SCD0, FO) using the following equation:

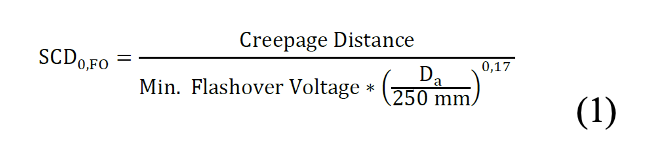
Thus, decreasing flashover voltages result in increasing SCD0, FO values.

Up & Down Test Method Versus Withstand Test

More than 30 tests were performed on composite insulators that showed similar flashover behaviour during artificial pollution tests. Results of the Up & Down and the withstand test methods were close, as shown in Fig. 9. Minimum flashover voltages for the vertical test position were reached after 40 to 70 min, depending on fog distribution, and constant flashover voltage occurred for at least 30 min. This implies a long critical time range, which may be caused by a slow pollution wash-off process.

Fig. 9: Up & Down test sample 1-1 / pollution layer: D.

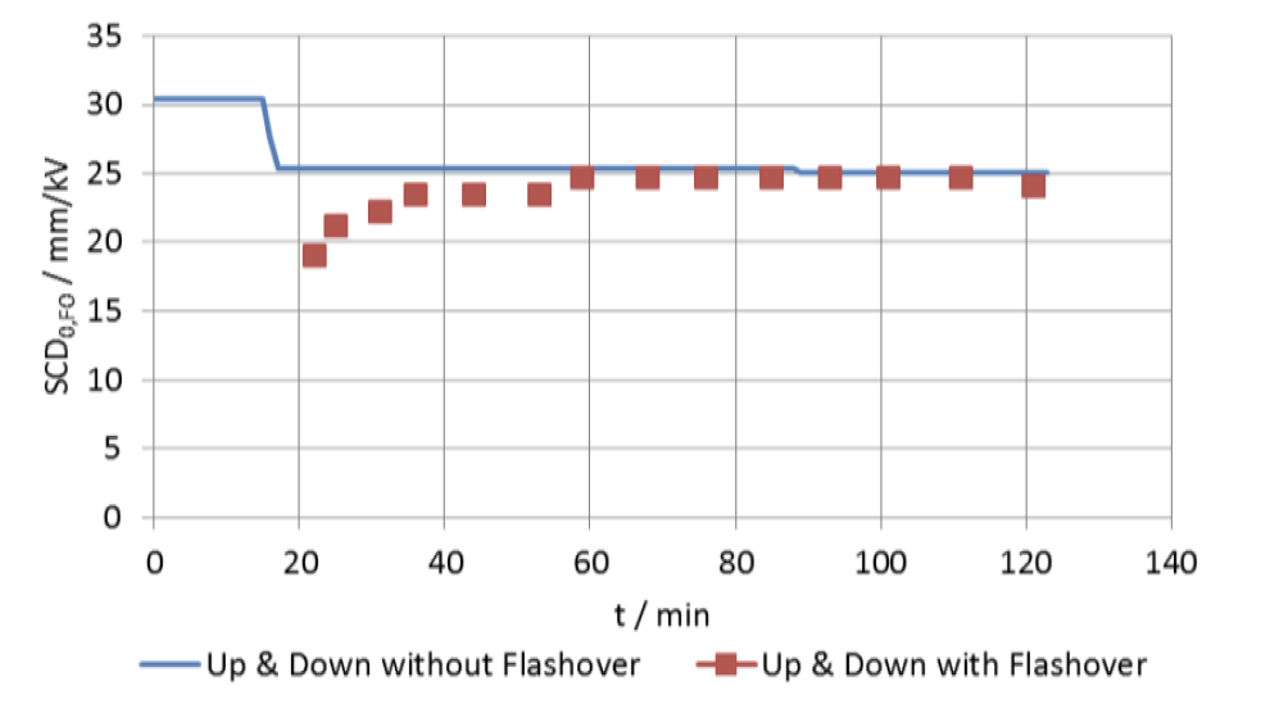
Thus, several flashovers can be obtained during the critical time range during artificial pollution tests on composite hollow core insulator samples. It must be noted that this is only valid for the vertical position. Horizontal insulators showed a faster wash-off process.

Influence of Pollution Severity                                                                                      

Specific creepage distances are chosen according to environmental conditions. Therefore, IEC TS 60815-3, which applies to AC composite insulator designs, defines fixed specific creepage distances (SCD) for 5 different site pollution severity classes (i.e. from very light to very heavy). IEC TS 60815-4 introduces the following equations for calculation of the SCD required of HTM and non-HTM type insulators (see Table 2).

Table 2: Recommended Specific Creepage Distances for Pollution (According IEC TS 60815-4)

The equations in Table 2 consider amount of pollution with reference DC site severity (RSDD) for solid layer tests and for site equivalent salinity (SES) in salt fog tests, respectively. RSDD is defined in equation (2) and known as ESDDDC in IEC TS 60815-4. It is calculated from ESDD and NSDD values and from the diameter correction factor, Cd, as introduced in equation (3).

Solid Layer Tests                                                                                          

Measurements with the Up & Down method clearly show that flashover voltage decreases (or, more precisely, that SCD0, FO increases), with amount of pollution, independent of material. At first glance, test insulators with 1-x and 2-x material seem to offer similar performance, while different shed profiles tested seem to have only minor influence. Only test insulator 3-1 had significantly higher values. Fig. 10 shows expected specific creepage distances for HTM and non-HTM materials, according to the equations in Table 2. The curves are calculated for insulators with average diameters (Da) ≤ 250 mm (Cd=1). Results for the insulators tested are in the range expected for an HTM material. Again, except for test insulator with 3-1, which showed non-HTM performance, measured normalized SCD0, FO values deviated in a range of -1.5% to +40%. Moreover, this deviation was smaller for lower than for higher pollution. The reason could be that discharge processes dominate at lower pollution levels whereas stronger drying processes dominate at higher pollution levels. This results in higher voltage demand across the dry zones.

Fig. 10: Calculated and measured SCD values versus RSDD.

Salt Fog Tests                                                                                                     

Generally, tests show that higher SCDs are required with increasing salinity. However, in contrast to the solid layer method tests, the relationship between expected behaviour and measured SCD0,FO values is not explicit. Expected values according to IEC TS 60815-4 and measured values have high deviation. For higher SES, the calculation rules give an indication and could result in oversizing the insulators. Compared to Fig. 10, where samples 1-x and 2-x perform similarly, in Fig. 11, test samples 1-x seem to perform better, i.e. SCD values are lower.

Fig. 11: Calculated and measured SCD values versus SES.

Such deviation demonstrates that the values in IEC TS 60815-4 for the salt fog method needs further research with regard to laboratory testing. This conclusion is also stated in IEC TS 60815-4 Annex B.2 for pollution type B.

Test Stations

Investigations at Balaruc Substation

To investigate ageing of composite insulators, a circuit breaker equipped with this technology was selected at the Balaruc (225/63 kV) Substation along the Mediterranean coast close to Sète and Montpellier in southern France. The equipment chosen for study was the very first 72.5 kV live tank breaker equipped with HTV silicone extruded shed type hollow composite insulators, manufactured during the early 1990s. This breaker had been installed since 1993 in the French TSO (RTE) network and with only standard maintenance mode, i.e. no periodic insulator cleaning. No major incidents have so far been reported.

Fig. 12: Location of Balaruc Substation. Dark yellow zones indicate heavy saline pollution zones identified by RTE.

As shown in Fig. 12, due to proximity of the sea and the nearby Thau lagoon (with 27 to 40 psu salinity), the site lies in a zone of heavy saline pollution. Balaruc is also sunny, averaging nearly 13 hours per day during summer (see Fig. 13), which generates high UV stress on insulators. Such conditions make Balaruc ideal to investigate ageing behaviour of composite insulators.

Fig. 13: Average daily sun hours per month in Balaruc.

Characterization of Pollution Level

One shed on the breaker’s insulator was cleaned to quantify pollution level by measuring ESDD/NSDD.  This was performed by measuring conductivity of dirty water collected with cottons used to clean the surface, combined with weight and chemical analysis of non-soluble remained pollutants, all according to the procedure presented in IEC/TS 60815-1(2008) Annex C. Level of insulator pollution was determined to be Class D (heavy as per Fig. 14):

Fig. 14: Characterization of pollution level of insulator using Fig. 2 following IEC/TS 60815-1 (2008).

Visual Inspection & Characterization of Hydrophobicity

Inspection was carried out in 2019 on the breaker at the Balaruc Substation (see Fig. 19). During visual inspection, no erosion, no tracking on the silicone sheds of the insulators have been observed. The applied HTV silicone rubber housing shall protect the mechanical load carrying FRP tube from environmental influences (moisture, UV, pollution) and shall supply the required creepage distance for the polluted outdoor conditions.

Fig. 15: Characterization of pollution level of insulators using Fig. 2, following IEC/TS 60815-1 (2008).

A hydrophobicity test was also carried out at the site, according to IEC 62073 (2016-02) Annex D Spray Method. Hydrophobicity was found to still be very good (HC1 to HC3 level), as in Fig. 20 left. Moreover, no major changes were observed compared to similar measurements done in 1996 (see Fig. 15 right).

Fig. 16: Inspection of hydrophobicity of 72.5 kV hollow core composite insulators. measurement in 2019 (left) vs. measurement in 1996 (right).

Investigation by Semi-Destructive Sampling                                                                

For further investigation, one small sample of shed was cut to obtain physical and chemical measurements, including:

• hardness according to ISO 868:2003;
• TGA according to ISO ISO 9924-3:2009;
• angle of water drops according to IEC 62073: 2016 method A;
• density (1.57 g/cm³) according to ISO 2781:2018 method A;
• FTIR (silicone material fingerprint).

Fig. 17: FTIR spectra measurement (typical for HTV with signature ATH = Al(OH)3 around 3500…3000 cm-1).

The goal was to better understand the exceptional long and excellent service experience with these extruded HTV silicone sheds that were first generation material, vulcanized at high temperature. A ‘new’ silicone sample from the same period (i.e. unpolluted and not in-service) was used as reference to perform the Soxhlet analysis and to compare hardness, density, mechanical properties, etc. with the on-site aged sample. A similar comparison was performed on HTV silicone rubber shed samples taken from the Martigues Insulator Test Station. Table 3 compares the new and aged samples taken from Balaruc and Martigues. The purpose of a Soxhlet analysis of sheds is to evaluate the percentage of low molecular weight (LMW) silicone compounds responsible for key hydrophobicity characteristics of a housing, such as loss, recovery and transfer.

Table 3: Material Characteristics in ‘New’ and ‘Aged’ Condition

Decrease in LMW levels over time was only measured on the Balaruc Substation sample. By contrast, the opposite applied to the Martigues sample, with a slight increase in rate with ageing. These measurements demonstrate that silicone material remains effective in terms of hydrophobicity performance (e.g. transfer and recovery) since the LMW level remained close to 1%, even for the Balaruc sample after about 30 years ageing. While for the Martigues sample, an increase in LMW levels with age may seem surprising, this is because this rate is not affected by ageing while the material is being electrically stressed. Field experience with silicones has shown that electrical activity can lead to creation of new low molecular weight chains by cutting the long chains in the polymer matrix. The rate measured on an aged sample is therefore the result of LMW diminution due to transfer into the pollution layer over time counterbalanced by re-generation of these short chains due to cutting of chains in the polymer matrix as a result of electrical activity.

Investigation at Martigues Test Station

For over 50 years, EDF R&D has been carrying out ageing tests and studies of the long-term behaviour of equipment under extreme natural external stresses at its Lab Martigues site close to Marseille (see Fig. 22). The location meets several criteria perfectly suited to this type of study. The region is one of the sunniest in France with over 2800 hours per year, meaning that materials are exposed to high levels of ultraviolet radiation. The test facility is also 10 m from the seashore. Exposure to salt spray is extreme, particularly during south-south-east winds. Huge industrial complexes are in this area as well. For example, the large Lavera petrochemical plant lies only 2 km northwest. The prevailing pattern of winds (i.e. north-northwest) carries its industrial emissions in the direction of the test station. As a result, materials being tested here are subject to combined marine and industrial pollution.

A site pollution assessment was carried out according to IEC 60815-1 Ed. 2008 Annex E using a directional dust deposit gauge (DDDG). These measurements classify the site mainly at level ‘d’ (heavy) and sometimes at level ‘c’ (medium). In real time, the measurement of leakage current on a reference insulator string calibrated in the laboratory allows to evaluate the current pollution level site.

Fig. 18: EDF/RTE Martigues natural ageing test station.
Fig. 19: ESDD measured on insulators with LSR (orange) and HTV (blue) housings (profiles were different). Orange material/profile collects more pollution in terms of ESDD.

Hydrophobicity measurements according to IEC 62073 Annex (2016) show a wide range of values. The most hydrophilic areas are close to the electrical voltage while lowest values are on the ground end side. For the same height, the side facing north-northwest is always least hydrophobic. Depending on rain episodes prior to any measurement (i.e. natural washing), the material regains its hydrophobicity properties and leakage current records show low values on both columns. Fig. 20, for example, shows evolution of leakage flows during one specific pollution event (Class 2 to 3 according to the first edition of IEC 60815-1986). Currents follow each other perfectly and remain particularly low.

Fig. 20: Recorded leakage currents on Samples 1 and 2 and reference insulator during pollution event.

In this case, leakage currents on both samples (i.e. the HTV silicone sample 1 and the LSR sample 2) are significantly lower than on the reference insulator string composed of glass disks with a hydrophilic surface. Hydrophobicity and the related transfer mechanism to pollution layers (HTM) suppresses leakage current by a factor of almost 10 compared to the reference insulator. To date, no flashovers have been recorded on these two test objects. The two columns (samples 1 and 2) are maintained in tests at EDF’s R&D site under these same conditions.

Table 4: Design Parameters for Test Station Insulators & Samples for Ageing Tests

The respective diameter correction, performed in accordance with IEC 60185-3, considers potential temporary loss of HTM. Note: The LSR insulator was shortened in order to adapt the specific creepage distance (SCD) to the HTV sample for better comparison. In addition, the material properties in Table 4 were investigated for comparison between their ‘New’ and ‘Aged’ condition.

Advertisement

Pollution Design Tool

A model based on statistical design was derived from the solid layer and salt fog tests for AC and DC voltage stresses using the pollution performance curve. Fig. 21 shows the tool for DC voltage stress and a similar one is available for AC voltage stress. The pollution performance curve is the ‘strength curve’ obtained from pollution testing (i.e. with a minimum of 3 support points at different ESDD levels (‘low’-‘medium’-‘high). This is co-ordinated against the ‘stress curve’ which is given in terms of maximum ESDD-2% and number of pollution events with mean time to failure (MTTF) as a variable. The philosophy is similar to that applied for co-ordination of insulation strength against overvoltages (IEC 60071-1).

Fig. 21: Design Tool based on pollution performance curve and statistical coordination (strength vs. stress).

Inputs:     
• AC or DC voltage stress (pollution withstand voltages);
• number of pollution events per year;
• ESDD-2% (only 2% of pollution events exceed this maximum level);
• Scatter;
• average insulator diameter;
• creepage factor (CF) of shed profile;
• MTTF;
• number of parallel insulators.

Outputs:   
• insulation length required;
• corrected creepage distance.

Ageing Scores

A pollution map for Italy was completed in the 80’s in terms of site equivalent salinity (SES) and divided into 5 colors, each with its own SES range. Fig. 22 shows this map and its reported five SES ranges. Attention is specifically focused on CTs installed in the red and blue areas, considering that the higher the level of contamination on their insulator surfaces, the greater will be their ageing. Consequently, the larger will be any insulator degradation over any given time interval. It is noteworthy that this assumption is not always valid since polymeric insulators installed in light contamination areas sometimes experience large degradation effects. This is particularly the case in areas where, even if contamination is not high, average daily relative humidity is high over the year (e.g. as in reclaimed marshes and swamps).

With the goal of having a minimum of data to obtain a statistical approach to the problem, 3 stations in red areas and 3 stations in blue areas were selected (see Fig. 22). In each area, the three stations were selected so as to have insulators with different numbers of years of service, i.e. from 2010, 2013 and 2016 for those insulators selected in red areas and from 2009, 2012 and 2017 for the insulators selected in blue areas.

Fig. 22: Pollution map of Italy.

To focus on possible material ageing, specific tests were performed on properly sampled insulator slabs. In order to conduct non-destructive sampling, the last 10 cm of insulator weathersheds on the earth side was cut without incurring significant reduction in creepage length. Such sampling was applied to CTs on each phase of the selected bay. This allowed obtaining from each test a statistic on three samplings for each selected station. Consequently, for each contamination range (i.e. red and blue) and for each time in service, three samplings were available with a total of 18 samplings (9 in red areas and 9 in blue areas). Each specimen (a sampling) will provide sufficient material to perform different chemical and physical tests. These tests have been selected to find a correlation between some chemical-physical characteristic and ageing. In particular, the tests selected include:

• infrared spectrum analysis (IR);
• thermogravimetric Analysis (TGA);
• differential Scanning Calorimetry (DSC);
• density Mass Measurement (DMM);
• Soxhlet Extraction Analysis (SEA);
• Shore A measurement;
• elongation to break measurement.

The output of each test will be compared with the output of the same test performed on virgin unaged material. If the difference between the output of a field-aged specimen and the virgin material is deemed reasonable, the corresponding physical-chemical characteristic will become eligible as a tool to assess material ageing. If there is no correlation between the selected physical-chemical characteristic and ageing, such characteristic will not be considered suitable. A proper physical-chemical characteristic can therefore be considered valuable to infer an ageing process if it is both eligible and suitable, as defined above. In the next step, a change in such characteristics will be used to assess ageing by means of ‘ageing scores’.

Conclusions

1. A review of the historical development of artificial and natural ageing and pollution tests over the last 30 years was performed.
2. Establishment of IEC standards based on these developments were explained and the recently implemented design tests were justified.
3. Application examples of different artificial ageing and pollution tests were given, and typical results were shared for state-of-the-art hollow core composite insulators with HTV silicone rubber and LSR housings.
4. Methodology of artificial pollution tests for HCI at DC voltage stress was explained. Solid layer and salt fog method was applied based on CIGRE TB 555.
5. A design tool based on statistical method was derived from pollution test results and can be applied for effective and economic insulator designs in regard to creepage distance and length.
6. The important role of natural ageing test stations was highlighted to reflect real long-term multiple-stress conditions and compare these with artificial test results. Very good experience for more than 30 years in a substation and more than 10 years in Martigues Test Station were reported. Both stations have very severe pollution and multiple-stress conditions.
7. Systematic long-term evaluations of vital parameters, e.g., hydrophobicity status, suppression of leakage currents and housing soundness were performed to assess state of ageing.
8. Future assessments by means of ‘ageing scores’ using different fingerprinting methods such as infrared spectrum analysis (IR), thermogravimetric analysis (TGA), differential scanning calorimetry (DSC), density mass measurement (DMM), Soxhlet extraction analysis (SEA), Shore A and elongation to break measurements will be studied in the next phase of R&D in co-operation with power utilities.

References
[1] CIGRE TF 33.04.07; Natural and Artificial Ageing and Pollution Testing of Polymeric Insulators, Technical Brochure No. 142, June 1999.
[2] IEC 62217; Polymeric Insulators for Indoor and Outdoor Use with Nominal Voltage >1000V – General Definitions, Test Methods and Acceptance Criteria, Editions 2005, 2012
[3] IEC 61109; Composite Insulators for A.C. Overhead Lines with ah a Nominal Voltage Greater Than 1000 V – Definitions, Test Methods and Acceptance Criteria, Editions 1992, 2008.
[4] DKE AK 451.02; Betriebserfahrungen und Unter-suchungen an Kunststoff-Isolatoren in einer 20 kV-Leitung auf der Insel Nordstrand (only in German), ETZ-Report No. 30, VDE-Verlag 1998.
[5] CIGRE WG C4.303, Technical Brochure No. 555; Artificial Pollution Test for Polymer Insulators – Results of Round Robin Test, October 2013.
[6] I. Gutman, P. Cardano, A. Dernfalk, J.-M. George, T. Hayashi, K. Kondo, J. Lachman, S. Li, X. Liang, E. Moal, A. Pigini, J. Seifert, E. Solomonik, W. Vosloo, D. Windmar; “State-of-the-art of Pollution Test Procedures for Insulators with Hydrophobicity Transfer Materials”, CIGRE Science & Engineering, N. 21, June 2021, p.p. 141-169.
[7] IEC PT 63414; Artificial pollution tests on high-voltage insulators made of hydrophobicity transfer materials to be used on a.c. and d.c. systems
[8] G. Roccetti, J.M. Seifert, N.M. Nguyen, C. Pons; Experience of Composite Insulators on HV Substations: Some French Examples, Paper ID-843, CIGRE 2022, Paris.
[9] M. Marzinotto, G. Campopiano, G. Pelliccione, E. Moal, G. Rocchetti, J. Seifert; A campaign for the ageing evaluation of station hollow core composite insulators after a number of years of service, Paper A3-207, CIGRE 2020.
[10] IEC 61245; Artificial pollution tests on high-voltage ceramic and glass insulators to be used on d.c. systems.
[11] IEC TS 60815-1:2008, Selection and dimensioning of high-voltage insulators intended for use in polluted conditions – Part 1: Definitions, information, and general principles
[12] IEC TS 60815-3:2008, Selection and dimensioning of high-voltage insulators intended for use in polluted conditions – Part 3: Polymer insulators for a.c. systems
[13] IEC TS 60815-4:2016, Selection and dimensioning of high-voltage insulators intended for use in polluted conditions – Part 4: Insulators for d.c. systems
[14] E. Moal, V. Bergmann, A. Soergel; “Technical Design Requirements for Composite Hollow Core Insulators Regarding Pollution Performance under AC & DC”, Proceedings of the 2017 INMR World Congress, Barcelona, November 5-8, 2017
[15] G. Roccetti, J.M. Seifert, N.M. Nguyen, C. Pons, E. Moal; Experience with Composite Insulators on HV Subtstations – Some French Examples, CIGRE 2022, Paper A4-848, Paris, France.
[16] Hillborg H., Gedde U. W., Hydrophobicity changes insilicone rubbers. IEEE Transactions on Dielectrics and Electrical Insulation, No. 6:703-717, 1999
[17] I. Gutman, W. Vosloo, J.M. Seifert; Dimensioning of DC composite insulators for polluted area: case study for recent CIGRE/IEC approach, ISH 2010, Seoul, South Korea.

[inline_ad_block]

FEATURED SUPPLIER:

More about Avient

INMR LABORATORY GUIDE


More about Mechanical Tests