A transformer relies on electromagnetic induction through coils to transfer electric energy between two or more circuits. Varying current in the transformer’s primary winding creates varying magnetic flux in the core, which produces varying electromotive force (EMF) or voltage in the secondary winding. Accurately and efficiently predicting currents and voltages on the primary and secondary windings can be challenging, especially for cores with non-linear material properties.
Fortunately, numerical modelling techniques such as the Finite Element Method (FEM) enable analysis of key phenomena inside and exterior to a transformer, including currents and voltages in the windings, magnetic saturation of materials, heat generation by the coils and transformer core losses. This edited past contribution to INMR by R&D specialists at INTEGRATED Engineering Software presented simulation results for three widely used types of transformers. Results were obtained using IES’s Oersted and Magneto 2-D programs as well as its Faraday and Amperes 3-D programs.

Applications & Discussion
Two-D and 3-D simulations were performed on three different types of transformers using a personal computer with Intel(R) Core™ i7-4930 CPU @ 3.40 GHz and 64 GB RAM.
1. Single-Phase Transformer
The first application involved a simple, one-phase 120V/12V transformer with M19 silicon steel, non-linear material core and operated at 60 Hz.
Fig. 2 shows the geometric models in 2-D and 3-D.
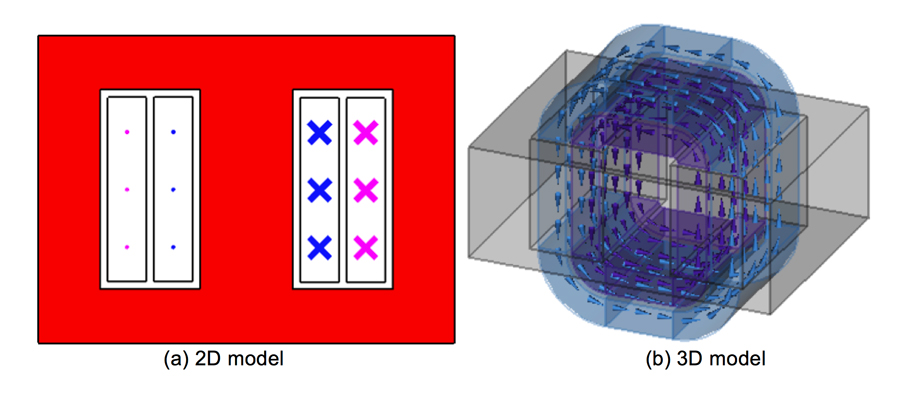

Fig. 3 plots the currents on input and output ports versus time for a transient input voltage source: V(t) =120sin(ωt)(V).
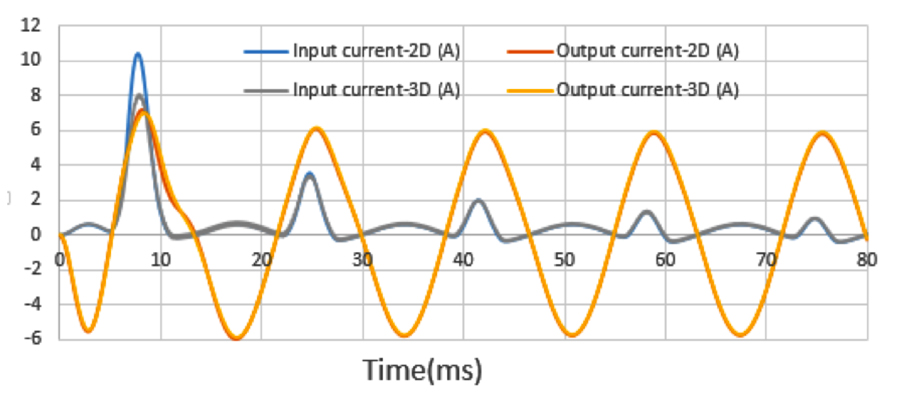
As seen in Fig. 3, inrush currents on the primary coil obtained by the 2-D and 3-D methods are similar, except for the first peak. Fig. 4 plots magnetic flux density of the inrush currents inside the core in both 2-D and 3-D at the second peak, t= 0.025s.

Transformer inrush currents are high-magnitude currents generated when transformer cores are driven to saturation during energization. These currents have undesirable effects, including potential damage or loss-of-life to the transformer and reduced power quality for the system. Therefore, prediction of inrush current is an important issue in transformer design. Transient simulation offers an effective approach to analyse inrush currents. Running time of the 2-D model with 13,667 triangular elements and 27,350 unknowns is only 41 min and 8s. Running time of the 3-D model with 89,291 tetrahedral elements and 104,111 unknowns is 2 h and 33 min.

2. Step-up Autotransformer
An autotransformer is a special design with only one winding and where portions of this winding serve as both the primary and secondary sides of the transformer. Their biggest advantage is reduction in size, weight and cost compared to a general isolated transformer. Table 2 contains the specification of a 105V/120V 250W step-up autotransformer at 60 Hz operating frequency with M19 silicon steel, non-linear material core (see Ref. 5).

Fig. 5 shows the geometric models in 2-D and 3-D.
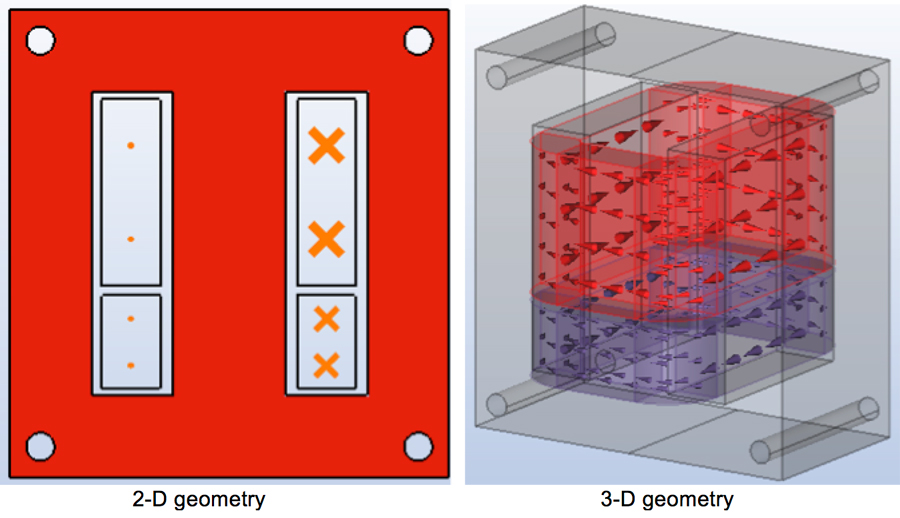
Table 3 lists results for the harmonic case in 2-D and 3-D.

Fig. 6 plots input and output currents vs. time for a transient input voltage source: V(t) =105sin(ωt)(V).

As seen in Fig. 6, simulation results from 2-D and 3-D codes are similar in the late-time period, except for the first peak. Inrush current on the input port in 2-D is more than twice that of ordinary input current. Magnetic flux density inside the core at the first peak, 0.0071s, is from the inrush currents shown in Fig. 7.
Running time of the 2-D model with 14,649 triangular elements and 29,334 unknowns is only 23 min and 2s. Running time of the 3-D model with 89,291 tetrahedral elements and 53,826 unknowns is 1h, 3 min and 38s.

3. Three-Phase, Three-Limb, Delta-to-Star Transformer
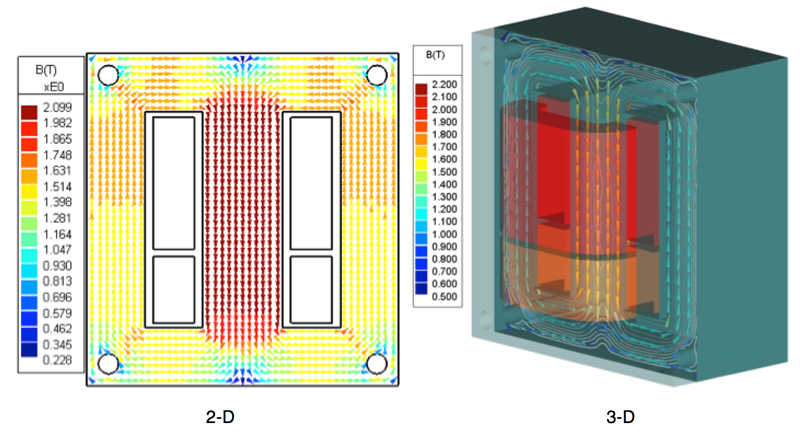
The final example considers an 11kV/110kV three-phase three-limb delta-to-star transformer, as used in most power systems. Table 4 outlines the specification of the transformer (see Ref. 6). Compared with previous examples, this transformer has large size.
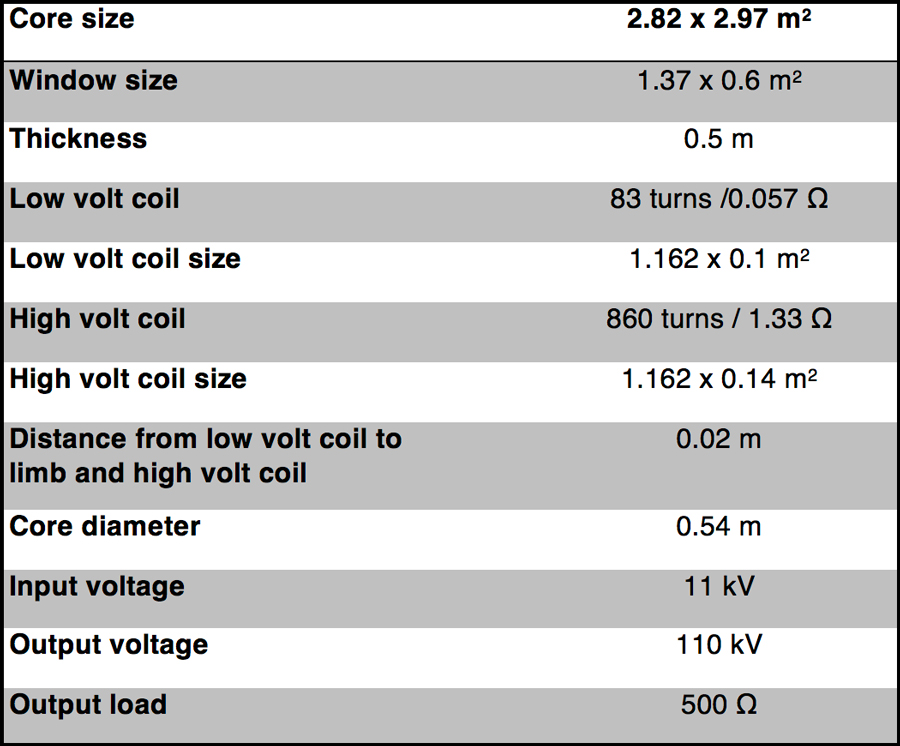
Fig. 8a and b show geometric models in 2-D and 3-D.

Table 5 lists results at harmonic case, as simulated with Oersted (2-D) and Faraday (3-D).
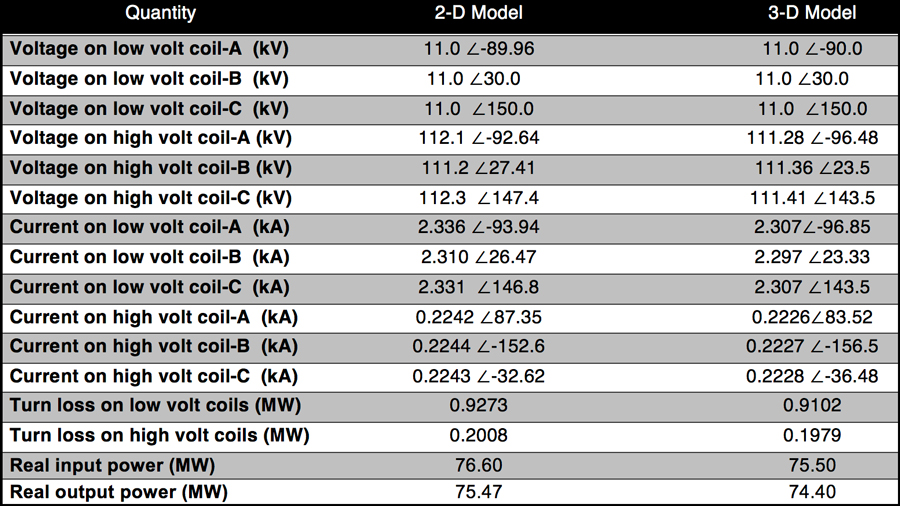
Fig. 9 plots currents on the input port vs. time steps for a transient input voltage source on the low voltage winding:
![]()

Fig. 10 uses the 2-D model on three phases to plot currents on the input port vs. time steps for an unbalanced load (500, 525 550) Ω and (∞, 500 500) Ω (opened on the first phase).

Conclusions
Simulations performed in 2-D and 3-D confirm that using the FEM method provides a quick, efficient, and reliable way to analyse different types of transformers. The method can catch the peaks of inrush currents and allow engineers to better understand the phenomenon of ‘over-saturation’ in a transformer. Thermal distributions within the transformer and supporting structures can subsequently be calculated based on the losses determined by the FEM electromagnetic solution. These losses would become the input for an FEM thermal solution.