When designing transmission lines, the overriding criterion has typically been mechanical performance since, if a design does not perform mechanically, electrical design becomes irrelevant. These days, however, mechanical design of transmission lines is robust due to improved structures, conductors, hardware and insulators. As such, line designers must focus rather on optimizing electrical performance. This requires better understanding how hardware, insulators and geometry can impact a transmission assembly. E-field modeling helps in this regard for many applications.
This edited contribution to INMR by experts at MacLean Power Systems focused on its value in regard to high voltage transmission assemblies.
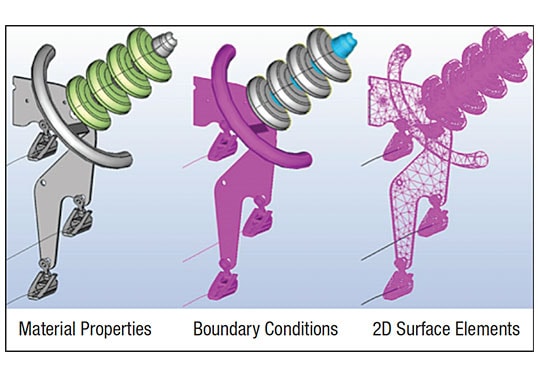
E-field modeling is accomplished using computer aided engineering (CAE) software capable of calculating electric field intensity of given objects. An appropriately configured computer with the necessary power is also necessary. Many versions of software can be used, each with strengths and preferred uses, including Coulomb, Maxwell 3D, Comsol and Flux 3D. MacLean Power Systems (MPS) uses Integrated Engineering Software’s (IES) Coulomb software package for modeling based on the Boundary Element Method (BEM) to solve models. BEM – a tool for analyzing boundary value problems for partial differential equations – denotes any method for approximate numerical solution of boundary integral equations. The approximate solution obtained by BEM has the distinguishing feature that it is an exact solution of the differential equation in the domain by means of a finite set of parameters residing on the boundary. Models used for BEM calculations have the advantage of only 2D surface elements that are the interface regions of different materials or surfaces with boundary conditions. This greatly simplifies modeling and results are more accurate due to the smoothness of the integral operator. Moreover, analysis of unbounded structures can be solved by BEM with minimal effort since exterior field is calculated the same way as interior field. This software is a powerful tool for verifying electrical performance as it pertains to corona and corona inception as well as voltage stress on an insulator surface.
Assembly models are first designed using SolidWorks software based on customer specifications. An E-field modeling worksheet, completed by the customer, consolidates information from drawings, specifications and acceptance criteria into one document. After all this information is attained, the model can be created, making sure to keep complex details to a minimum and instead focusing on high stress areas that increase simulation solve time. Next, the model is imported to the Coulomb simulation software and boundary conditions are assigned. Insulation medium is defined on insulator volumes (glass, polymer or porcelain). Voltages are assigned to hardware, e.g. single-phase voltage (VSP) is used most often. Hardware in contact with the conductor is assigned the VSP while the tower and ground are assigned 0V. Conductive components not directly in contact with either conductor or tower are assigned a floating voltage that is calculated during simulation. To confirm assembly design, the simulated voltage is 15% higher than nominal service voltage. After all components are assigned a voltage or boundary condition, the software generates a mesh such that he finer the mesh elements, i.e. triangles, the more detailed the output (see Fig. 1). Then, the simulation is started and temporary file size determined. The mesh and temporary file are both used for internal calculations. Temporary file size is relatively large (MB–GB range). The larger the file size, the longer the simulation runtime; solution runtime can range from as little as 10 min to over 24 h.

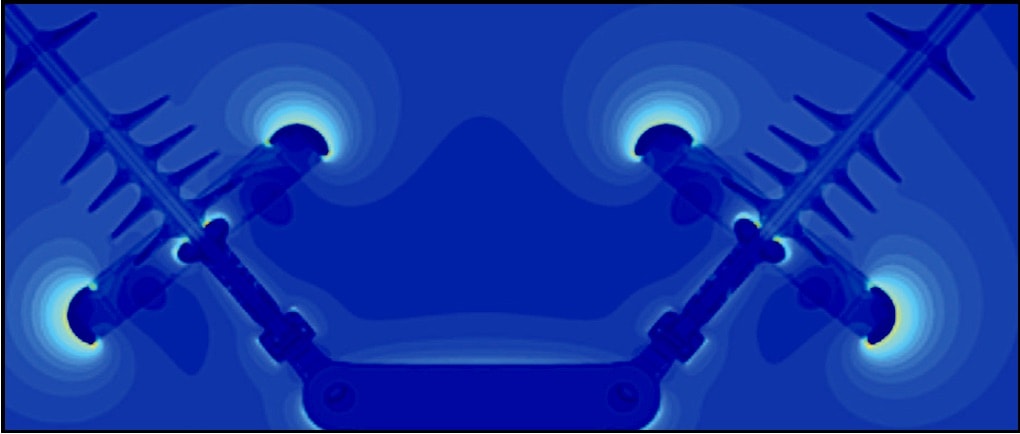
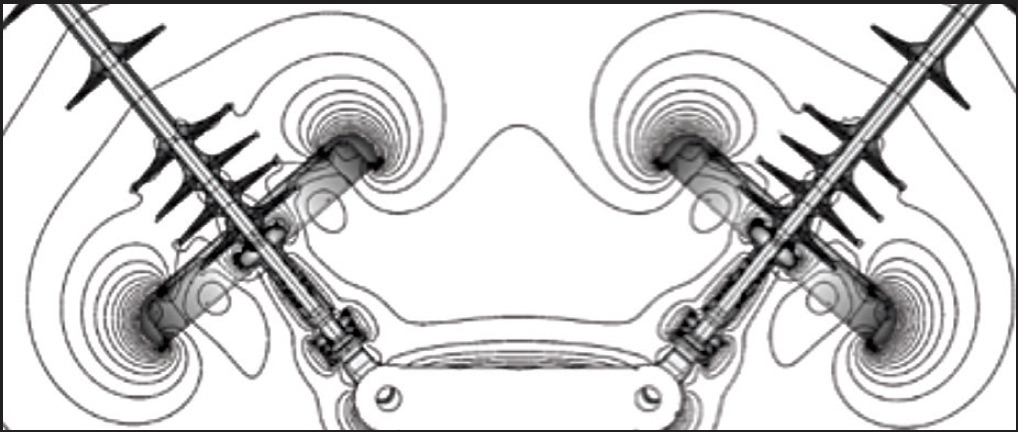
Once the simulation is complete, an E-field plot is made for the entire model and stress points are identified through visual inspection. The most common is the contour plot (see Fig. 2) but isosurfaces and equipotential plots (as in Fig. 3) are also used for more complex assemblies. For multiphase assemblies, streamlines allow seeing how electric fields move between phases. Additional E-field plots are then created in the areas where higher electrical stresses are observed. All E-field plots are examined to confirm validity and not just a singularity of the simulation. Resulting E-field plots are reviewed and compared with acceptable criteria provided by the customer. A summary of results is provided that includes description of the simulation procedure and list of input data and assumptions.
E-field modeling can determine corona inception values on transmission assemblies. Corona causes RIV and electromagnetic interference that results in line losses and can also lead to premature degradation of polymeric insulators exposed to excessive voltage stress (e.g. the EPRI guideline is 0.42kV/mm ->10mm). These types of insulators can lose hydrophobicity and be more susceptible to premature ageing with shortened life expectancy. Newer compact line designs utilizing polymeric insulators allow designers greater flexibility but also can create more concentrated field stresses on insulators that need to be understood. Given that use of polymeric insulators has grown and transmission right of ways have meant more compact lines, corona has become a growing concern. Excessive electrical field stress on ceramic strings also needs to be considered. For example, disks located at the line end of the string are more likely to require replacement. Pin corrosion, radial cracking and ageing at the cement interface all shorten service life and impact life-cycle cost of a line.
The accepted practice for determining corona concerns used to mean testing in a high voltage laboratory but now there is a method that does not require this to verify corona levels. Laboratory testing was once the only way to determine corona inception or RIV levels and IEC 61284, NEMA Std. 107-92 and IEEE 1829 all provide standardized testing parameters for RIV and corona inception of string assemblies used in transmission. These standards do not dictate corona extinction values or minimum acceptable RIV levels but rather are used to define test methodology, equipment and procedures. Typically, an elevated test voltage of 110% to 135% of the rated line to ground voltage is applied. Testing requires a full-size assembly of a single phase to be constructed. The number of HV laboratories of suitable size and with the necessary measuring equipment are limited and there is also a time element to get materials from multiple locations and to schedule laboratory and witnessing. This takes time to manufacture and to secure availability of an appropriately sized facility – both of which are often in short supply and have great expense. Depending on assembly size and complexity, a single test can take up to two days. If the design does not meet acceptable criteria for corona inception or RIV level, the assembly has to be modified and re-tested.

Standards recognizing limitations of testing EHV assemblies with shortened ground clearance have added procedures for use of the calibration method. Here, applied test voltage and distance to ground plane are selected so that localized electric fields of the laboratory set are energized to a voltage stress equivalent to the service condition. Usually, E-field voltage is based on surface gradient of a sub-conductor mid-span at maximum operating voltage. Calibration methods are detailed in IEC 61284 and CSA C411.4-98. Test voltage is set using a calibrating bead on the AL tube used as conductor in the laboratory. 2D or 3D calculations can also be used to match surface gradient on test conductor to a pre-determined service condition.
Exploring the electrical performance of alternate designs requires testing each variation in the laboratory, which means additional time, material and expense. Moreover, will a single-phase model accurately reflect performance of a three-phase assembly in the field? Recent studies by the Bonneville Power Administration in northwest U.S., for example, determined that a laboratory environment does not always replicate field stresses of a three-phase assembly by using a single-phase source voltage. This work showed that adding a factor on the applied phase-to-ground exceeded actual field stresses by as much as 14%. This could lead to false positives of corona inception causing the addition of supplementary grading protection (e.g. larger shields, sphere nuts, etc.) that can increase installation time and make future energized maintenance more difficult.
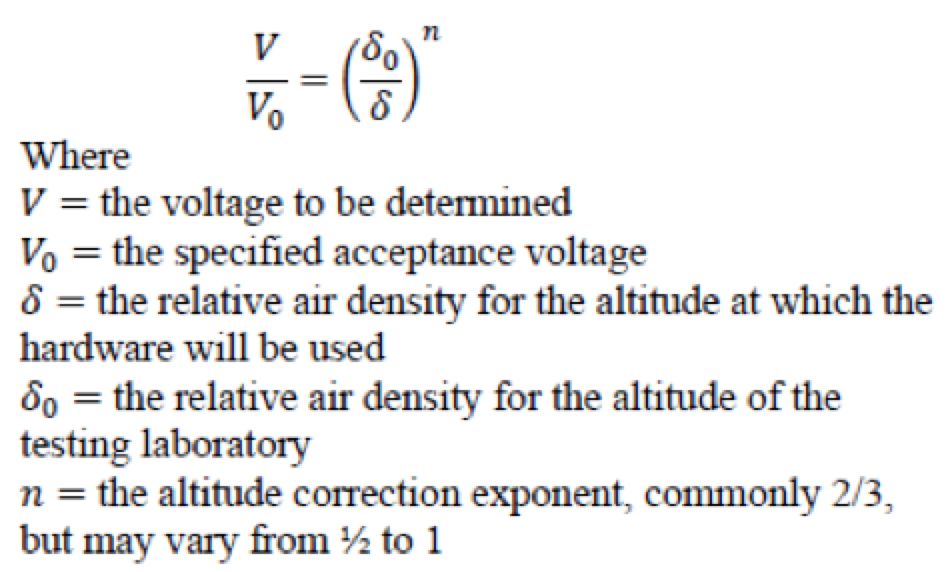
E-field modeling provides a solution to all these shortcomings in a fraction of the time and at a fraction of the cost. It also allows for additional benefits. First, E-field modeling can be used to create complete three-phase models of the entire transmission structure. With this capability, models can be solved that replicate actual field conditions and avoid inaccuracies that could result in testing at laboratories that does not match actual field conditions. As noted, E-field streamlines for three-phase models can be generated that show how each phase of the assembly impacts E-fields of adjacent phases – a result that cannot be replicated by laboratory testing. Second, E-field modeling software can account for actual field conditions that include temperature, pressure, humidity and, most importantly, altitude. The altitude correction formula commonly used is:
With E-field modeling, the designer has the ability to evaluate assemblies without building full-scale models and sending these to a test laboratory. Design changes can simply be imported into the simulation software and solved for the desirable electrical performance criteria. Designers can evaluate their assemblies before sending it to the field for construction without the need for laboratory testing. Considering tight construction timelines as well as design changes or improvements to existing transmission lines, E-field modeling provides an excellent solution.

Improving Transmission Line Performance
E-field modeling allows designers tremendous flexibility in developing transmission assembly designs because it allows them to model the assemblies in 3D. Aspects of insulators and hardware assemblies can be adjusted and tested to validate electric field intensity and whether corona will occur by utilizing these design tools to optimize corona/RIV performance. Corona discharge and RIV create line losses that reduce efficiency of a line. Factors previously unable to be considered in design can now be simulated. For example, designers are able to modify geometry, placement and size of grading devices. Instead of using 1.5 inch tubing for a grading ring, an option of 2 in tubing could be incorporated into a grading shield by simply modifying the original geometry or shape. Furthermore, is a grading device even required? With E-field modeling, a definitive result can be provided that confirms adequacy of a design for grading protection. Proper control of E-field stresses on insulators extends service life improving life-cycle cost of ownership. E-field modeling can also be used to adjust shed placement and size on a polymeric insulator. Changes of this nature can be verified by simulation software before an insulator is manufactured, thereby offering time saving and verifiable performance. Simulating different component and hardware variations allows designers more flexibility and certainty of performance. The end result is improved transmission line performance.
Case Study
To illustrate use of E-field modeling, here are examples where E-field simulations were used to optimize design and solve existing issues that led to superior electrical performance. A utility in the eastern U.S. was re-conductoring and reinsulating a 345 kV transmission line on existing structures with tight clearances. The decision was made to re-insulate with polymeric insulators. The utility was concerned with possible stresses that would be placed upon sheath of these insulators. The particular tower arrangement that caused the most concern was for an angle assembly with the conductor position pulled toward the structure. Modeling was used to simulate the E-field stresses along the insulator sheath. The model showed that the original design was reaching the shielding capacity of the assembly and that an abnormal accumulation or deficiency of flow generated an E-field intensity of 0.46 kV/mm for more than 16 mm along the insulator sheath. Studies by EPRI indicated that values over 0.42 kV/mm over a 10 mm span along the sheath could adversely affect service life of insulators. There were two options to resolve high E-field stresses; 1) increase diameter of the corona ring, which would also increase cost; or 2) displace the sheds so that the E-field more equally distributed around the line end of the insulator. The second option was chosen because it would not increase cost and would provide similar results to increased corona ring diameter. To properly determine shed placement along the insulator, location of high electric field was determined. Equipotential lines were evaluated on the original simulation and compared to the line plot along the sheath. It was found that the location of the first non-stacked shed, slightly above the top of the corona ring, caused an influx of electric field stress on the shed; however, shifting that shed along the sheath in the direction of the tower end of the insulator allowed for natural dissipation of electric field. Once this location was ascertained, shed spacing could be defined and applied to the insulator model. From the results of the new insulator simulation, it was determined that the E-field intensity along the insulator sheath was reduced to meet customer acceptance criteria and EPRI’s recommended value of 0.42 kV/mm over a 10 mm length.
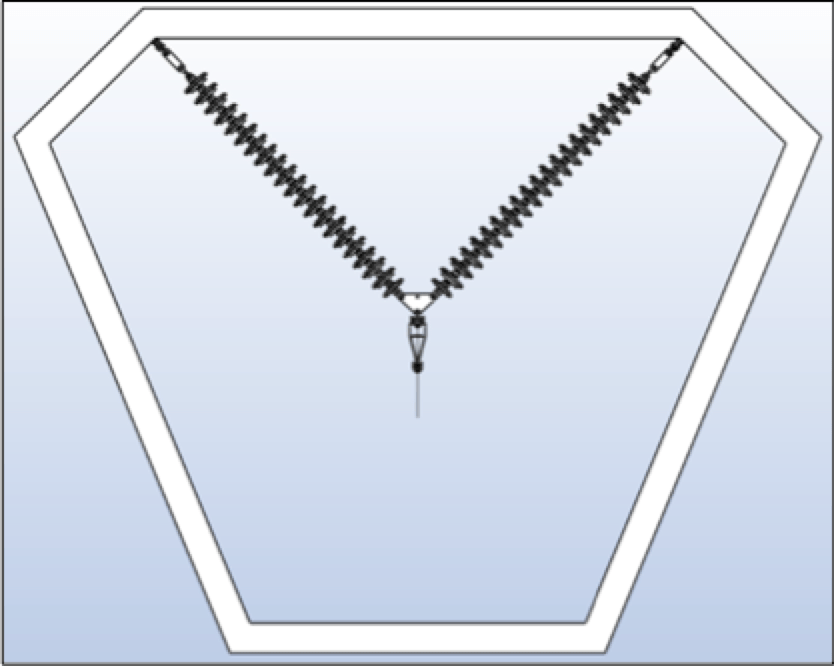
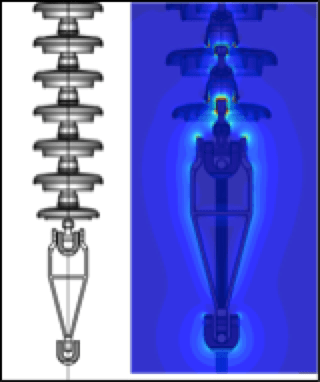
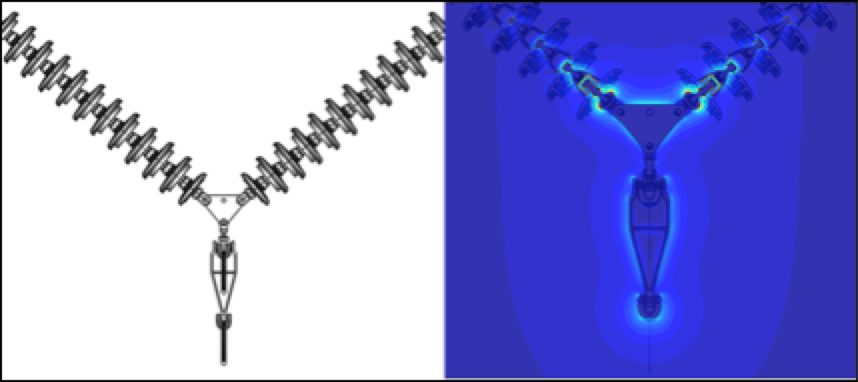
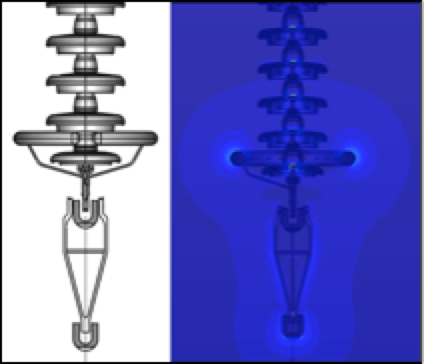
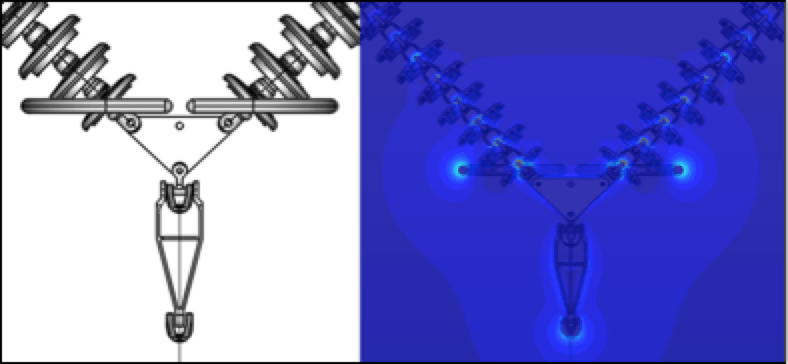
A western U.S. utility had a 230 kV transmission line originally constructed in the late 1970s that covered a distance of over 1000 miles. The line was constructed of guyed V transmission towers with insulator assemblies arranged in an I-V-I configuration. The V-string was located within the framing of the tower as shown in Fig. 4. The insulators used were porcelain bells that supported a two-conductor bundle of 795 Drake in vertical orientation. The line ranged in elevation from a few hundred feet above sea level to over 5000 ft as it traversed through mountain ranges. In the mid 2000s, the utility increased line voltage to 345 kV for additional capacity. At this time, the line began to experience RIV, radio interference voltage and nuisance line trips. The presence of excessive audible noise was an indicator that corona was present and additional line losses were occurring. The nuisance trips could be caused by a variety of reasons including contamination on insulators. The questions then became: 1) is corona occurring? 2) what is the solution to mitigate corona on the line? and 3) can the solution address the cause of nuisance trips? The utility hired consultants who provided partial answers but no solutions. Their conclusion was corona was occurring and the cause of the nuisance trips was insulator contamination. The simple answer to this issue was to increase leakage distance. However, could this be done on the existing structures while maintaining the necessary dry arc distances for the operating voltage? To find solutions and solve the corona issue, E-field modeling was employed. Coulomb software was used to develop a solution. To begin, the current condition of the assemblies had to be simulated. The configuration of the tower was modeled using drawings, pictures and specifications provided by the customer. Maximum elevations and tightest clearances were used to simulate worst-case conditions. Results from this simulation were the baseline on which to improve. The first step to a solution was increasing leakage distance of the assemblies. The only way to do this within the existing structures and using the existing hardware was a proposed change to toughened glass insulators with a fog type profile as insulating medium. This would increase leakage distance of the insulator strings while maintaining dry arc distances. The model for each type of insulating assembly, I-string and V-string, simulated in Coulomb (Figs. 5a & b) showed the E-field stresses along each insulator assembly. From this, engineers were able to determine the areas of high electrical stresses where corona was occurring. Interestingly, the model showed highest stresses on the outside I-string assemblies rather than on the center phase V-string with the extremely tight tower clearances. Noting these areas, grading devices with specific geometrical shapes were applied to the insulating assembly models at specific points to provide targeted E-field grading (Figs. 6a & b). By designing the devices to be application specific and not using what was readily available, there was no uncertainty in design performance. With E-field modeling, there is a known value and an engineering solution can be derived. Using models simulated in Coulomb, MPS was able to solve the problem and provided a better electrical performing assembly.
Summary
With innovations in E-field software and 3D drawing technology, more attention to standard assemblies should be examined for corona/RIV issues. E-field modeling should be used to reveal potential issues with corona/RIV on the full three-phase assembly versus just a single phase. With accurate 3-phase E-field modeling, real world simulations are now feasible. One direct advantage is using this tool to optimize current assembly designs. An example of a more specific benefit of E-field modeling is making the insulator and hardware assembly more convenient and accessible for hot-line work and maintenance. E-field modeling has gained acceptance for evaluating high voltage transmission line designs due to equivalence of calculations generated versus testing in a HV laboratory.