Earth has rapidly become a place of weather extremes. And few industries should be more concerned than operators of power networks that are often the first and most severely affected infrastructure. Perhaps little can be done to avoid loss of overhead lines under cataclysmic wind, snow or ice loading. But there are more subtle aspects of changing climate that may also impact reliability.
Most insulation on existing lines and at substations has been dimensioned according to standards based on historical experience with service parameters such as precipitation, wind, humidity, temperature, etc. These are the factors that most influence global dust patterns as well as deposition rate and type of pollution settling on insulator surfaces. Yet with projected rising sea levels, more desertification and higher wind activity, it is precisely these variables that are now changing at an unprecedented rate. There may a tendency to believe that adding creepage is all that is necessary to provide an added margin of security to insulation in the face of changing pollution conditions. But this is not always true. Shed shape and geometry affect how an insulator ‘self cleans’ while distance between sheds impacts icing behaviour as well as potential bridging during heavy rain. Moreover, at DC there is limited margin to add more creepage without affecting insulation distances.
At the same time, the relative proportions of ESDD and NSDD levels on surfaces impact how insulation performs and also the onset of problems, such as corrosion, from excessive leakage current. NSDD is also important in electrical performance of insulators because it affects the nature of surface wetting. A surface with a heavy but inert dust deposit will stabilize whatever conductive pollution there is and promote repeated development of partial discharges and dry bands. The settled layer of dust can also absorb sulphur dioxide and water vapor directly from air. This adds to the risk that hygroscopic salts will scavenge enough water from humid air to ‘self-wet’, thereby forming a continuous conductive surface that reduces insulator flashover performance, even if there is no rain or fog.
This edited past article contributed to INMR by Dr. William Chisholm, looked at dust and pollution accumulation on insulators with a view to more correctly identifying actual service conditions and better specifying insulators.

Site Pollution Severity According to IEC 60815
The key to properly applying standards such as IEC 60815 is establishing the correct site pollution severity before insulators are specified. If site pollution is underestimated, the standard provides little value in avoiding discharge and flashover problems downstream. Fortunately, there are many guides to help power engineers assess the site pollution severity (or SPS) of any service environment. Perhaps the best such practice has involved sampling the pollution from exposed insulators as part of a systematic long-term program to develop a countrywide pollution map.

Assessing electrically conductive deposits forms a fundamental part of these studies and selection of leakage distance based on measuring equivalent salt deposit density (ESDD) is well established. However, IEC 60815 also calls for an estimate of non-soluble deposit density (NSDD) in the accumulated pollution.

Effect of NSDD on Electrical Strength of Insulators
NSDD deposits often far outweigh ESDD levels that accumulate on exposed insulator and metal surfaces (e.g. in China by some 5 to 1). When in contact with metal and combined with moisture, this non-soluble dust can lead to different problems, such as accelerating metal corrosion. For example, one way to put NSDD into proper perspective is to compare its weight (in mg/cm2) with the amount of water on a surface under conditions that lead to corrosion. At the ‘critical relative humidity’, where water is absorbed directly onto a surface containing salt pollution, the resulting water layer thickness weighs roughly 0.001 mg/cm2. This increases to 0.1 mg/cm2 at 100% relative humidity, then to 1 mg/cm2 when covered with dew and finally to 10 mg/cm2 when wetted by rain.
NSDD is also important in electrical performance of insulators because it affects the nature of surface wetting. A surface with a heavy but inert dust deposit will stabilize whatever conductive pollution there is and promote repeated development of partial discharges and dry bands. The settled layer of dust can also absorb sulphur dioxide and water vapour directly from air. This adds to the risk that hygroscopic salts (including chlorides and sulphates) will scavenge enough water from humid air to ‘self-wet’, thereby forming a continuous conductive surface that reduces insulator flashover performance, even if there is no rain or fog.
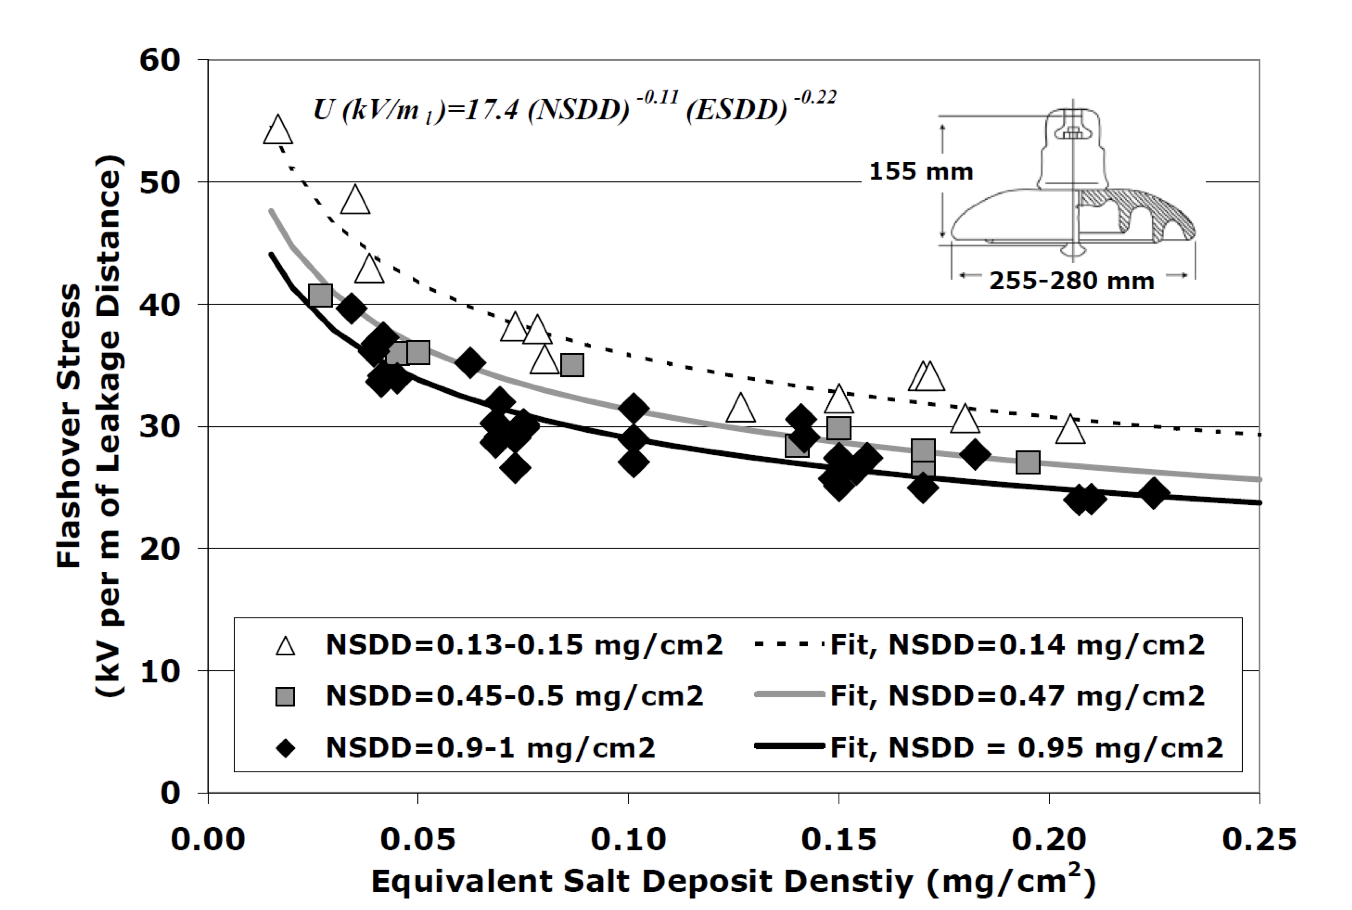
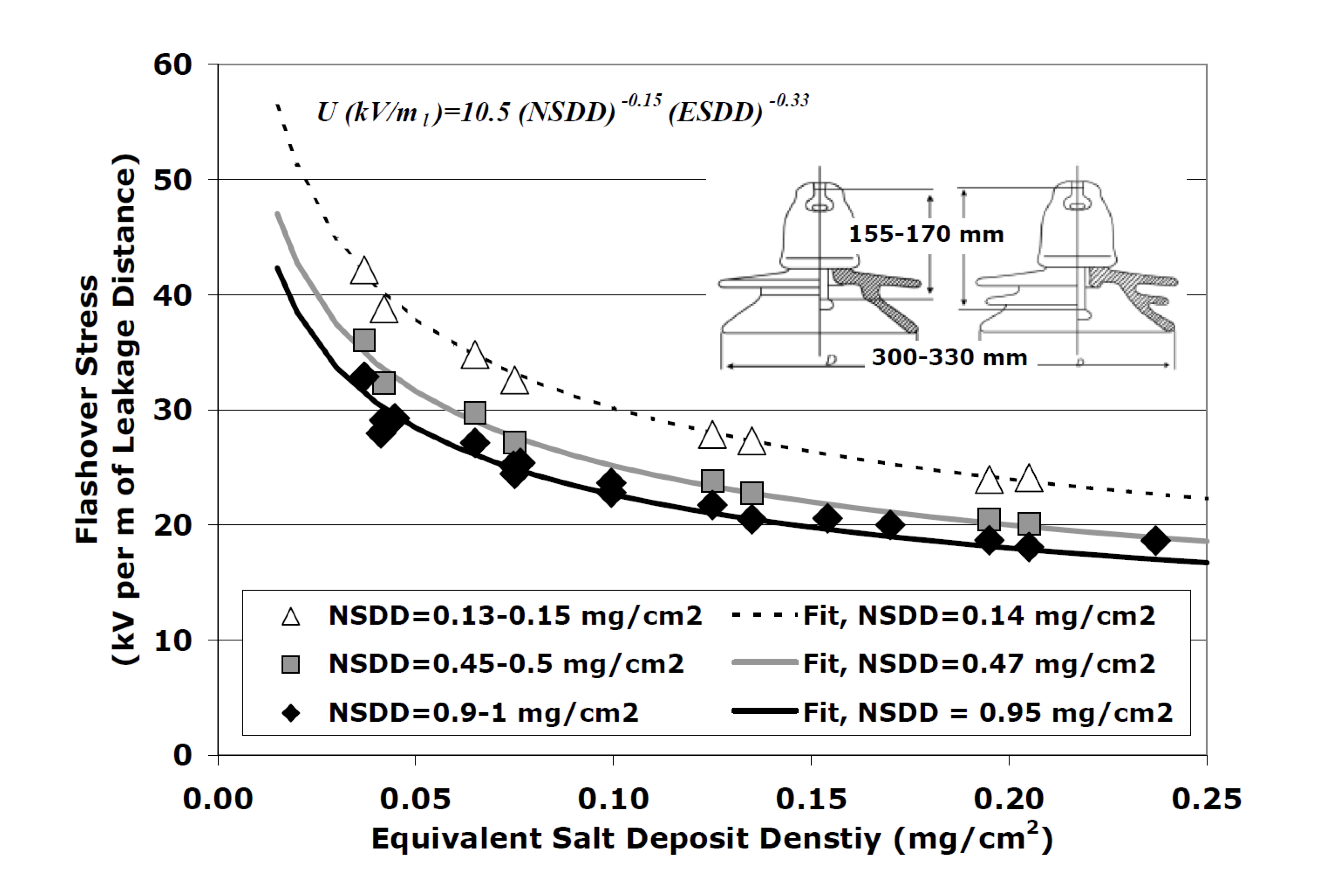
Indeed, the role of NSDD has been recognized for years in contamination testing using the clean-fog method. Test standards require that, whatever electrical conductivity is used in the pre-contamination slurry, it must always have the same 40 g/l concentration of kaolin clay. This yields a repeatable clean fog test result and, according to work in 1996 by Prof. R. Matsuoka, the resulting low NSDD level of 0.05-0.07 mg/cm2 has only minimal influence on insulator selection according to IEC 60815. At higher levels (e.g. up to 1 mg/cm2), however, the effect of NSDD on electrical strength becomes progressive. For example, test results analyzed in 2009 by the author show that a 5:1 increase in ESDD (from 0.04 to 0.2 mg/cm2) causes flashover performance to drop by 30 to 40%. A 7:1 increase in NSDD (from 0.14 to 0.95 mg/cm2), by contrast, results in a reduction of performance from 20 to 25%.

The important performance advantages of silicone rubber surfaces over glass and porcelain – whether as polymeric insulators or RTV silicone coatings – relate mainly to the ability of these high surface energy materials to break up continuous water films. This ensures that there is no direct electrical path from the end fittings across the insulator surface. The according-to-some ‘unresolved’ or open question in application of silicone materials is whether this performance advantage can be maintained under all circumstances. There may be some critical loading level above which inert dust accumulation overwhelms the ability of the silicone material to produce a water-beading film of low molecular weight (LMW) entities that are responsible for hydrophobicity transfer.

Estimating Global Dust Deposit Rates
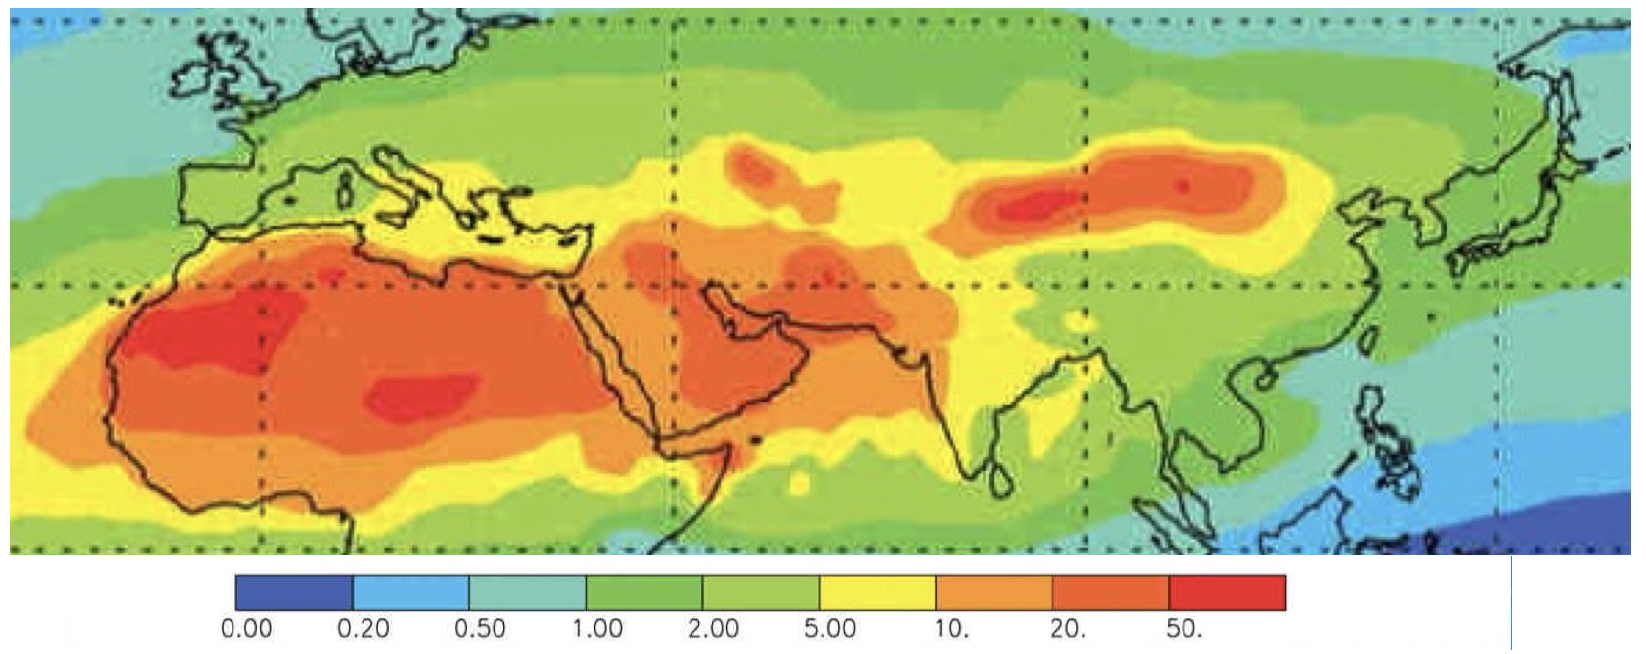
NSDD can be estimated using some generalized multiplier based on experience, such as 5 times ESDD, as suggested for China, or 10 times ESDD, as in the Middle East. However, it is usually far better to obtain independent estimates of both non-soluble and soluble pollution. In this regard, satellite observations seem to offer a novel and economical way to gather useful NSDD data covering large areas of the globe and also to study how the NSDD/ESDD ratio changes across different regions. Authors of a 2005 article in Science used three studies that matched satellite optical depth estimates for dust deposition with locally recorded concentrations of iron. They then proposed a map of average annual dust deposit density, which highlights areas with a rate of 20 g/m2/year deposit rate in north Africa, the Middle East and north-west China.
Dust Accumulation Model
Dust is removed from the atmosphere by dry or wet deposition. A simple model for accumulation of NSDD on insulator surfaces would therefore be as follows:
• The dust flux is uniform throughout the year
• Days without precipitation allow the dust to accumulate
• Days with precipitation wash all dust away
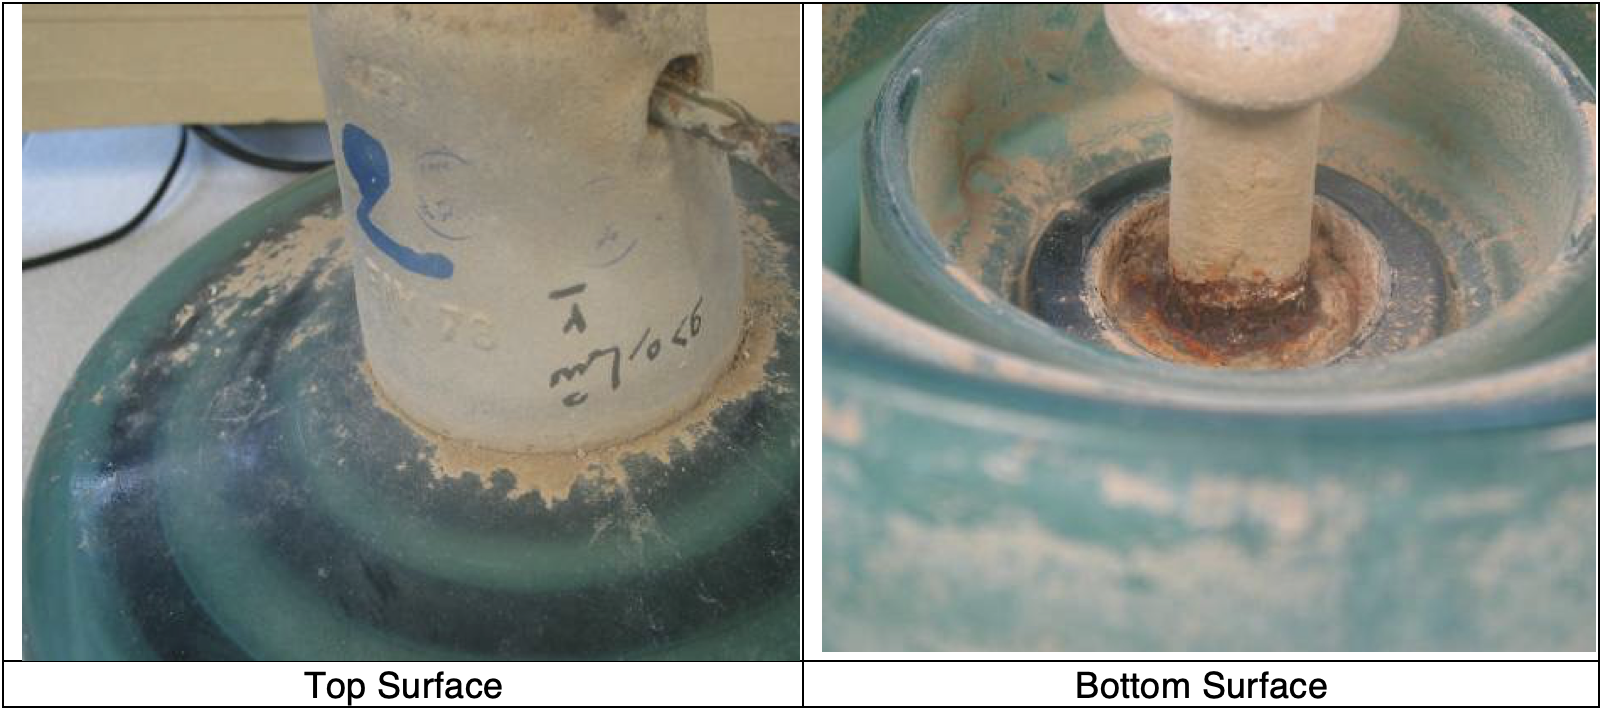
This model would clearly be better for upper surfaces than those facing the ground. The rate of increase of NSDD, with a heavy dust flux of 10 g/m2/year in Fig. 3, would be 0.0027 mg/cm2 per day. To reach the level of 1 mg/cm2, at which the influence of NSDD becomes very strong, would therefore require (1/0.0027) days – roughly a full year without rain. Unfortunately, there is no well-defined computer model yet to establish how air flow past insulator surfaces influences rate of increase of NSDD on bottom surfaces, or how it reaches an equilibrium after long-term service.
Dust Accumulation Observations
There are relatively few points of confirmation to guide application of dust deposit rate to estimate NSDD levels on insulators. For example, along the route of a 1000-km transmission line in Russia, NSDD levels from 40 test stations were reported to be in the range from 0.02 to 0.14 mg/cm2, with a median value of 0.04 mg/cm2. The global map shows annual dust deposit rates on the order of 1-2 g/m2/year, which when converted gives 0.1-0.2 mg/cm2 per year. In Iran, NSDD levels on test insulators were found to be in the range 0.2 to 0.8 mg/cm2 in the Bushehr region, compared to values of 0.5 to 3 mg/cm2 in the Hormozgan region. These were then plotted on the IEC 60815 classification chart for SPS, along with the measured values of ESDD. Close inspection of the Jickells map for this region revealed that annual dust deposit rates also differed (i.e. 10-20 g/m2/year for Bushehr and 20-50 g/m2/year for Hormozgan). In both cases, proximity to the sea ensured that ESDD levels exceeded the high level of 0.1 mg/cm2/year.
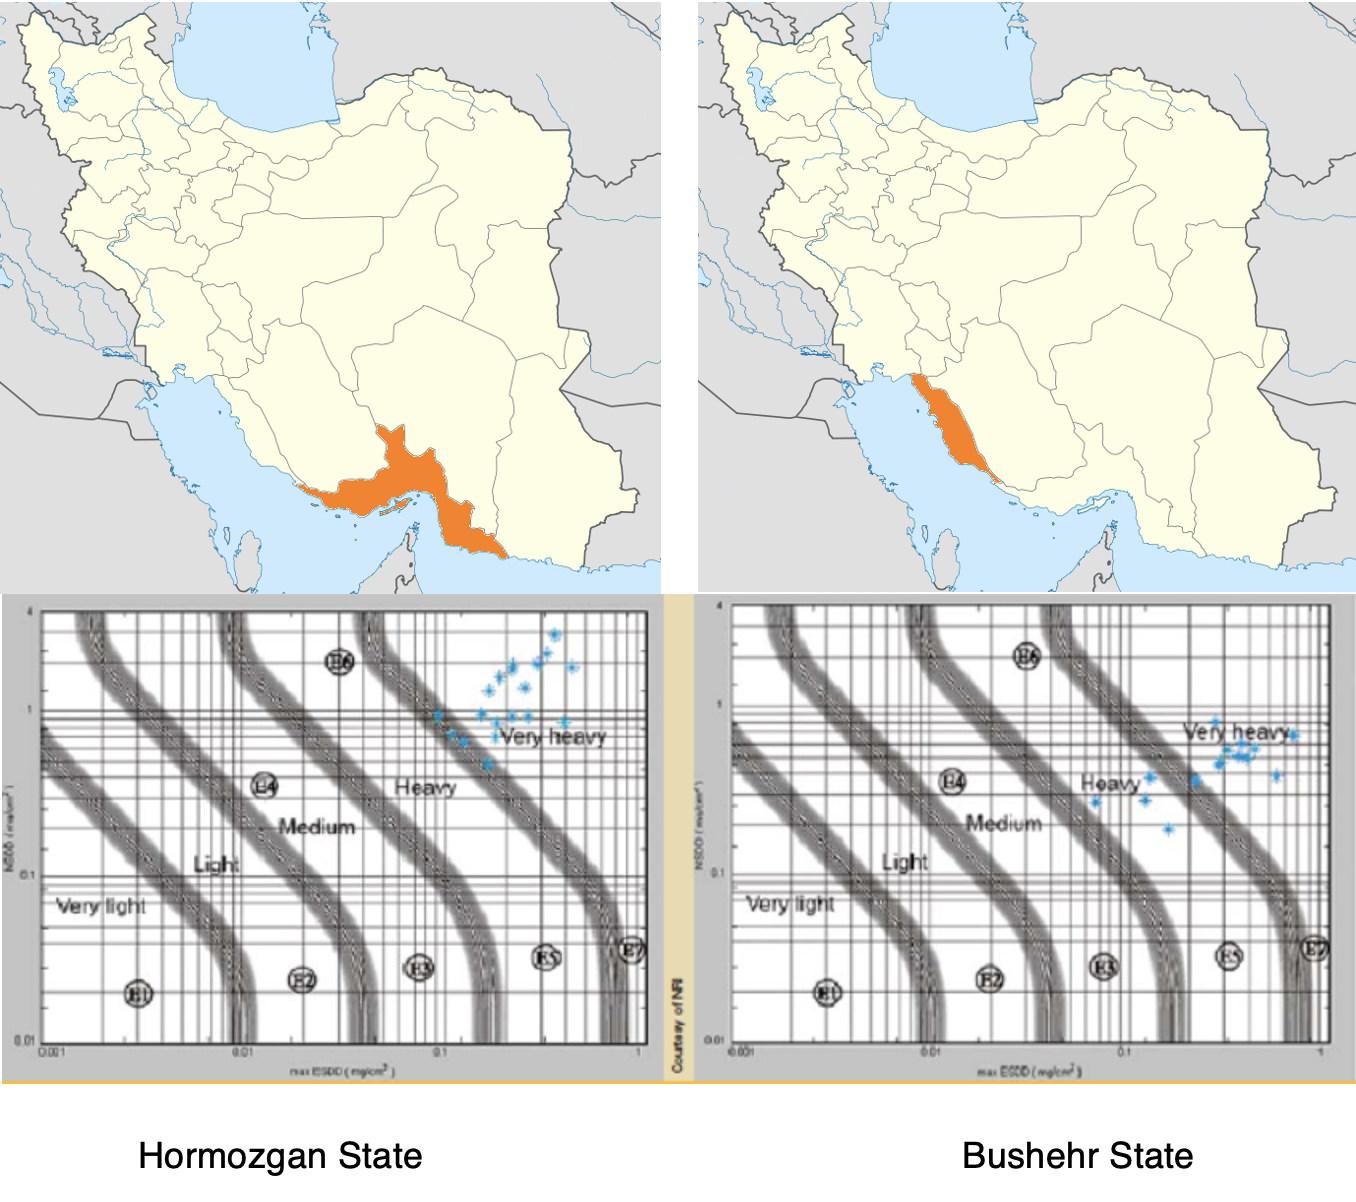
Use of logarithmic scales on both axes in the IEC chart is deliberate since such distributions are more helpful when selecting insulators. They faithfully capture the wide dispersion in the test results, whereas simple averages and standard deviation values for normal distributions do not. Scatter in NSDD values proved the same or less than variation in corresponding ESDD measurements. Israel Electric confirmed data from the global dust map and also suggested that an NSDD/ESDD ratio of 10:1 is indeed appropriate for the Middle East. The Hormozgan observations above support this refinement. After long-term service on a ±600 kV DC line near the Itaipu dam in Brazil, measured NSDD levels exceeded 2 mg/cm2. Given local ESDD of 0.4 mg/cm2, a 5:1 ratio seemed to apply here. As discussed, this ratio has also been proposed for many insulator applications in China.

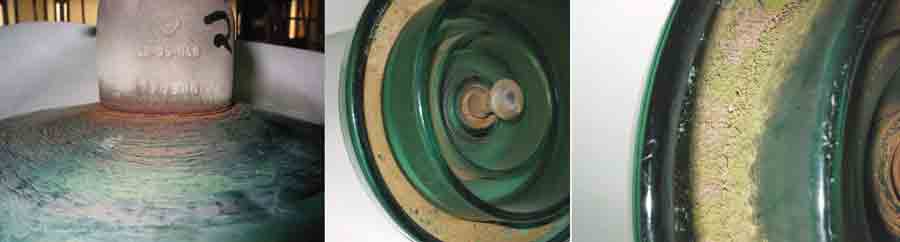
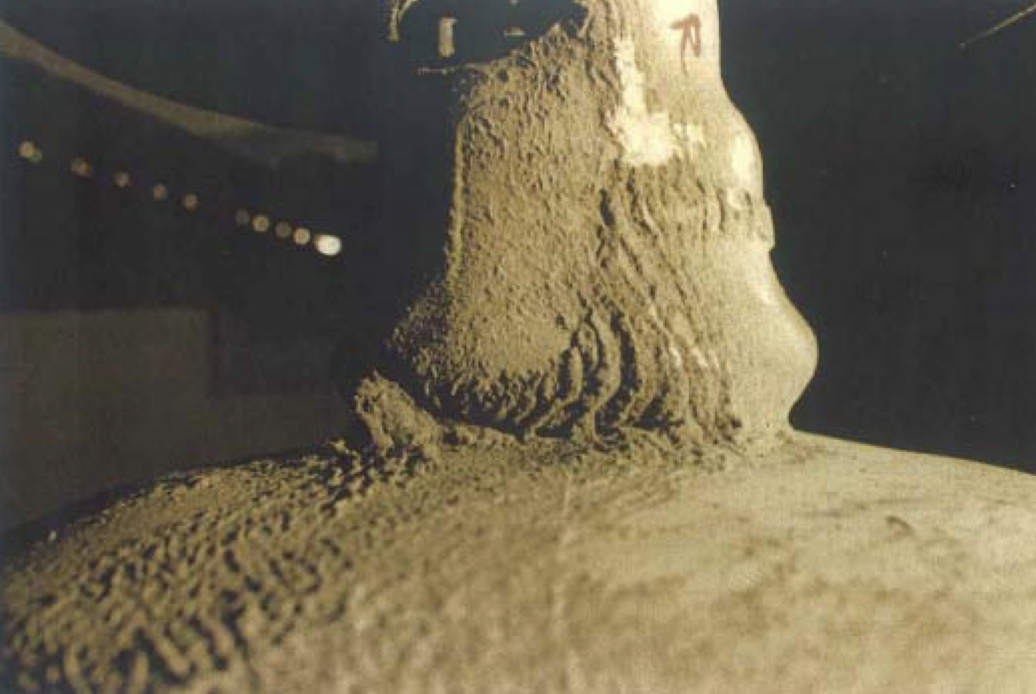
Differing NSDD/ESDD ratios may also be appropriate for other regions and exposure conditions. For example, Ontario, Canada is an area with low annual levels according to the global dust map (i.e. 0.2 to 0.5 g/m2/year). In a season of winter measurements with frequent intervals of natural rain, the observed NSDD/ESDD ratio was less than 3:1. Statistically, the standard deviation of the natural logarithm of the NSDD values (sln NSDD =1.5) was three times higher than the corresponding ESDD value (sln ESDD = 0.5). This contrasts with pollution levels in Iran, where there was less variation in NSDD than in ESDD. On the other hand, local sources of non-soluble pollution deposits, such as cement plants, can lead to extreme levels of NSDD on all surfaces. For example, heavy deposits accumulated over a period of 27 years on insulators near a cement plant in Indonesia, which has about the same dust deposit density as Canada and should otherwise have low pollution levels due to frequent rain. The ESDD level of 0.7 mg/cm2 would be otherwise be considered ‘medium’ without the NSDD, but ‘very heavy’ with NSDD (being 26-29 mg/cm2 higher than the maximum level shown in the IEC 60815 classification chart). In this unusual case, the overall NSDD/ESDD ratio was about 400.