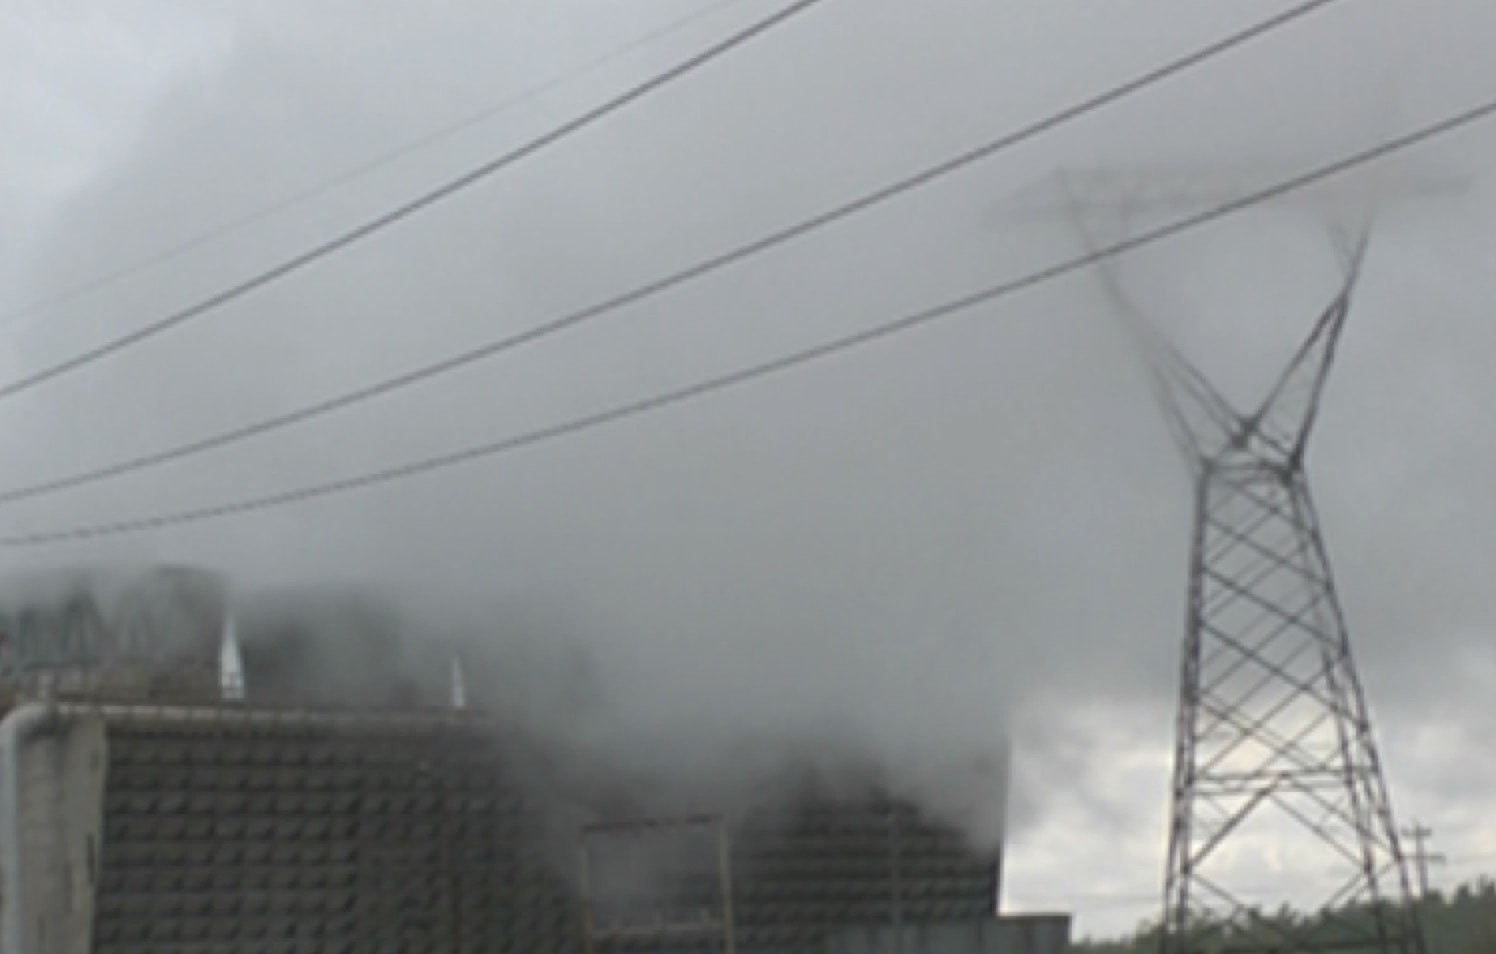
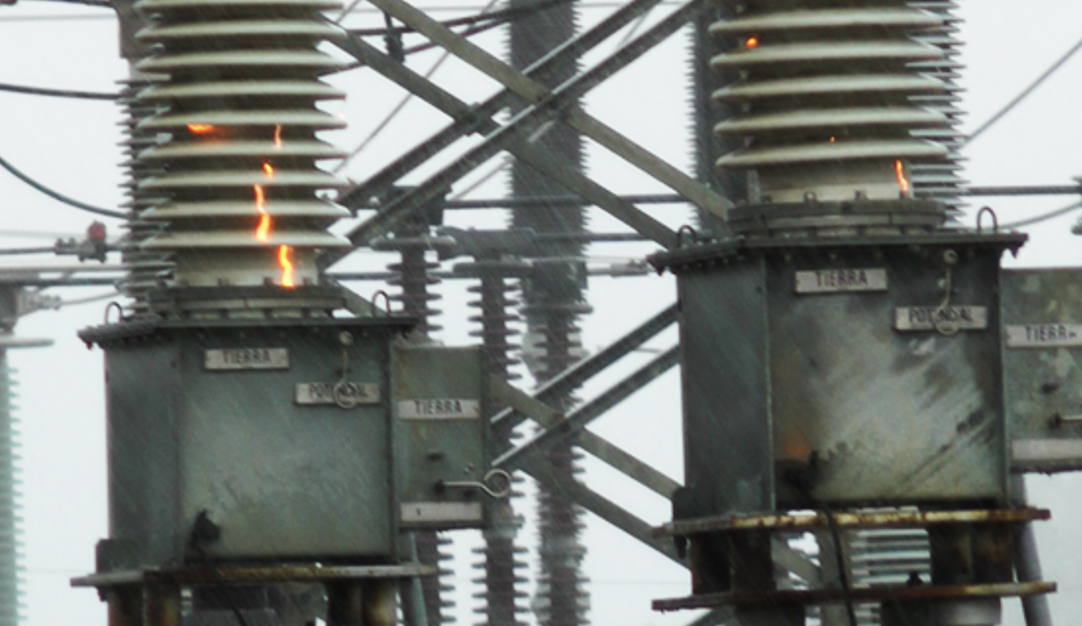
Cooling towers can be a major source of pollution at substations located near thermal power plants. Moreover, their effect can become critical when prevailing winds blow from towers toward the substation. One example of such a critical impact was the problems encountered several years ago at the Francisco Villa Power Substation in Mexico, located near a thermal power plant of the same name. In a short space of time, leakage current levels on insulation at the substation increased rapidly until a flashover event that led to power outages affecting several transmission lines. The flashovers resulted from failure of equipment insulation and in particular that of a surge arrester protecting a transmission line located directly in front of the plant’s cooling towers.
This edited past contribution to INMR by Ramiro Hernández, Gerardo Montoya and Victor Romero of the Instituto Nacional de Electricidad y Energías Limpias (INEEL) and the Comisíon Federal de Electricidad (CFE) presented an analysis of data obtained by the substation’s leakage current monitoring system and related insulator pollution performance. The analysis, based on leakage current values measured before, during and after the flashover as well as on meteorological parameters, described the pollution accumulation process, established the failure hypothesis and recommended alternatives to mitigate pollution from cooling towers. Finally, the failure hypothesis was validated by laboratory tests performed in a fog chamber.

Background
Pollution is among the main causes of failure of external insulation. Proper insulation design must therefore always consider all pollution sources that can affect insulation over time. Moreover, pollution severity can also change dramatically due to external factors and this can affect the effectiveness of scheduled preventive maintenance. This is important to note since, unlike other causes of outages, pollution can lead to service interruptions that last for hours. Among the pollution sources inherent in many electrical systems are the cooling towers of thermal power plants (TPPs) that extract heat from large volumes of water through evaporation or conduction. Steam generated during extraction wets external insulation located nearby and, if steam conductivity is high, cooling towers also become a serious pollution source. Wetting of insulation is the result of several mechanisms. For example, condensation occurs if there is a temperature difference between insulator surface and the environment. The greatest impact happens when vapor emissions cover and completely saturate insulators, such as whenever there is a breeze coming from the cooling towers during afternoons.
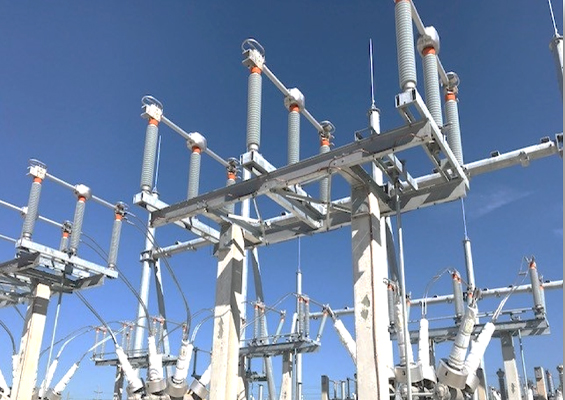
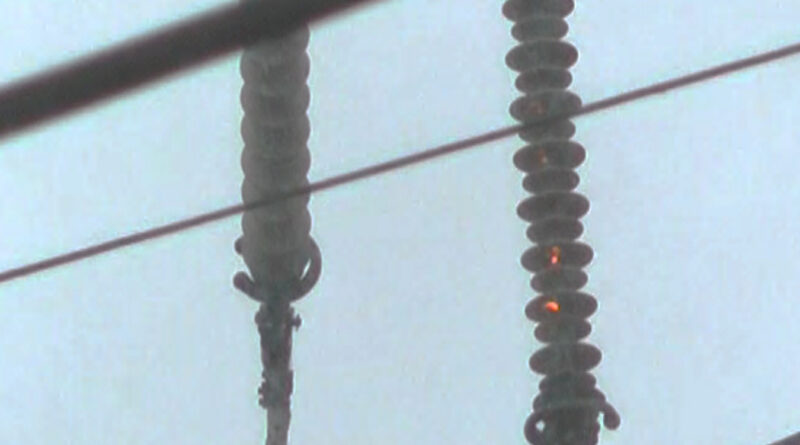
The 115 kV/230 kV Francisco Villa Power Substation is located in the north of Mexico and adjoins the Francisco Villa TPP. Insulators at this site are glass and porcelain and some have been in service for more than 40 years. During this time frame, insulators having different profiles and from various manufacturers have been installed, both in primary equipment as well as on insulator strings. Insulation coordination has been maintained by periodically applying hydrophobic coatings and also by carrying out scheduled maintenance such as cleaning. In addition, a leakage current measuring system was installed as a diagnostic to assess pollution flashover risk. Based on this risk, maintenance was deemed required or not. Climate here is semi-arid with average annual rainfall of 300 to 400 mm and relative humidity of less than 50%. Pollution surrounding the substation, mostly agricultural, falls within a medium level and therefore the specific leakage distance for insulation design at the substation was originally set at 20 mm/kV. However, vapor from nearby cooling towers caused contamination failures on several pieces of substation equipment. This forced the CFE to increase specific leakage distance by replacing failed insulators with others having a different profile. As a result, the substation now has diverse insulator profiles with specific leakage distances that range from 20 mm/kV to as high as 39 mm/kV.
In July 2012, pollution flashover at the substation affected service on several transmission lines. Specifically, the event resulted from increased pollution on the insulating surface of a substation arrester located in front of the cooling towers. The failure developed during light rain around 3:30 am when the station’s contamination monitoring system indicated that relative humidity had reached values higher than 90%. Under these conditions, the insulator surface was wet enough to acquire a temperature lower than ambient and leakage current increased until pollution flashover.

Pollution Source & Monitoring
Pollution affecting the Francisco Villa Substation occurs mainly when the dominant wind comes from the East or South-Southeast such that vapor from nearby cooling towers humidifies and contaminates insulators. This is most frequent in the afternoon. Cooling tower contamination is deposited by mechanisms such as condensation, settling of non-soluble material or wetting. As discussed, condensation is produced when there is a difference of temperature between the surface of the insulator and ambient, generally during the hours before sunrise. However, because of the temperature of vapor produced by towers, condensation can also occur when vapor covers the insulators. Deposition of contaminants also takes place when cooling towers emit vapor that covers and saturates insulation.
During past years, increasing contamination had been detected at Francisco Villa Substation and a Contamination Monitoring System (CMS) with 16 leakage current sensors was therefore installed. The first 8 channels were connected to insulators in the 115 kV area and the remainder to insulators in the 230 kV area. The CMS is designed to determine contamination level on insulators based on the real-time measurements of leakage current. The greater the magnitude of leakage current, the greater risk of flashover. Based on laboratory tests, INEEL (the Instituto Nacional de Electricidad y Energías Limpias) had already determined Flashover Risk Level for each level of leakage current level. This was done for three different values of specific leakage distance (i.e. 20, 25 and 31 mm/kV) in order to establish a warning system of color codes. According to leakage current value, flashover risk level was determined and a series of maintenance tasks were proposed. Clearly, shorter specific leakage distance implies greater level of risk for the same leakage current value. The CMS stores leakage current information in a database and sends e-mail alerts in case of elevated risk of pollution flashover. It also calculates the Fast Fourier Transform (FFT) of the leakage current, allowing allows matching harmonic content of the current with possible risk of deterioration of composite insulators. A link with a meteorological station makes it possible to match leakage current data with local weather parameters.
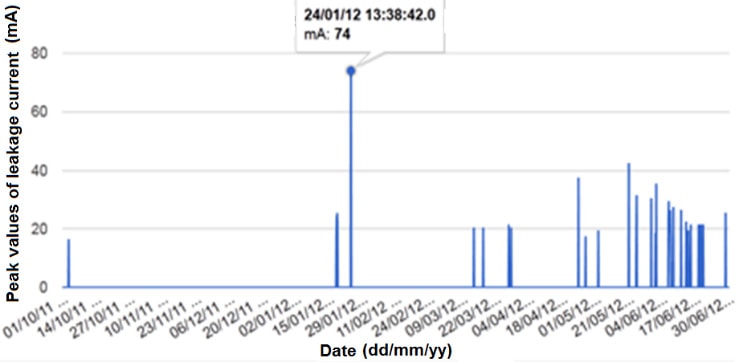
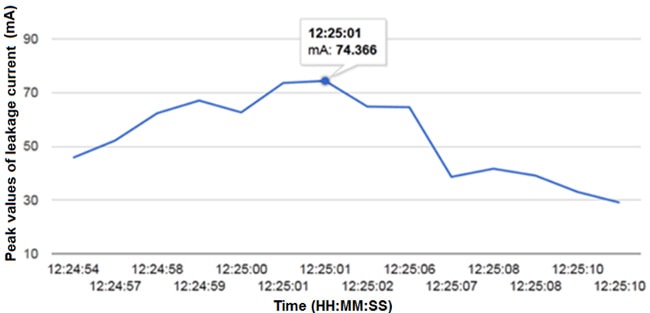
An interesting example of the process whereby the CMS at Francisco Villa Substation registered leakage current activity that required insulator maintenance occurred between Oct 1, 2011 and June 30, 2012 (see Fig. 1). For Jun 24, 2012, time of elevated leakage current activity was unusual, with activity from 12:00 to 12:25 reaching a Risk Level of 3 (see Fig. 2). According to the warning system, this Risk Level required start of maintenance and CFE staff carried out washing.
Analysis of Leakage Current Activity
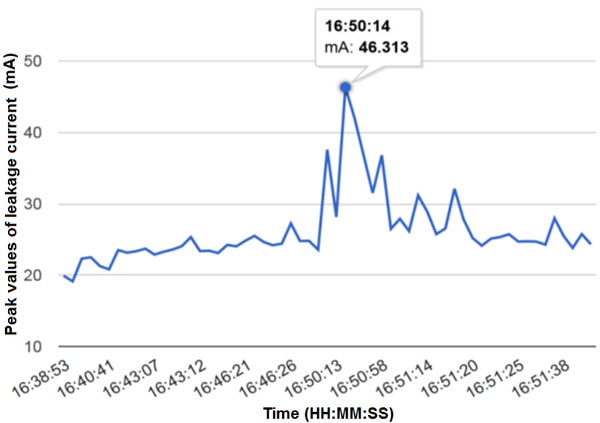
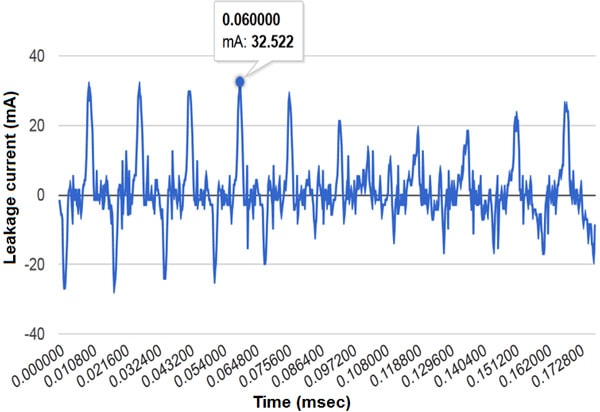
In early May 2012, the CMS registered slight leakage current activity in various channels connected to disconnecting switches as well as to pedestal post insulators in the 230 kV area of the substation. On May 2, notable activity was generated under a wind that blew from the West at around the 18:41. Then, on May 21, the CMS registered leakage current activity that triggered alarms in the 8 channels connected to the 230 kV area. The activity period was from 16:38 to 16:51 and maximum current level registered was 46 mA (see Fig. 3). Again, time at which this activity occurred was unusual since leakage current usually occurred between 00:00 and 09:00. Weather parameters at the time were analyzed and showed an ambient temperature of 33ºC with relative humidity of 13%. These values suggested that ambient conditions were insufficient to generate leakage current since relative humidity was low. However, a change in wind direction from south to east was observed and, interestingly, east is where the cooling towers of the nearby TPP are located. It was therefore assumed that this change in wind had caused insulators to become wetted by cooling tower vapor, thereby generating the leakage current activity registered in the CMS. This activity was considered as leakage current since the related oscillogram presented a sinusoidal shape with harmonic content of 180 Hz (see Fig. 4). In addition, more than 50 oscillograms (events) were recorded on every channel where the alarm was triggered.
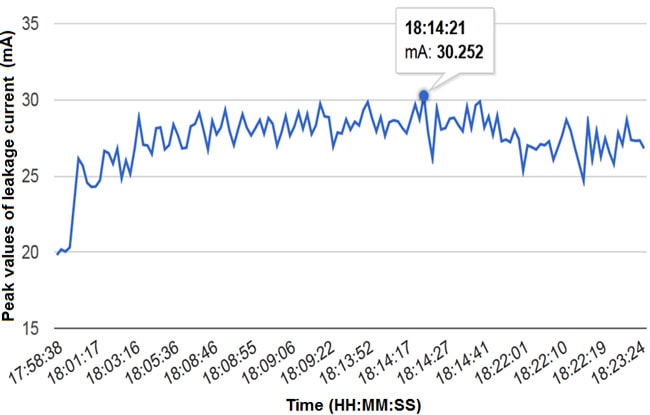
On May 24, a new period of leakage current activity was registered and alarms were again triggered in channels connected to 230 kV insulators (i.e. from channels 9 to 16). This leakage current activity, considered light, was generated from 17:58 to 18:30. Wind blew from the west and only one channel reached a value over 30 mA (see Fig. 5). Nevertheless, more than 100 oscillograms (events) were registered and this indicated a long period of activity (since each oscillogram measured approx. 100 to 500 ms). A review of the information recorded in the CMS during May showed that leakage current activity generally occurred in the afternoons from 15:00 to the 17:00 and usually for intervals of about 30 minutes. In addition, it was observed that relative humidity registered during these activity periods was low. So, it was again assumed that wetting came from the cooling towers, later corroborated by reported leakage current activity.
Even though the warning system suggested vigilance, it is important to note that the specific leakage distance of some insulators at the substation was less than 20 mm/kV. Due to repetition of leakage current events, staff in charge of maintenance decided to schedule washing the substation in June. Various periods of leakage current activity were registered during June (see Fig. 6). During the first period, from May 30 to June 1, levels of leakage current were still within the range of 30 mA and activity was generated during the afternoon with wind blowing from the east and the east south-east. A need to schedule washing was then confirmed by CFE staff. Other periods of leakage current activity were recorded on June 6, 8, 11, 13, 15 and 18. All these events were on 230 kV channels and with values below 35 mA. It is important to note that leakage current activity occurred during afternoons and usually when the wind came from the east where the TPP cooling towers are located. Other periods of activity were registered on June 19, 20 and 29, however some of these events were caused by washing performed by staff of the Camargo Transmission Zone.
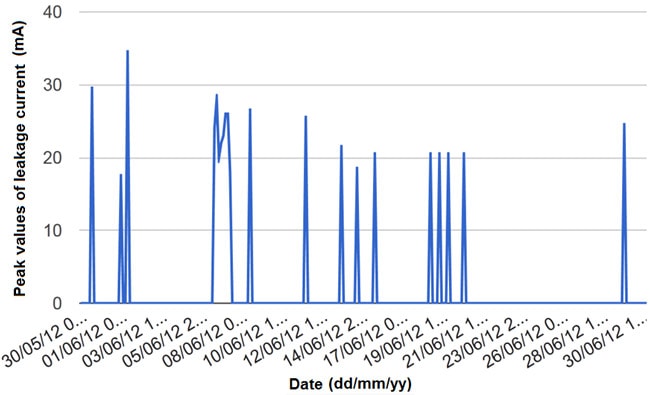
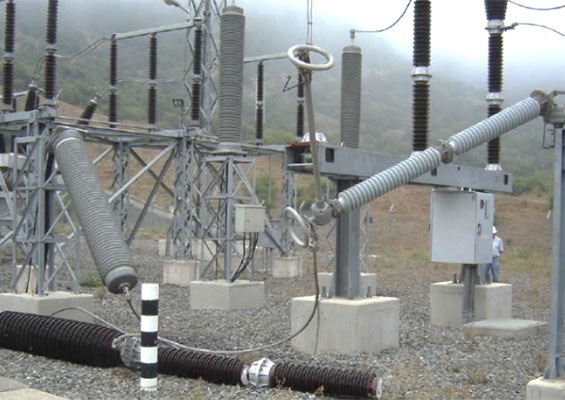
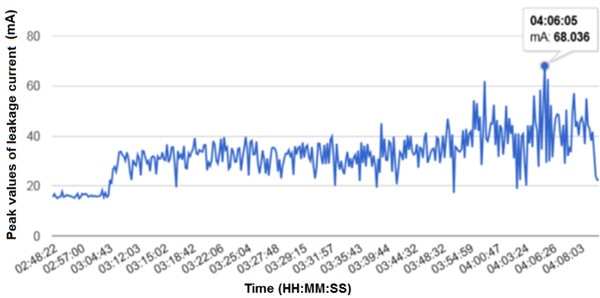
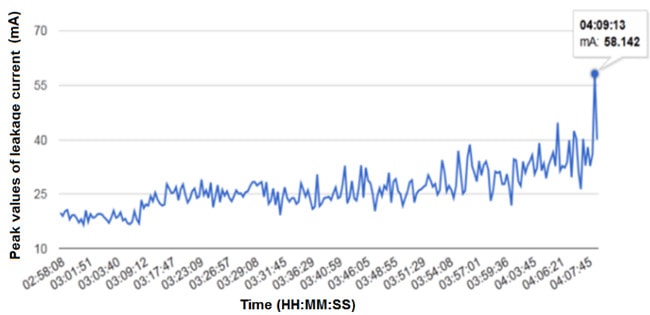
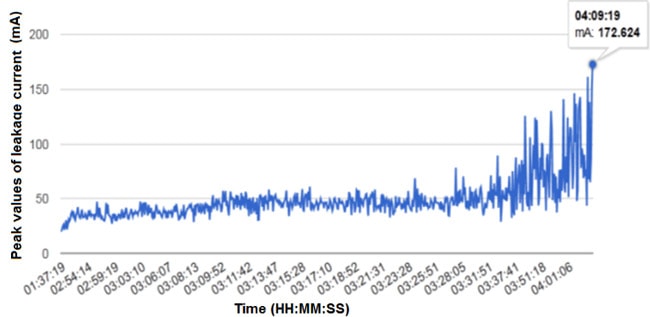
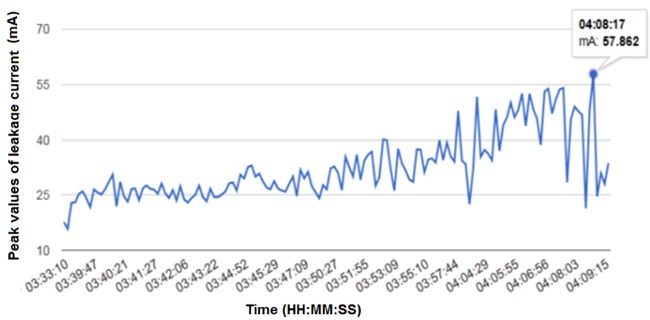
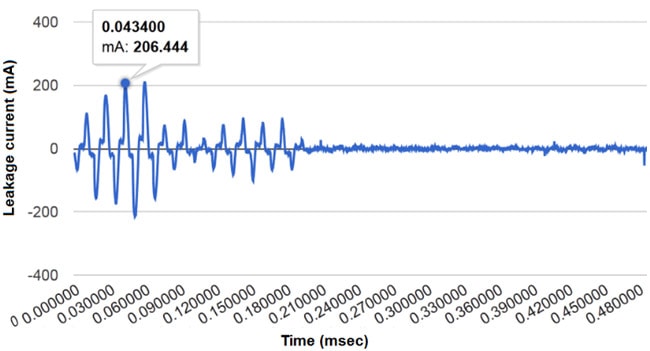
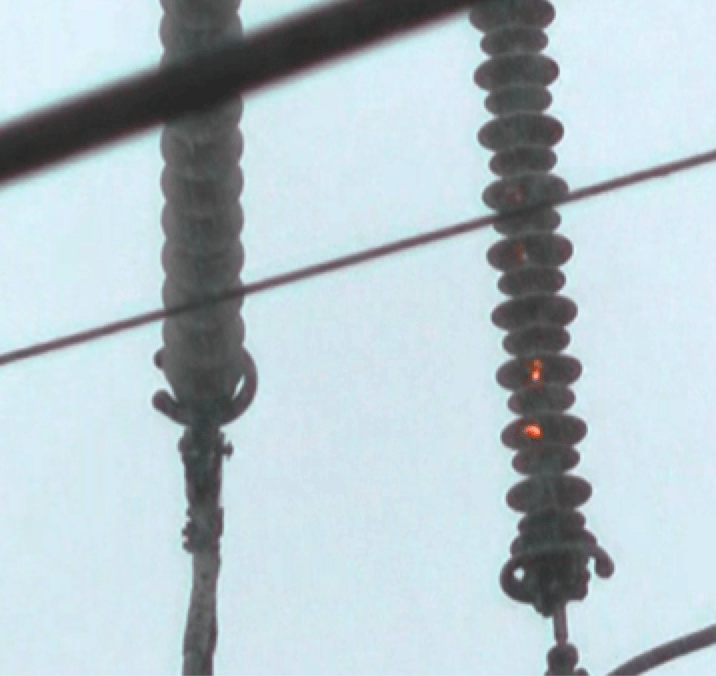
As observed in Fig. 6, periods of activity became more frequent and insulators with the shortest leakage distance had greater current peaks and activity periods that lasted about an hour. On July 3, the Francisco Villa Substation presented a period of leakage current activity (see Figs. 7 to 10) that resulted in flashover on various insulators and produced a sweep of the 230 kV bus. It should be noted, however, that flashover did not occur on any of the insulators being monitored, even though leakage current reached values that represented high probability of pollution flashover. Rather, the failure occurred on surge arresters located in front of the cooling towers. These arresters protect the beginning of the transmission line and were not being monitored by the CMS. Consequently, it is possible that their contamination level was greater than on other substation insulators, especially because they are the devices closest to the cooling towers. The first registered flashover occurred at 03:39:38, with high intensity current peaks on all 16 channels of the CMS. A second flashover took then place at 04:09:21. But in this case the high intensity current peaks were only observed in 4 of the 16 channels being monitored. Such leakage current activity was registered in Channels 10, 11, 12 and 14, which monitor 230 kV insulators. Activity began at 01:37 and remained continuous until 07:00. Because of that, more than 2000 events (oscillograms) were recorded for each channel. Channels 9, 13, 15 and 16, all connected to the 230 kV area, did not register leakage current activity because these are more distant from the cooling towers. Similarly, no activity was registered in the 8 channels connected to the 115 kV area. After the flashover, leakage current activity continued in some channels and reached values above 150 mA. The highest peak was measured for Channel 14 at 06:09 (i.e. for Disconnect Switch 99002) with a value of 206 mA (see Fig. 11). The period of activity ended around 07:00.

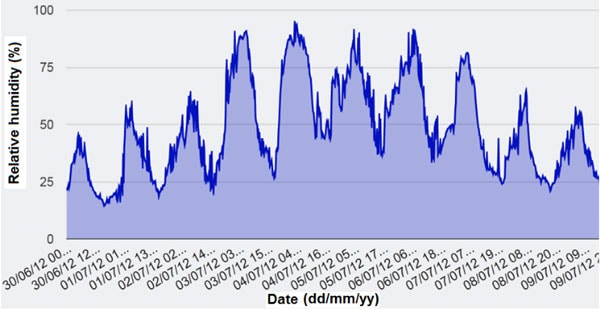
In regard to weather, it was observed that there was an increase in relative humidity up to 91% on July 3 (see Fig. 12). This caused a substantial increase in leakage current activity. Additionally, the dominant wind during this period of activity, blew from the east-southeast to the south (i.e. from the cooling towers). Minimum temperature was 19.1ºC, recorded at 06:20. Once ambient temperature rose, leakage current activity ceased on the insulator being monitored.
On July 11 at 17:00, there was a heavy rain with a wind that came from the east. A high level activity of electrical discharges was observed on insulators of the Capacitor Voltage Transformers (CVTs) of TL 93220 (note that these CVTs had not yet been washed). Electrical discharges were also observed on CVTs of TL 93200 which had been washed on July 5, as well as on the composite insulators on Tower 1 of TL 93220. The predominant wind came from the east, meaning that vapor from the cooling towers was being blown over the substation. It is worth noting that the CMS did not register leakage currents on any of the channels that monitored insulators at the Francisco Villa Substation because these insulators had been washed after the failure of July 3.
Pollution Failure Hypothesis
During May and June 2012, the CMS of Francisco Villa Substation had registered leakage current measurements with risk level between 1 and 2. Activity at such levels is usually considered light and requiring only minimal vigilance. However, some registered measurements were close to a risk level 3, representing moderate activity that requires some form of preventive maintenance to avoid a flashover.
Based on experience of local CFE staff as well as on the conclusion that leakage currents were being generated more by the impact of cooling towers than by the environment, it was decided to begin maintenance during June. This also took into account that levels of leakage current would increase in case of misty rain or dew. On July 3, the day of the failure, there was rain in the region after more than two years of drought and relative humidity increased to 90%. This caused a period of leakage current activity that started at 01:30 and ended at about 06:20. Some sensors in the 230 kV area began registering activity with risk levels 1 and 2, which imply vigilant actions are required in response. It was only at 03:09 that the first event greater than 50 mA (i.e. risk level 3) was registered. The first flashover then occurred at 03:39 on an unmonitored insulator, i.e. 30 minutes after the first event registered with risk level of 3 (namely moderate activity – preventive maintenance). Subsequently, even when various channels registered values greater than 150 mA, i.e. representing a risk level of 4 (severe activity – urgent maintenance) and high probability of flashover, no failures occurred on any of the insulators being monitored.
Analyzing the continuous leakage current events registered during June 2012, it became possible to infer that accumulation dynamics of contaminants that came from the cooling towers could have varied. This conclusion is supported by the fact that insulators only 7 days after being washed still presented high leakage currents that could be detected visually. In addition, the period of leakage current activity occurred mainly during afternoons and with wind that came from the direction of the cooling towers.

Verification of Hypothesis
In order to confirm the failure hypothesis stated above, artificial pollution tests were carried out in a clean fog chamber. These tests were done using water that comes from the cooling towers and then heating it to the same temperature at which it is usually emitted (i.e. approx. 55°C).
Test Procedure
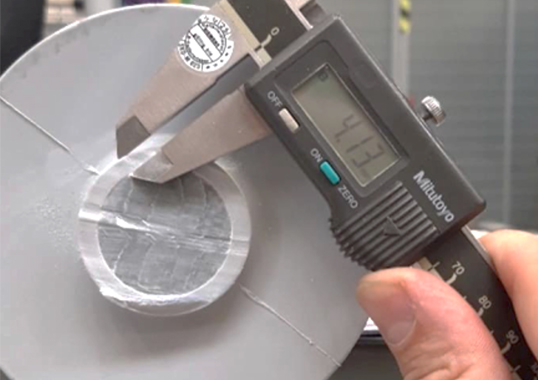
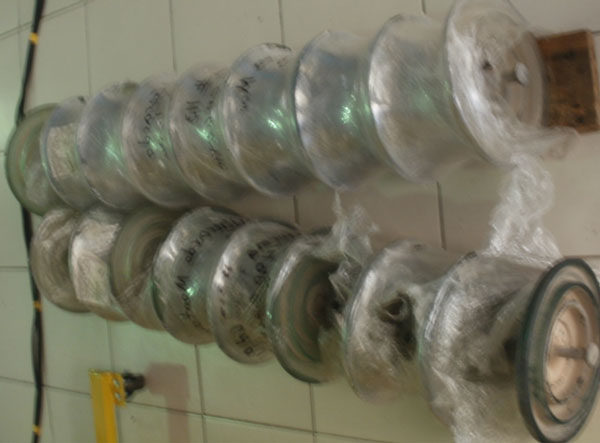
Test insulators were taken from a 15-insulator string removed from the Francisco Villa Substation. The insulator type was standard glass cap & pin of 273 mm diameter and 279 mm leakage distance. The insulator string had been in service on a 230 kV circuit near the cooling towers. According to these values and number of insulators, each insulator was electrically stressed by an average of about 8.85 kV. The overvoltage for a 230 kV system (5%) is about 241.5 kV, and therefore maximum electrical stress per insulator could be 9.29 kV. The insulator string was sent to INEEL’s laboratory with due care to preserve whatever pollutants had been naturally deposited onto their surface.
The tests consisted of determining U50% critical flashover voltage on insulators that were naturally polluted by wetting them with tap water (as recommended by IEC 60507) as well as with water from the cooling towers – inside a clean fog chamber. Each test string was composed of 4 insulators from the site. The conductivity value measured at 20°C for tap water was 0.134 mS while the value for water from the cooling tower was set at 2.65 mS. The rapid flashover voltage technique was used for carrying out the tests.
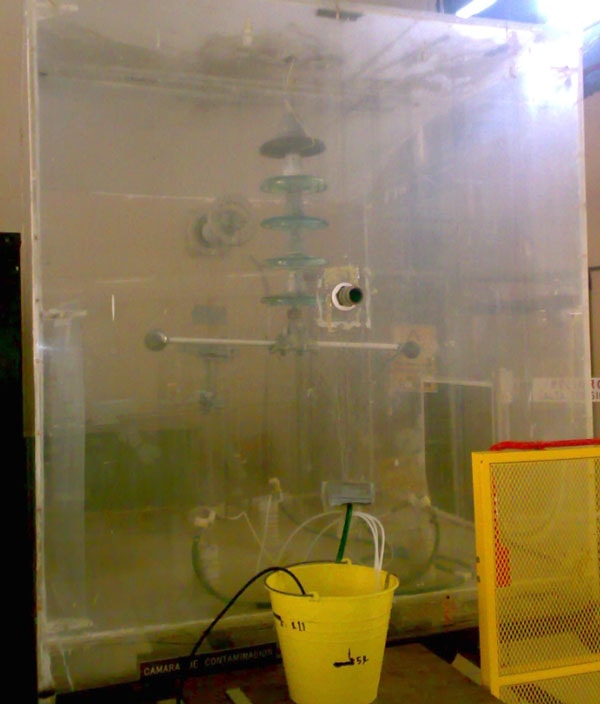
Wetting was generated by a nozzle system (according to IEC 60507) but in this case the water was previously heated to 50°C in order to simulate the condition that occurs in cooling towers. The test of wetting the 4 insulator string with tap water was carried out first followed by the test of wetting them with water obtained from the cooling towers.
Test Results
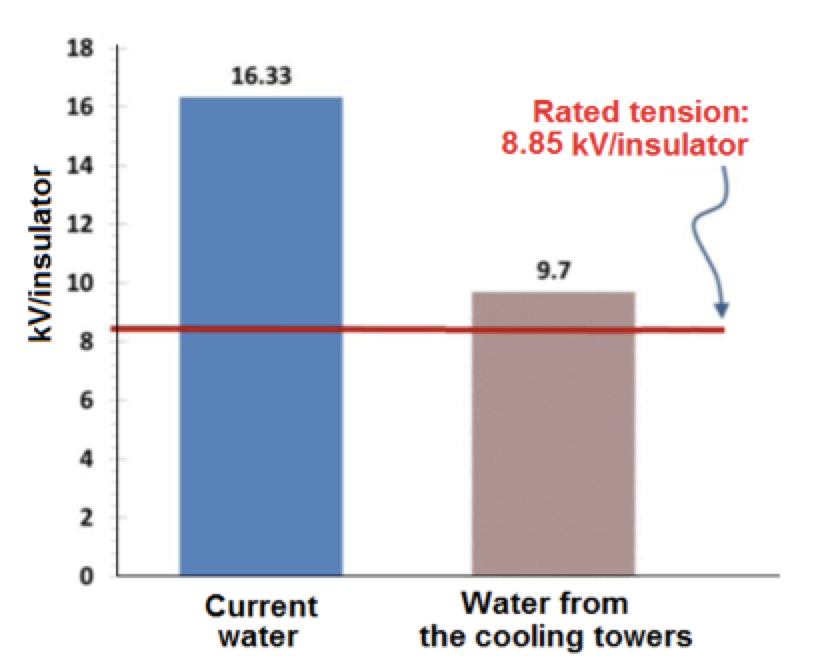
Fig. 13 shows results from tests performed to evaluate the effect of vapor that comes from cooling towers at the Francisco Villa Thermal Power Plant. As can be observed, if insulators are wetted with water from the cooling towers, their U50% per insulator decreases significantly, i.e. by about about 41% compared to the voltage obtained when wetting with tap water, as recommended for standard tests. This value is only about 10% higher than the rated value of the insulator. Hence, pollution flashover risk is high under the conditions to which external insulation is exposed at the Francisco Villa Substation. This risk only increases if the electrical system reaches maximum overvoltage or if pollution accumulation on insulators at the site is allowed to continue without remedial action.
Conclusions & Recommendations
According to critical flashover voltage values obtained experimentally, high water conductivity at the Francisco Villa Thermal Power Plant and the accumulation of pollutants on the surface of nearby insulators significantly decreases their withstand voltage value. It can be concluded that reduction of withstand voltage is the main cause of pollution flashovers and related power outages at the Francisco Villa Substation since specific insulation leakage distances are equal to or less than 20 mm/kV. Clearly, the specific leakage distance of insulation at this site has to be improved. Based on analysis of information recorded by the CMS as well as on results obtained in the test laboratory, it is recommended to perform insulation coordination of the substation considering a heavy pollution level such that the specific leakage distance must be at least 31 mm/kV from phase-to-earth, according to IEC 60815-2. The CMS at the substation detected leakage current activity about a month ahead of the flashover failure. It is therefore also necessary to inspect the management of these alarms so that preventive maintenance can be done as soon as the CMS registers a level of risk. Washing insulators at the substation should ideally be done starting at the 230 kV area because it lies closest to the cooling towers.
The authors express gratitude to staff of the Camargo Transmission Zone for their support in this work. Special thanks to Engineer Saúl Ramirez and to José Ángel Ávalos.

References
• IEC/TS 60815-1, Selection and dimensioning of high-voltage insulators intended for use in polluted conditions. Part 1: Definitions, information and general principles.
• IEC/TS 60815-2, Selection and dimensioning of high-voltage insulators intended for use in polluted conditions – Part 2: Ceramic and glass insulators for a.c. systems.
• F. Mitrea, A. I. Lacerdab, R. F. de Lacerdac. Modeling and simulation of thermoelectric plant of combined cycles and its environmental impact, Revista da Engenharia Térmica, Vol. 4, No. 1, pp. 83-8, 2005.
• Montoya, I. Ramirez and J. I. Montoya, Correlation among ESDD, NSDD and leakage current in distribution insulators, IEE Proceedings-Generation, Transmission and Distribution, Vol. 151, No. 3, pp. 334-40, 05/15, May 2004.
• Montoya, I. Ramirez and R. Hernandez, The leakage current as a diagnostic tool for outdoor insulation, 2008 IEEE/PES Transmission and Distribution Conference & Exposition: Latin America, Bogota, Colombia, 2008.
• Yong Zhu, Haji, K., Otsubo, M., Honda, C., Harmonic analysis of leakage current in salt-fog aging test for polymeric material, Japanese Journal of Applied Physics, Part 1, Vol. 45, No. 11, pp. 8853-7, Nov. 2006.
• El-Hag, A.H, S.H. Jayaram, E.A. Cherney, Fundamental and low frequency harmonic components of leakage current as a diagnostic tool to study aging of RTV and HTV silicone rubber in salt-fog, IEEE Transactions on Dielectrics and Electrical Insulation, Vol.10, No.1, pp.128-36, Feb. 2003.
• Vosloo, W.L., Holtzhausen, J.P., The prediction of insulator leakage currents from environmental data, IEEE AFRICON, 6th Africon Conference in Africa, 2, No., pp.603-8, George, South Africa, South Africa, Oct. 2002.
• Ling Zhao, Jianwu Jiang, Shaohui Duan, Chunhua Fang, Jianguo Wang, Kang Wang, Pingmei Cao, Jian Zhou, The prediction of post insulators leakage current from environmental data, Electrical and Control Engineering, International Conference on Electrical and Control, pp.5103-6, Yichang, China, Sept. 2011.
• IEC 60507, Artificial pollution tests on high-voltage insulators to be used on a.c. systems.
• J. Lambeth, H.M. Schneider, Y. Beausejour, D. Dumora, T. Kawamura, G. Marrone, J.H. Moran, K. Naito, R.j. Nigbor, Final Report on the Clean Fog Test for HVAC Insulators, IEEE Transactions on Power Delivery, Vol. 2, No. 4, pp. 1317-1326, Oct 1987.