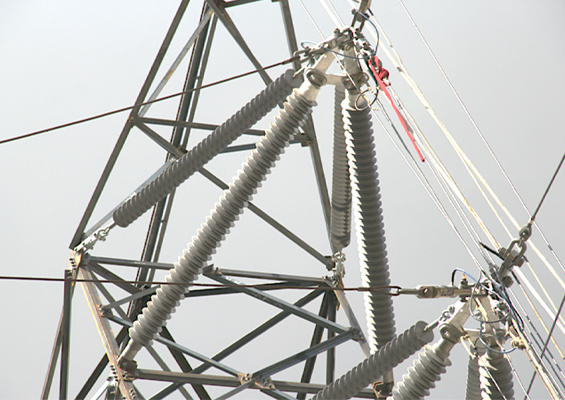
Polymeric insulators are widely deployed in power transmission and distribution networks due to their low weight, excellent hydrophobicity, and superior pollution performance compared to porcelain or glass. However, under prolonged exposure to environmental and electrical stresses–including ultraviolet radiation, surface discharges, temperature fluctuations, humidity, altitude, and contamination—the silicone rubber housing undergoes physico-chemical ageing. This degradation results in gradual loss of hydrophobicity, reduction of electrical insulation strength, and ultimately compromises long-term reliability of a power system. While mechanical failures are now relatively rare, electrical failures arising from surface degradation, partial discharges, and flashovers represent a dominant mode of polymeric insulator failure.
To better understand these processes, studies investigated ageing mechanisms and characterization techniques. Among these, spectroscopic methods are valuable to probe for chemical changes at the molecular level. For example, attenuated total reflection Fourier transform infrared spectroscopy (ATR-FTIR) provides high surface sensitivity, enabling detection of subtle modifications in the top microns of the polymer sheath. This technique has been successfully employed to monitor degradation pathways induced by ultraviolet exposure, corona discharge, salt fog, acid rain, and natural ageing in service.
Conventional ageing evaluation tests such as the Tracking Wheel method apply high voltage to the complete insulator assembly, but they provide limited spatial resolution of damage location and typically require long durations. Similarly, the inclined plane test (IPT) is widely used in both industry and research, but aggressive electrical stress often leads to excessive surface destruction, making it unsuitable for subsequent spectroscopic analysis.
This edited contribution to INMR by Kavin Bhuvan and Prof. Dennis K. Hore of the University of Victoria in Canada as well as Rajkumar Padmawar of ASAsoft (Canada) discusses an IPT-inspired ageing test capable of reproducing realistic environmental stress while preserving the surface sufficiently for spectroscopic evaluation. The approach enables analysis of insulator sheds extracted from both in-service components and laboratory-aged specimens, providing insight into spatial variations in surface chemistry and correlating observed molecular changes with electrical performance. Preliminary results of this methodology are also presented and discussed.

Motivation for New Set-Up
The IEC 60587 inclined plane test (IPT) is a well-established standard for evaluating the resistance of insulating materials to tracking and erosion under severe electrical and environmental stress. It is widely used by both manufacturers and utilities to assess the quality of polymeric housings. The IPT is destructive in nature and typically provides results within 6 hours, making it one of the most common routine tests.
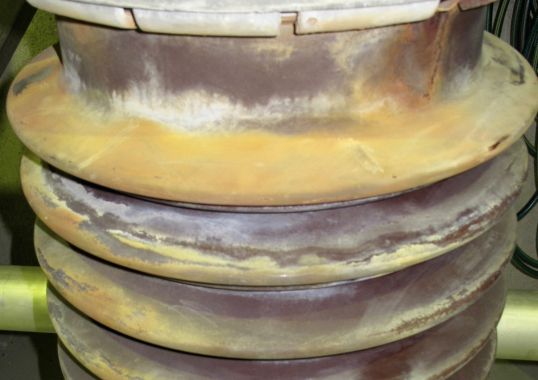
While routine and design tests ensure product quality at the manufacturing stage, there is no standardized method for monitoring the long-term surface condition of polymeric insulators in service. The CSA tracking wheel test offers a means to evaluate complete insulator assemblies under accelerated ageing but requires nearly 3 months to obtain a single dataset. In earlier work with tracking wheel-aged insulators, it was observed that surface degradation occurred in random locations, making it difficult to identify and analyze damaged regions with high resolution.
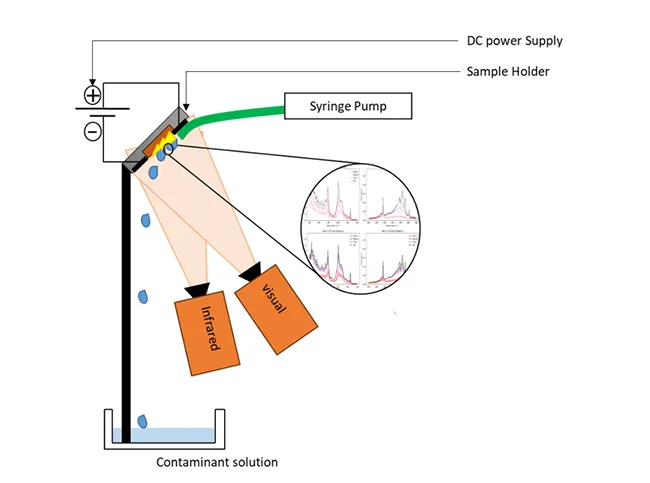
The motivation for developing a micro-inclined plane test (μ-IPT™) as shown in Fig. 1) was:
• to reduce the prolonged testing time associated with tracking wheel experiments;
• to overcome the spatial randomness of electrical degradation; and
• to produce controlled surface ageing without extensive visual damage.

Components
The components of μ-IPT™ are similar to IPT, but certain design modifications were made to get a working end product.
1. Sample holder
2. Electrodes
3. Programmable power supply
4. Computer controlled syringe Pump
5. Cameras
1. Sample Holder
One challenge in assessing service-aged insulators is the inherent spatial variability of surface degradation. This becomes particularly problematic when the applied electrical stress produces only minimal damage, with little or no visible evidence of degradation. In the case of μ-IPT, samples are extracted from manufactured insulators, where sheds are molded at an angle to facilitate water droplet roll-off. While this geometry is beneficial in service, it complicates laboratory testing by making uniform surface contamination difficult to achieve.
To address these challenges, a custom-designed sample holder was developed. The holder stabilizes the angled shed sections, ensuring consistent orientation during testing, and enables controlled contamination of the surface. This configuration allows localized and repeatable application of electrical stress, thereby improving the reliability of subsequent spectroscopic analysis.
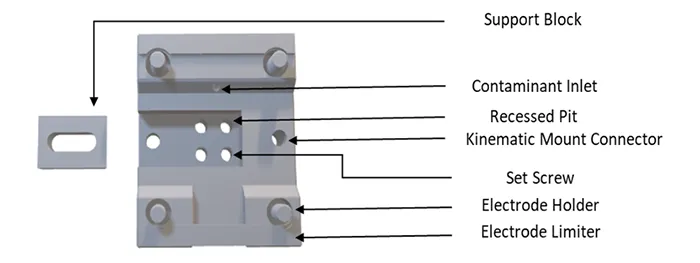
Depth Setter: A 15×15 mm specimen was cut from a manufactured polymer insulator using a die to ensure dimensional consistency. One of the challenges with such samples is the variation in shed thickness. For μ-IPT testing, a flat surface is required to allow uniform runoff of the contaminant solution. To achieve this, the holder incorporates set screws located at the corners of a base plate. By adjusting the threaded screws, the specimen can be leveled, ensuring a flat and reproducible testing surface.
Support Block: A lateral support block slides into the holder and secures the specimen in place as shown in Fig. 2. The block includes a small ledge that grips the sample while coupling to a Thorlabs kinematic mount. The kinematic mount provides fine adjustment capability, allowing precise control of the contaminant flow direction across the specimen surface.
Electrode Supports: Raised platforms within the holder ensure reliable electrode–sample contact. The electrode support structure allows electrodes to slide into position and lock via threaded connections with retaining nuts. To maintain uniform electrode spacing across multiple tests, a limiter block is integrated into the holder, preventing the electrodes from advancing beyond a preset position. This feature ensures reproducibility and consistent electrical stress application.
Contaminant Inlet: An inlet is incorporated at the upper side of the holder to accommodate a tubing connection, enabling controlled delivery of the contaminant solution onto the specimen surface.

2. Electrodes
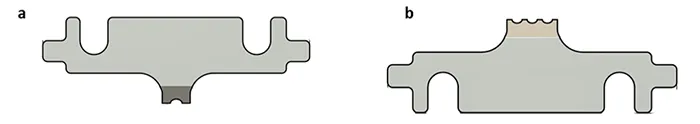
The electrode configuration for the μ-IPT™ was adapted from the standard IEC 60587 inclined plane test (IPT), with modifications to accommodate the reduced sample size. The top electrode (Fig. 3a) incorporates a 1mm diameter opening to allow the contaminant delivery tube to pass through and ensure direct contact of the solution with the specimen surface. The bottom electrode (Fig. 3b) is designed with four protruding teeth to provide multiple contact points, facilitating reliable completion of the conductive path. Both electrodes are equipped with spade connectors for seamless integration with the high-voltage supply. In addition to establishing the electrical circuit, the electrodes mechanically stabilize the specimen, preventing displacement when positioned at the required 45॰ test angle.
3. Power Supply
Stanford Research Systems PS350 high voltage power supply was employed to apply the test voltage. The unit provides a maximum output of 5000V with a current limit of 5 mA. This is a lower current capacity when compared to a typical IPT power source, it is suitable for μ-IPT™ as it minimizes visible surface damage while still inducing degradation to the sample. The power supply has an internal microcontroller, which enables automated data acquisition of set voltage, electrode voltage and current by a computer via Python. These parameters were continuously logged as CSV file for analysis.
4. Control Pump
A computer-controlled pump was used to deliver the contaminant solution. The was connected to the specimen via a tube. Python-based control allowed full operation, including setting the flow rate, starting and stopping delivery, and activating the purge mode to produce a continuous stream of solution. This level of control ensured consistent and repeatable contaminant application to the test surface.
5. Cameras
To monitor surface discharges during testing, the μ-IPT system integrated both a visible-light camera and a portable thermal camera. The visible camera was operated via OpenCV in Python, enabling frame capture and image processing in real time. The thermal camera was interfaced using AutoHotkey scripts triggered from Python, allowing synchronized thermal imaging of discharge activity. Together, the imaging system provided complementary visual and thermal diagnostics of the degradation process.

Experimental Procedure
Sample Preparation
A 15×15 mm sample is cut out of an insulator shed using a custom dye to ensure uniformity. The sample was cleaned with isopropyl alcohol and distilled water, followed by sonication to remove any surface impurities. The specimen was then air dried at room temperature before being placed in the recessed pit of the sample holder. A support block was inserted to prevent displacement when the set screws were used for leveling. A feeler gauge was employed to confirm that the top surface was flat.
Assembly
The holder was mounted onto a kinematic mount to enable precise adjustment of the contaminant solution flow direction. The electrodes were inserted into their respective slots and fastened with custom nuts. A contaminant solution was loaded into a syringe and delivered through a tube connected to the sample holder. The positive and negative leads of the DC power supply were connected to the top and bottom electrodes, and the applied voltage was set.
Voltage Selection
Preliminary studies were used to determine the optimal test voltage for the μ-IPT™ configuration. Voltages below a threshold value resulted in erosion-dominated degradation rather than surface discharges, whereas voltages above another threshold led to arcing between the electrodes. Thus, an optimum voltage provided controlled surface discharges while minimizing visible surface damage, making it the most suitable condition for subsequent spectroscopic analysis.
Instrumentation & Control
A Python-based control framework was implemented to coordinate the syringe pump, high-voltage supply, and cameras. The computer-controlled pump was connected via RS-232 and controlled through custom Python functions, enabling automated start, stop, flow-rate control, and purge operations. A high-voltage source was interfaced through a GPIB connection using the VISA library, allowing real-time adjustment of input voltage, maximum current, and trip values. Voltage and current between electrodes, as well as set voltage, were continuously logged and stored as CSV files. The visible-light camera was operated through OpenCV, while the thermal camera was controlled using AutoHotkey scripts triggered from Python. Both cameras were synchronized with the high-voltage and pump operation, and a new data file was generated for each test.
Test Procedure
At the start of each test, the sample was wetted using the syringe pump’s purge function before applying high voltage. During operation set voltage (VSET), voltage between the electrodes (VOUT) and current between the electrodes (IOUT) were continuously monitored. If the output current was above a threshold, the test was continued; if the current dropped below this threshold, the loop was terminated, and the iteration was completed. The process was repeated for a user-defined number of iterations.

Electrical Data from μ-IPT™
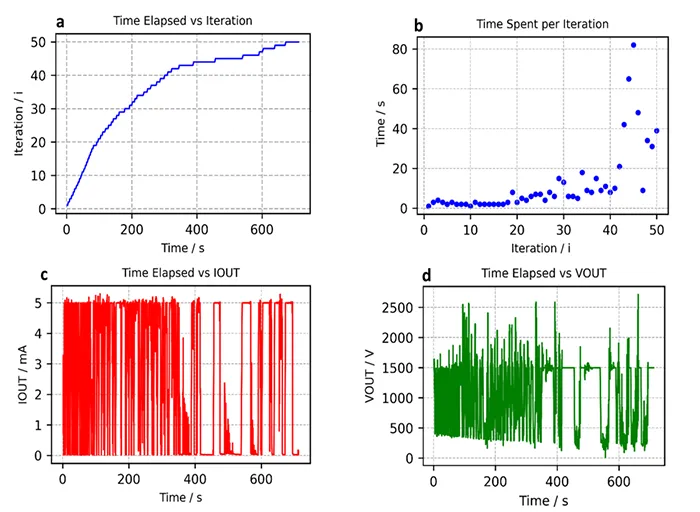
The μ-IPT™ collects electrical data from the DC power supply. A sample was subject to DC electrical stress for a total of 50 iterations. Total time elapsed was compared against total number of iterations, as shown in Fig. 4a. An increase in the time under stress was seen as number of iterations increased. The first 40 iterations were completed in about 300s, but the remaining 10 iterations took close to 400s. Fig. 4b shows how much time was spent on each iteration (ΔT) under an electrical stress. The total test time is close to 700s and the time under electrical stress for each iteration increases. For the first 10 to 20 iterations, ΔT is around the range of 2 to 6s except for the 19th iteration where the time under stress is close to 10seconds. As number of iterations increases, time under electrical stress increases and more randomness is observed. The electrical data of Fig. 4c IOUT and Fig. 4d. VOUT also shows increase in duration of time under electrical stress which could be observed by the increasing blank space. This could be attributed to loss of hydrophobicity which could be confirmed by looking at the visual feeds from the cameras where the water spreading on the surface could be observed.
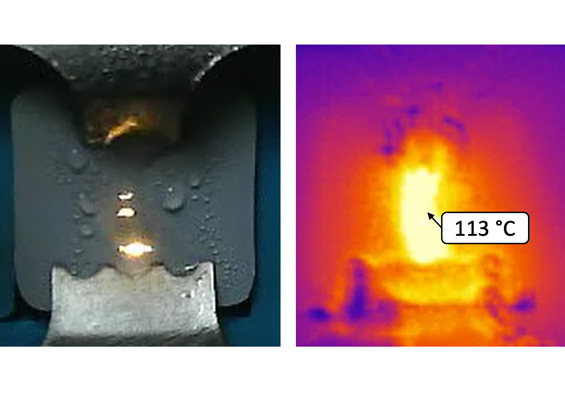
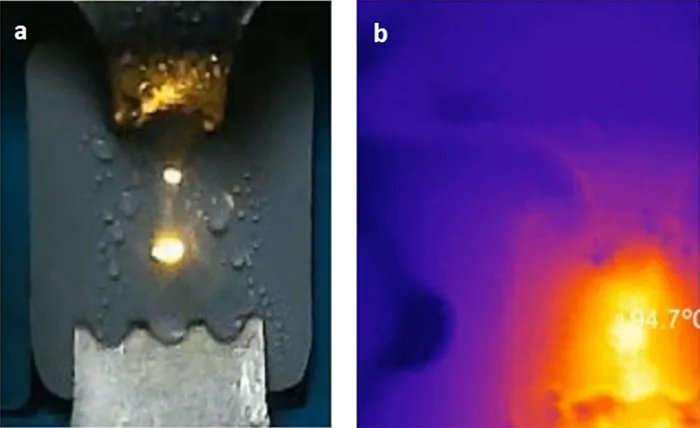
White Light & Thermal Image Data from μ-IPT™
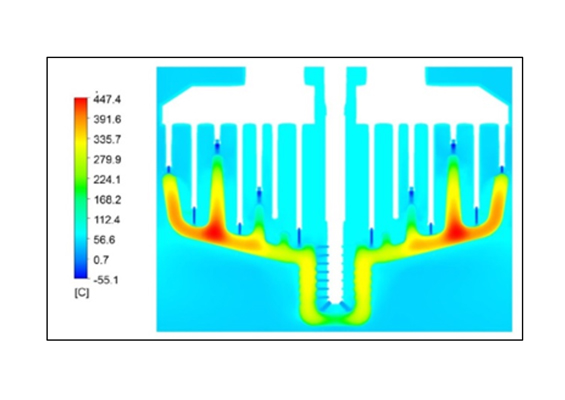
The μ-IPT™ setup employed a white-light camera (Fig. 5a) and a thermal camera (Fig. 5b) to monitor surface discharge activity and identify regions of interest for subsequent vibrational spectroscopic analysis. The white-light recordings captured the initiation and propagation of dry-band arcing, while the thermal images provided complementary information on surface heating and heat distribution across the specimen. Analysis of the thermal data revealed an overall increase in surface temperature during testing, with localized hotspots coinciding with dry-band arcing regions. Together, the optical and thermal imaging streams served to validate the electrical measurements and guided the selection of spectroscopic sampling locations.
Spatially-Resolved ATR-IR Data
ATR-FTIR spectroscopy is a predominantly used technique which is used to characterize insulators that undergo various stress environments. We used ATR-FTIR to understand what happens to the top micron of an insulator sample that undergoes ageing in the tracking wheel in our previous paper. What was noticed was a decrease in absorbance of different IR bands of functional groups such as Silicone backbone, methyl group and ATH as a function of tracking cycle. But a major challenge was trying to locate regions where surface disruption has occurred. This can be overcome by using μ-IPT™. Fig. 5, compares the average of spectra collected from a pristine (blue) and μ-IPT™ aged sample (red). There is a clear distinction between the individual spectra, and the standard deviation shows that the individual spectra do not overlap. One observation noticed in the sample that underwent μ-IPT™ was that there were regions where surface discharge occurred and regions where no surface discharge occurred. The regions with surface discharge would be closer to the center of the sample while the corners closer to the top electrode had no surface discharge.
This could also be confirmed with visuals from thermal and visible cameras. When the unaffected regions of μ-IPT™ aged samples were observed under ATR-FTIR, something interesting was observed. The spectra (green) is similar to a pristine sample. The region between affected and unaffected region was also observed and the average was somewhere between affected and unaffected spectra and the standard deviation was wide. This shows the need for selecting the right region to observe. Based on region of choice, outcome could change considerably.
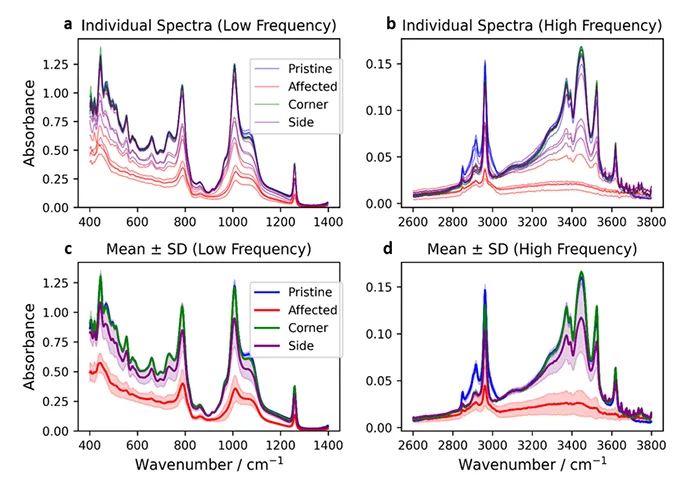
Some preliminary observations made are the spectral peaks centered at 555, 663, and 733 cm−1 correspond to Al–O bending and stretching vibrations for the ATH filler. IR bands centered at 789, 1010, and 1262 cm−1 reflect Si–(CH), Si–O–Si (backbone), and Si–CH bending modes, respectively. The high-frequency region from 2800 to 3700 cm−1 is shown in (figure 6b) to reveal the effect of μ-IPT on the methyl stretching mode at 2965 cm−1 and within the spectral range 3200–3700 cm−1 for the OH modes. The peaks almost do not exist in the affected area when compared with pristine or unaffected areas. This shows the amount of damage we could do to the material as compared with the tracking wheel. By controlling the applied voltage or the applied iteration, there is a potential to map out how the insulator ages with μ-IPT™ and cross verifying with field aged insulators.
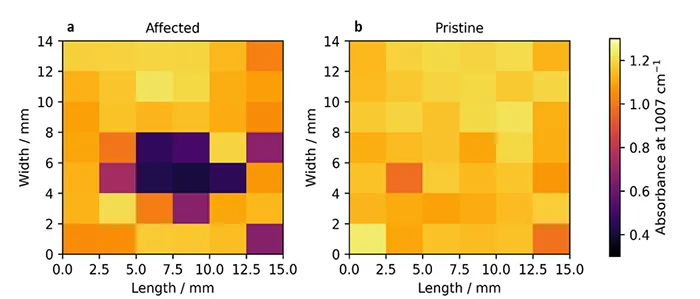
The insulator sample that underwent μ-IPT™ was sonicated to remove any debris and was observed under ATR-FTIR. The sample was moved by 2 x 2 mm step and IR data was collected for the entire sample and the same was done for a pristine sample. The spatial map (figure 7) of an affected and pristine insulator sample’s ATR-FTIR spectra at 1007cm-1 peak, which is contributed by the Silicone backbone. In the pristine sample different absorbance intensities are observed at different locations which may be caused due to the uneven mixing or during the molding process of the insulator or any other reasons and this causes spatial variation and the absorbance is around 1 to 1.2. The sample that was subjected to μ-IPT has more spatial variation (0.3 to 1.3) and the Δ absorbance is close to 1. The locations where dry band arcing occurred under μ-IPT has low absorbance when compared to other regions in the sample. Doing spatial mapping gives us a complete picture of the sample and we could easily identify the regions that had surface damage and the regions that did not have surface damage. This is important when shift our efforts towards lifetime prediction of the sample, because based on the location the spectra are collected, the results could vary substantially.

Conclusions
With the novel μ-IPT™ apparatus and measurement protocol, samples from manufactured insulators were subjected to electrical stress under various environmental conditions. This enabled identifying regions where surface discharge occurred, highlighting clear differences between affected and unaffected areas.
Such data can be analyzed to assess health of insulators specific to their unique geography and environment. These types of insights are crucial for overhead line and substation assets, facilitating preventive maintenance, reducing system outages, and helping modernize the grid for greater resilience.

Acknowledgments
We are grateful to the Natural Sciences and Engineering Council of Canada (NSERC) for supporting this research through Discovery (RGPIN-2020-06030), Discovery Accelerator (RGPAS-2020-00049), Engage (539943-2019), Collaborate Research and Development (514186-2017), and Alliance (571104-2021, 597661-2024) grants. Some of those programs were in partnership with Mitacs and ASAsoft® (Canada) Inc.
References
1. Xiong, Y.; Rowland, S. M.; Robertson, J.; Day, R. J. Surface Analysis of Asymmetrically Aged 400 kV Silicone Rubber Composite Insulators. IEEE Trans. Dielectr. Insul. 2008, 15, 763–770.
2. Ghosh, D.; Khastgir, D. Degradation and Stability of Polymeric High-Voltage Insulators and Prediction of Their Service Life Through Environmental and Accelerated Aging Processes. ACS Omega 2018, 3, 11317–11330.
3. Venkatesulu, B.; Thomas, M. J. Long-Term Accelerated Weathering of Outdoor Silicone Rubber Insulators. IEEE Trans. Dielectr. Electr. Insul. 2010, 18, 418–424.
4. El-Hag AH, Simon LC, Jayaram SH, Cherney EA. Erosion resistance of nano-filled silicone rubber. IEEE Trans Dielectr Electr Insul. 2006;13:122–8.
5. Han, D. H.; Cho, H. G.; Han, S. W. Effects of Alumina Trihydrate on the Electrical Insulation Properties of HTV Silicone Rubber. In Proceedings of the 7th International Conference on Properties and Applications of Dielectric Materials; IEEE: Nagoya, 2003; pp 381–384.
6. Kim, J.; Chaudhury, M.; Owen, M. Hydrophobicity Loss and Recovery of Silicone HV Insulation. IEEE Trans. Dielectr. Electr. Insul. 1999, 6, 695–702.
7. Kaaiye, S. F.; Nyamupangedengu, C. Comparative Study of AC and DC Inclined Plane Tests on Silicone Rubber (SiR) Insulation. High Volt. 2017, 2, 119–128.
8. Akbar, M.; Ullah, R.; Alam, S. Aging of Silicone Rubber Composite Insulators under Multi-Stressed Conditions: A Review. Mater. Res. Express 2019, 6, 102003.
9. Verma, A. R.; Reddy, B. S. Accelerated Aging Studies of Silicon-Rubber Based Polymeric Insulators Used for HV Transmission Lines. Polymer Testing 2017, 62, 124–131.
10. Fletcher, H. P.; Macdonald, A.; Secord, C.; Lenckowski, M.; Padmawar, R.; Hore, D. K. Design and Construction of an Advanced Tracking Wheel for Insulator Materials Testing. Can. J. Electr. Comp. Eng. 2020, 43, 342–349.
11. Homma H, Kuroyagi T, lzumi K, Mirley CL, Ronzello J, Boggs SA. Diffusion of low molecular weight siloxane from bulk to surface. IEEE Trans Dielectr Electr Insul. 1999;6:370–5.
12. Raza, M. H.; Khattak, A.; Ali, A.; Butt, S. U.; Iqbal, B.; Ulasyar, A.; et al. Surface Recovery Investigation of Silicone Rubber Composites for Outdoor Electrical Insulation Under Accelerated Temperature and Humidity. Polymers 2021, 13, 3024.
13. Ning K, Lu J, Jiang Z, Xie P, Feng T, Hu J, et al. Aging characteristics and lifespan prediction for composite insulator silicone rubber in a mountainous region environment. Polymer Testing. 2023;122:108023.
14. Gustavsson TG, Gubanski SM, Hillborg H, Karlsson S, Gedde UW. Aging of silicone rubber under AC or DC voltages in a coastal environment. IEEE Trans Dielectr Electr Insul. 2001;8:1029–39.
15. Kaur H, Bhuvan K, Padmawar R, Hore DK. Surface Structural Changes in Silicone Rubber Due to Electrical Tracking. Appl. Spectrosc. 2024, 79, 199-205.