This edited contribution to INMR by Fernando H. Silveira and Silverio Visacro at the Lightning Research Center of the Department of Electrical Engineering at Universidade Federal de Minas Gerais in Brazil explains constraints on applying cumulative peak current distributions of negative first strokes and different representations of current front time to assess lightning performance of transmission lines.
The main characteristics and differences of traditional cumulative peak current distributions are discussed with focus on their application to evaluate the lightning performance of electrical power systems. Also, impact of representing current front time by median value and as correlated parameter with the lightning peak current is assessed. These analyses are based on results obtained by systematic computational simulations with the Hybrid Electromagnetic model and the integration method.
Assessment of the lightning performance of high-voltage transmission lines (TLs) is an important parameter to be considered by electric power utilities to ensure the quality of the power delivered to the consumers. This assessment is associated with the calculation of the number of lightning outages of such TLs, which considers the mechanisms of backflashover and shielding failure. The present work is focused on the backflashover mechanism, which predominates on transmission lines equipped with shield wires that are installed in areas with moderate to high resistivity soils. Also, it considers the assessment of the TL lightning performance related to negative cloud-to-ground flashes, since this event represents more than 90 % of cloud-to-ground flashes and their median peak current is typically two to three times higher than that of subsequent strokes.
Traditionally, calculation procedures determine the backflashover outage rate (BFOR) per 100 km of the TL per year, according with equation (1), where SF is the span factor that accounts for the effect of those lighting strikes along the span, NL is the expected number of lightning strikes to the line (per 100 km per year), and BF% is the probability of backflashover occurrence that consists of the percentage of currents that exceeds the critical current in a cumulative peak current distribution – (%I > IC).
BFOR = SF × NL × (%BF) (1)
The critical current, IC, defined as the minimum value of lightning current able to lead TLs insulators to flashover, has a fundamental role in the lightning performance of transmission lines. It is obtained from the calculation of the overvoltage developed across line insulators due to the simulation of lightning striking tower top and the application of a flashover model to assess the occurrence of backflashover on such insulators.
In this context, lightning return stroke current is the fundamental element that determines insulation failures on electrical systems and may lead to equipment damage and line flashovers. The influence of representations of lightning current, mainly the current waveform and associated parameters such as peak current and current front time is a scientific issue under continuous evolution.
Since lightning current is a random parameter, lightning protection studies adopt cumulative peak current distributions to estimate the probability of a given current value to exceed the critical current of the system.
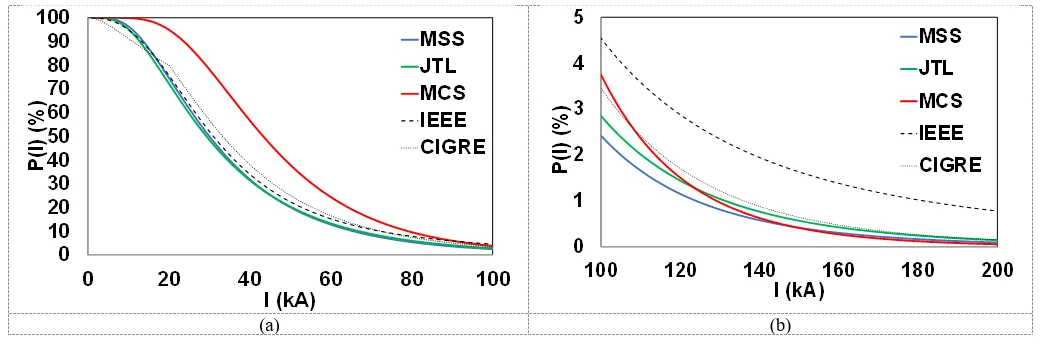
Several cumulative peak current (PC) distributions are presented in literature to be applied in studies of this nature with distinct characteristics and obtained from different measurement methods. In this work, PC distributions are classified as (i) pure distributions, with data obtained only from direct current measurements on instrumented towers, which resemble grounded transmission line towers, and (ii) enlarged distributions, that mixes data obtained from instrumented towers with those provided by indirect measurements using magnetic links, such as those from IEEE and CIGRE standards. Fig. 1 illustrates traditional cumulative peak current distributions presented in literature.

Also, the representation of current front time is an important aspect of influence on the calculated overvoltage across TL insulators and, consequently, on the corresponding critical current, affecting the resulting lightning performance of the transmission line. Most of Td30 front time of first return stroke currents varies in the 1.5-to-10 μs range, as indicated in Table 1.
Considering the current dataset from Mount San Salvatore (MSS) and Morro do Cachimbo (MCS) stations, it is expected that just about 5% of negative first stroke currents may have current front time larger than 10 µs. The dispersion of current front time influences the resulting overvoltage across TL insulators due to direct strikes to the line, affecting the resulting lightning performance.
Two methods to represent current front time on evaluations of the lightning performance of transmission lines are commonly assumed:
• Current front time and peak current assumed as independent parameters. Simulations consider the variation of peak current for a constant value of front time (as the median value, for instance). When the condition for backflashover occurrence is achieved, the critical current is determined.
• Current front time and peak current are considered as correlated parameters, following correlation expression established from measured data of direct lightning stroke currents.
This work addresses the constraints involved on applying peak current distributions and different representations of current front time on the assessment of the lightning performance of TLs, delimiting their application according with the typical critical currents of TLs of distinct voltage level. The presented analyses are supported by results obtained from systematic computational simulations by means of the Hybrid Electromagnetic Model that was applied to represent the transmission lines and associated components and to calculate the overvoltages across TL insulator strings, and the integration method assumed as the flashover model. The traditional considerations in terms of cumulative peak current distributions and front time of negative first strokes were assumed.
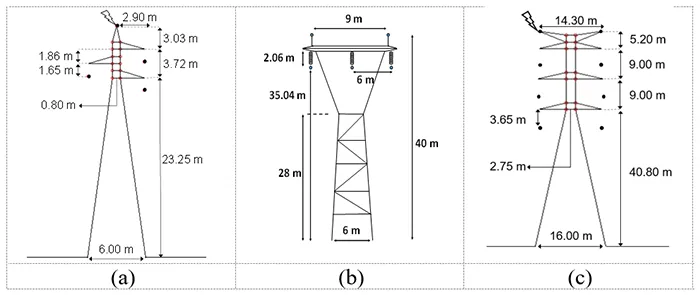
Typical configurations of transmission lines with voltage level of 138 kV, 230 kV and 500 kV with critical flashover overvoltage (CFO) of 650 kV, 1200 kV and 1800 kV, respectively, were assumed in the evaluations. The geometrical configuration of the respective towers, that are of the self-supporting type with heights of 30 m, 40 m and 64 m, are illustrated in Fig. 2. Span lengths of 400 m for the 138 kV and 230 kV TLs, and of 500 m for the 500 kV TL were considered. Tower-footing grounding was represented as a concentrate parameter with a value equal to its first-stroke grounding impulse impedance ZP, varying from 10 Ω to 80 Ω.
The calculation procedure considered the simulation of direct lightning strikes to the top of the towers, the calculation of the resulting overvoltage across TLs insulators by the HEM model and the assessment of the corresponding critical current by applying the integration method on each calculated overvoltage as function of tower-footing impedance ZP. Based on cumulative peak current distributions, the percentage of lightning currents whose peak values exceed the critical current is determined. This number corresponds to the backflashover probability BF %.
Application Of Cumulative Peak Current Distributions
A. Pure distributions
The literature presents pure distributions obtained from direct current measurements on instrumented towers, which resemble grounded transmission line towers. Nowadays, 3 datasets of lightning current measurements have been applied to evaluations of the lightning performance of transmission lines: (a) Dataset of Mount San Salvatore station (MSS), from Switzerland, (b) Dataset of Japanese transmission lines (JTL), from Japan, and (c) Dataset of Morro do Cachimbo Station (MCS), from Brazil. The first two were obtained from measurements at temperate regions, and the latter was obtained at a tropical region.
1. Mount San Salvatore station (MSS): This dataset is related to the measurements performed by K. Berger and coworkers in Switzerland from 1963 to 1971. It is considered the most traditional database of return stroke currents widely applied in evaluations of the lighting performance of electrical systems. It is composed of negative first return strokes. No peak current larger than 90 kA was reported in the negative flashes measured at MSS.
2. Japanese transmission lines (JTL): The Japanese dataset considers 120 measurements of negative cloud-to-ground lightning from 1994 to 2004 at the top of 60 transmission towers of transmission lines. The compiled data exhibits three return stroke currents with peak currents exceeding 100 kA: 104.6 kA, 120 kA and 130.2 kA.
3. Morro do Cachimbo Station (MCS): It is based on 53 first return strokes measured at a 60 m high instrumented tower in the Brazilian southeast and is considered the largest database and the only one with statistical significance obtained from direct measurements of current in tropical regions. The complete MCS database exhibits three flashes with peak currents of 90 kA and higher (90 kA, 144 kA and 153 kA).
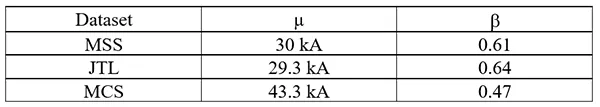
Table 2 presents the lognormal parameters of MSS, JTL, and MCS cumulative peak current distributions.
The analysis of the three pure distributions illustrated in Fig.1 reveals their differences according to the current range. The profile of the MSS and JTL distributions are very close and the similar median values and standard deviations of both distributions explain it. On the other hand, the probability values of MCS distribution are significantly larger in the range of currents below 100 kA, since its median peak current is about 45% larger than those of the other two distributions. For peak currents greater than 100 kA, the MCS distribution keeps larger probabilities up to 120 kA and then tend to values similar to those of MSS.
B. Enlarged Distributions: IEEE & CIGRE
IEEE and CIGRE distributions are both characterized by mixing data obtained from direct measurements from instrumented towers (mainly those from Mount San Salvatore station) and by indirect lightning current measurements obtained in different countries using magnetic links.
IEEE distribution comprises data from both negative and positive strokes, as well as strokes from upward lightning, resulting on 624 measured currents. This distribution can be reproduced from the following equation: P(I) = [1+(Ip⁄31)2.6]-1
CIGRE distribution, also called as two-slope cumulative distribution, is represented by two lognormal distributions, whose parameters are: µ = 61 kA, = 1.33 (for I < 20 kA), and µ = 33.3 kA, = 0.605 (for I ≥ 20 kA and I < 200 kA).
As indicated in Fig.1, the IEEE and CIGRE distributions exhibit similar probabilities in the range of 10 to 100 kA. Above this upper limit, the IEEE distribution exhibits much larger probabilities.
C. Assessing influence of peak current distributions on lightning performance of transmission lines
1. Critical currents:
Table 3 shows the calculated critical currents IC as function of tower-footing grounding impedance for each simulated transmission line, considering the representation of the lightning current by the double-peaked current with median parameters measured at MSS and MCS stations.
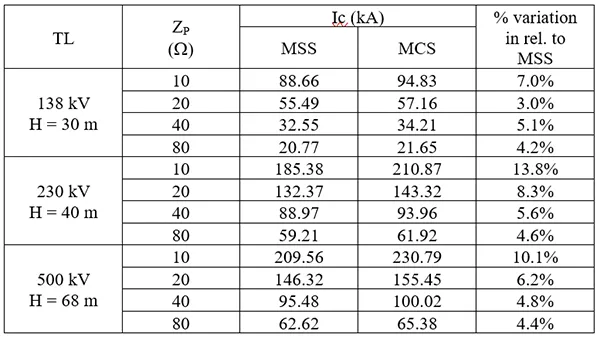
The critical currents associated with the median parameters of MCS are larger, though they are very close to the ones related to MSS. The largest percentage differences are about 7% (138 kV TL), 14% (230 kV TL), and 10% (500 kV TL) related to ZP of 10 Ω.
It is worth noting that the 138 kV TL presents critical currents lower than 100 kA for the whole range of simulated ZP. Furthermore, some specific conditions indicate the existence of critical currents higher than 200 kA. This current value is considered as a superior limit for cumulative peak current distributions.

2. Backflashover Probability – BF%:
Table 4 summarizes the backflashover probability as a function of tower-footing impedance for each cumulative peak current distribution.
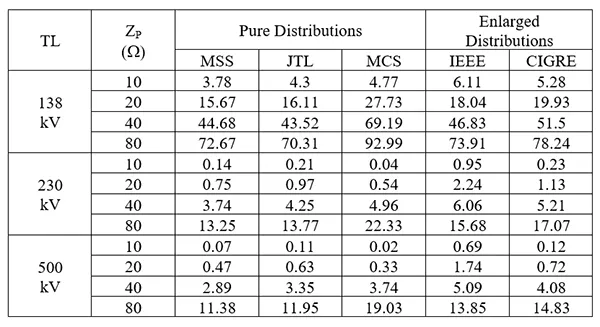
Results indicate different profiles of lightning performance, that are associated with the TL voltage level and the behavior of the peak current distributions for currents around the median peak value and for the range of high currents (I > 100 kA).
For the 138 kV TL, which has a lower insulation level, backflashover probabilities estimated by the enlarged distributions of IEEE and CIGRE are among the results related to the pure distributions of MSS, JTL and MCS. MSS and JTL distribution led to the lowest expectation of backflashover for the entire range of the simulated tower-footing grounding impedance. Their results are also very close to those from IEEE in the 40 Ω to 80 Ω range, with differences at most of 5%. MCS distribution led to the largest probability of backflashover in the 20 Ω to 80 Ω impedance range. Percentage values about 39%, 34%, and 19% higher than CIGRE and 54%, 48%, and 26% higher than IEEE for ZP of 20 Ω, 40 Ω, and 80 Ω, respectively, are obtained when considering the MCS distribution.
Analysis for the 230 kV and 500 kV TLs, which have higher insulation level, shows the use of CIGRE and IEEE distributions overestimating backflashover probability for low to intermediate values of ZP in relation to the results of the pure distributions. Also, the IEEE distribution is responsible for the largest expectation of backflashover.
The MSS backflashover probabilities are about 40% to 22% lower than CIGRE and 85% to 15% lower than IEEE considering the 230 kV TL, and about 39% to 23% lower than CIGRE and 90% to 18% lower than IEEE, considering the entire range of simulated ZP.
For the 230 kV TL, the MCS backflashover probabilities are approximately 83%, 52% and 5% lower compared to CIGRE, and 96%, 76% and 18% lower compared to IEEE for ZP of 10, 20 and 40 Ω, respectively. For the 500 kV TL, the obtained probabilities are 84%, 55% and 8% lower compared to the use of the CIGRE distribution and 97%, 81% and 27% lower compared to the use of the IEEE distribution. For ZP of 80 Ω, the backflashover probabilities associated with MCS are higher than CIGRE and IEEE: +31% and +42% (230 kV TL) and +28% and +37% (500 kV TL).

3. Critical Current as the parameter to determine influence of cumulative peak current distributions:
The obtained range of critical currents depends on the overvoltage withstand of each transmission line. The results indicated critical currents varying from about 20 to 95 kA, 60 to 210 kA, and 62 to 230 kA for 138 kV, 230 kV and 500 kV TLs, respectively.
The 138 kV TL presents critical currents lower than 100 kA. In this range, the currents of MCS distribution presents higher cumulative probability of occurrence, which leads to higher expectation of backflashover. For 230 kV and 500 kV TLs, this picture changes. For ZP values lower than about 50 , critical currents are larger than 100 kA, and the high current range of the distributions is responsible to define the performance of the TL. In this range, the currents of IEEE and CIGRE distribution present a greater probability of occurrence, contributing to high expectation of backflashover. On the other hand, MSS, JTL and MCS distributions present the lowest cumulative probability values for very high currents.
It is important to highlight the need for caution when considering the assessment of the lightning performance for critical currents greater than 100 kA, since the literature reports few measured data in this upper range. For instance, the MSS dataset, that is also considered in the CIGRE and IEEE distributions, does not present measured data of negative downward flashes greater than 90 kA. On the other hand, the JTL and MCS datasets present at least three events each of high currents above 90 kA (JTL: 104.6 kA, 120 kA and 130.2 kA; MCS: 90 kA, 144 kA and 153 kA).
The choice of the distribution to be assumed on the assessment of the lightning performance of transmission lines is a user decision. However, the following points can guide a better choice according to the characteristics of the problem under investigation.
Use of the IEEE distribution for TLs with voltage level of 230 kV and above should be avoided, since the characteristics of the IEEE distribution that presents much higher probabilities for I > 100 kA seems to be resulted from an artifact from the format of the assumed mathematical expression. In this case, using the CIGRE distribution would be considered a conservative approach compared to the adoption of pure distributions.
On the other hand, for 138 kV lines in temperate regions, any of the enlarged distributions would be recommended since they lead to results like those from MSS and JTL. In tropical regions, where, presumably, return stroke currents would have higher peak values, the use of the MCS distribution is preferable.
Discussing Current Front Time Representation
A. Traditional Correlation expressions
The expressions correlating Td30 front time and peak current of CIGRE, that assumes the measured data of Mount San Salvatore, and of Morro do Cachimbo, both recommended by CIGRE Brochure 839 are presented as follows, where Ip stands for the peak current in kA and Tf stands for the Td30 front time in μs.
![]()
Fig. 3 illustrates the current front time profile provided by such expressions as function of peak current for two distinct current ranges: from 20 to 100 kA, and from 100 to 200 kA.
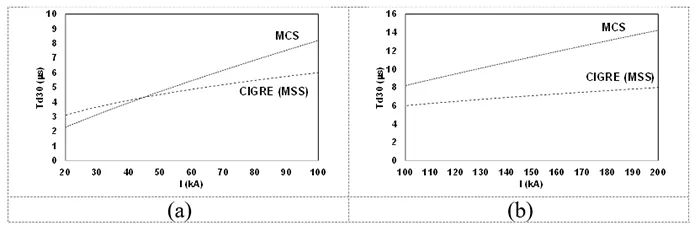
Current front time values given by the correlation expressions are very similar up to 80 kA. The dispersion becomes to be significant for currents higher than 100 kA. It is noted that the MCS expression leads to front time values greater than 10 µs for currents higher than 130 kA, while the CIGRE (MSS) expression does not exceed the front time of 8 µs up to 200 kA.
B. Effect of current front time on critical currents
In this analysis, the return stroke current was represented by a triangular current waveform. Simulations were performed for several values of current front time in the 1 µs to 25 µs range. The time-to-half value was maintained fixed and equal to 75 μs, that is the median value obtained from the measurements at Mount San Salvatore station. The percentage of lightning currents whose peak values exceed the critical current is determined according to the cumulative peak current distributions of CIGRE and Morro do Cachimbo station. The behaviour of the calculated critical currents for the 138 and 500 kV transmission lines as function of the current front time is illustrated in Fig. 4.
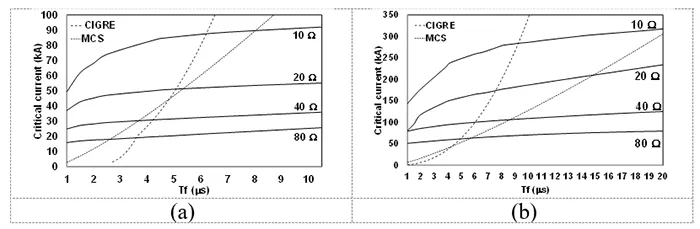
It is observed that the critical currents have a prominent variation for front times between 1 μs to 3 μs, and a slight variation between 3 μs to 10 μs, which becomes even smaller for increasing values of tower footing-grounding impedance. Considering the 3.8 µs to 10 µs front time range, critical currents varying from 84 to 92 kA (10 Ω), 50 to 55 kA (20 Ω), 31 to 36 kA (40 Ω), and 20 to 26 kA (80 Ω) for the 138 kV TL, and from 227 to 286 kA (10 Ω), 147 to 187 kA (20 Ω), 94 to 109 kA (40 Ω), and 59 to 71 kA (80 Ω) for the 500 kV TL are obtained, respectively.
The correlation curves related to expressions (1) and (2) were also included in Fig. 4. The points of intersection between such curves and the curves of critical currents represent the critical current and associated front time that would lead line insulators to flashover respecting the expected correlation between peak current and front time values. Table V summarizes the results. The term Tf_c stands for the critical front time obtained from the intersection points in Fig. 5 and it means the maximum value of front time associated to the critical current that are capable to lead line insulators to flashover.
Considering the CIGRE correlation, the critical front time values are in the range of 9.2 µs to 4.9 µs for the 500 kV TL, for grounding impedance values between 10 and 80 Ω. Considering the MCS correlation, the front time values are in the range of 20.7 µs to 5.7 µs for the 500 kV TL. All these values are greater than the median front time values of MSS and MCS, which are 3.8 µs and 4.2 µs, respectively. The analysis for the 138 kV TL indicates values in the range of 5.7 to 3.1 μs (CIGRE) and 7.4 to 2.3 μs (MCS).
C. Comparing critical currents obtained by median front time and following correlation expressions
Comparison between the critical currents obtained by the correlation expressions and those calculated assuming the median Td30 front times of 3.8 and 4.2 µs from MSS and MCS datasets are shown in Tables 6 and 7 along with the corresponding probability of backflashover occurrence BF(%) estimated by considering CIGRE and MCS cumulative peak current distributions.
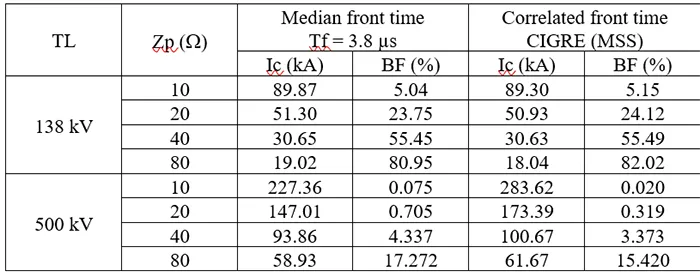
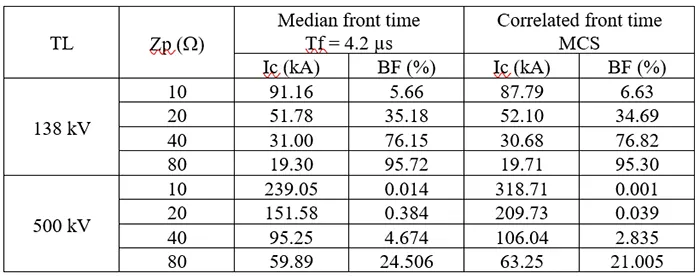
The results assuming current front time with the value equal to the median current Td30 are nearly the same as those estimated by the correlation expressions and for the 138 kV TL. Some small differences are noted when assuming the results for the 500 kV TL, but they are not so relevant, mainly when the analysis is focused on the probability of backflashover occurrence BF%. The greatest increase occurred for cases of Zp of 10 that present values of critical current much higher than 200 kA and, therefore, with an extremely low probability of occurrence.
D. Recommendation for current front time representation
The use of fixed current front time equal to the median Td30 front time may be considered an adequate approach in comparison to the application of correlation expressions, mainly for the range of critical currents lower than 100 kA, typically related to the lightning performance of TLs of 138 kV. For this condition, the use of front time equal to the median Td30 gives nearly the same results related to Td30 correlation expressions. This current range is also associated with tower-footing grounding impedance greater than 40 Ω for 500 kV TLs. For those cases with critical currents higher than 100 kA, the use of median Td30 is also recommended, since the observed difference occurs for backflashover probabilities of the order of 1% and lower, which does not impact the estimated performance.
All the comments and conclusions related to the 500 kV TL also apply for transmission lines with voltage level of 230 kV.
Acknowledgement
This work was supported in part by National Council for Scientific and Technological Development – CNPq, under grants 308775/2025-2 and 316018/2023–6 and by Coordenação de Aperfeiçoamento de Pessoal de Nível Superior – Brasil (CAPES) – Finance Code 001. The authors are thankful for the support of the Graduate Program on Electrical Engineering (PPGEE) of UFMG.
References
[1] CIGRE Brochure 839, “Guide to Procedures for estimating the lightning performance of transmission lines – New Aspects”, WG C4.23, Jun. 2021.
[2] IEEE Guide for Improving the Lightning Performance of Transmission Lines, IEEE Standard 1243-1997, Dec. 1997.
[3] CIGRE Brochure 63, “Guide to procedures for estimating the lightning performance of transmission lines,” WG 01 (Lightning), Study Committee 33, Oct. 1991.
[4] R.M. Gomes, F.H. Silveira, S. Visacro, “Influence of the Distribution of Lightning Strikes along the Span of Transmission Lines on their Backflashover Rate: The Span Factor”, IEEE Trans. Power Del., vol.37, no.3, pp. 1403-1411, Jun. 2022.
[5] F.H. Silveira, F. S. Almeida, S. Visacro, Assessing the influence of peak current distributions of first return strokes on the lightning performance of transmission lines: Instrumented tower distributions versus standard distributions. Electric Power Systems Research, vol. 214, p. 108822, 2023.
[6] F.H. Silveira, F.S. Almeida, S. Visacro, Recommendations related to the Peak-current distributions in studies of lightning performance of transmission lines based on the range of critical currents associated with Backflashover. Electric Power Systems Research, vol. 236, p. 110884, 2024.
[7] K. Berger, R. B. Anderson, and H. Kroninger, “Parameters of lightning flashes”, Electra, vol. 80, pp. 223-237, 1975
[8] J. Takami and S. Okabe, “Observational results of lightning current on transmission towers,” IEEE Trans. Power Del., vol. 22, no. 1, pp. 547-556, Jan. 2007
[9] F.H. Silveira, and S. Visacro, “Lightning Parameters of a Tropical Region for Engineering Application: Statistics of 51 Flashes Measured at Morro do Cachimbo and Expressions for Peak Current Distributions,” IEEE Trans. Electromagn. Compat., vol. 62, no. 4, pp. 1186 – 1191, Aug. 2020.
[10] AIEE Committee Report, A Method of estimating lightning performance of transmission lines, Trans. AIEE 69 (1950) 1187–1196, pt. II.
[11] S. Taniguchi, T. Tsuboi, S. Okabe, Y. Nagaraki, J. Takami, H. Ota, Method of calculating the lightning outage rate of large-sized transmission lines, IEEE Trans. Dielectric. Electric. Insulat. 17 (4) (Aug. 2010) 1276–1283.
[12] F.H. Silveira, S. Visacro, Lightning performance of transmission lines: impact of current waveform and front-time on backflashover occurrence, IEEE Trans. Power Del. 34 (6) (Dec. 2019) 2145–2151.
[13] J.A. Martinez, F. Castro-Aranda, Lightning performance analysis of overhead transmission lines using the EMTP, IEEE Trans. Power Del. 20 (3) (2005) 2200–2210.
[14] C.S. Engelbrecht, I. Tannemaat I., P.L.J. Hesen, Insulation coordination and statistical evaluation of the lightning performance with ATP/EMTP, in: Proc. 2015 Asia-Pacific Intern. Conf. on Lightning. Nagoya, Japan, Jun 2015, pp. 793–798.
[15] S. Visacro, A. Soares J., “HEM: A Model for Simulation of Lightning-Related Engineering Problems”, IEEE Trans. Power Del., vol.20, no.2, pp. 1026-1208, Apr. 2005.
[16] A. Hileman, “Insulation Coordination for Power System”, Boca Raton, FL, USA: CRC Press, 1999.
[17] S. Visacro, F.H. Silveira, “Lightning Performance of Transmission Lines: Requirements of Tower-Footing Electrodes Consisting of Long Counterpoise Wires”, IEEE Trans. Power Del. vol. 31, no. 4, pp. 1524-1532, Aug. 2016.
[18] S. Visacro, “A representative curve for lightning current waveshape of first negative stroke,” Geophys. Res. Lett., vol. 31, L07112, Apr. 2004.
[19] A. De Conti and S. Visacro, Analytical representa-tion of single and double-peaked lightning current waveforms, IEEE Trans. Electromagn. Compat., Vol. 49, No. 2, pp. 448-451, May 2007.
[20] F. H. Silveira, L.C.S. Pires , Y. C. Costa , S. Visacro, A discussion on approaches to consider current front time of linearly rising waveforms applied to the assessment of the lightning performance of TLs according with typical range of backflashover critical currents, Electric Power Systems Research, 245, (2025), 111630.