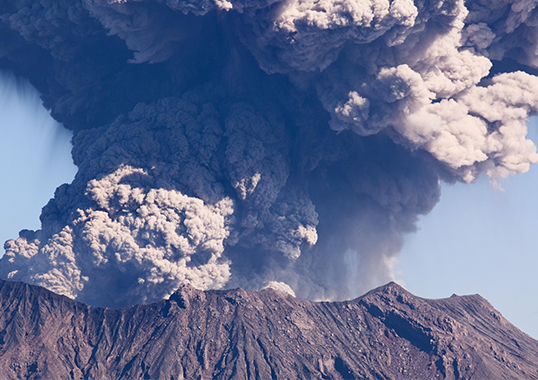
There are some 1500 potentially active volcanoes worldwide and about 500 of these have erupted over recorded history, with many located along the Pacific Rim’s ‘Ring of Fire’. Volcanic eruptions are not isolated events but rather represent a real and constant potential threat to the integrity of electrical systems. Indeed, volcanic eruptions can disrupt power grids across affected regions due to ash-induced flashover of insulators. Yet in spite of ample anecdotal evidence on the risk, only limited data has been assembled on the electrical properties of volcanic ash as well as on its effect on insulator performance.
This edited past contribution to INMR by Johnny Wardman (then at the University of Canterbury in New Zealand) and Igor Gutman of the Independent Insulation Group in Sweden, summarized the physical, chemical and electrical properties of volcanic ash in relation to the characteristics of standard known pollutants. By way of a test case, it also presented results from an investigation into the effects of fallout from a volcanic eruption in Iceland on HV insulation across Scandinavia. Finally, laboratory experiments investigated the comparative influence of volcanic ash contamination on performance of different types of ceramic insulators.

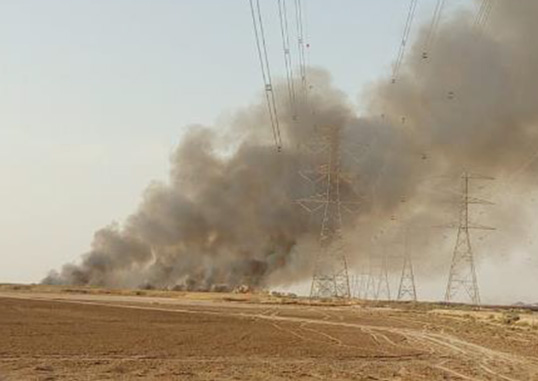
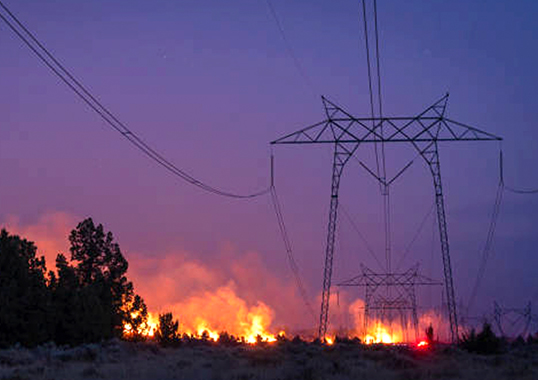
Apart from pyroclastic flows and other highly destructive effects of volcanic eruptions, ash fall is by far the most widely distributed outcome. Indeed, dispersal of volcanic ash across huge areas can cause large-scale disruption of vital infrastructure, such as occurred with air transport throughout Europe during eruption of a volcano in Iceland. Electrical networks including generation sites, overhead lines and substations can also be exposed and vulnerable to heavy ash contamination. The process of ‘standardized’ contamination and flashover performance of insulators has been studied for years and is well summarized in a number of CIGRE publications and IEC standards (e.g. IEC 60815-1, 2, 3) that have grouped pollution sources into: desert, coastal, industrial, agricultural and inland. Considering the limited data available for volcanic ash, however, there seems a need to characterize its physical, chemical, and electrical properties in order to provide better understand ash-induced flashover. The following document compiles information on electrical properties and pollution severity of volcanic ash and presents results from laboratory trials investigating the environmental and electrical parameters that influence flashover voltage of insulators. Critical contamination levels (in terms of ESDD/NSDD) are also identified for insulators operating in service environments at risk of becoming affected by volcanic ash.
Characteristics of Volcanic Ash
Volcanic ash is the result of explosive eruptions and consists of two main components: non-soluble, pulverized fragments of rock, minerals and glass (SiO2); and soluble salts that develop on the surface of ash particles during ash-gas/aerosol interaction within the plume.
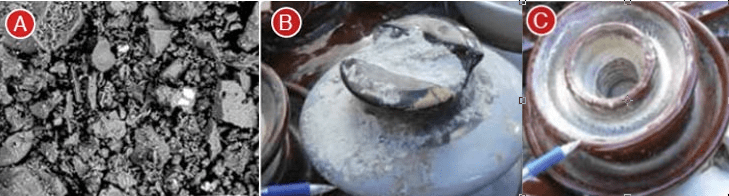
The fragmentation of magma generates variously sized particles, or pyroclasts, that are released into the atmosphere. These can be crystallized lava, glass or crystal fragments and are classified into: ash (particles < 2 mm as shown in Fig. 1); lapilli (2-64 mm); and blocks or ‘bombs’ (> 64 mm). Among these, past studies have suggested that volcanic ash is the most problematic size fraction for electrical and other critical infrastructure.
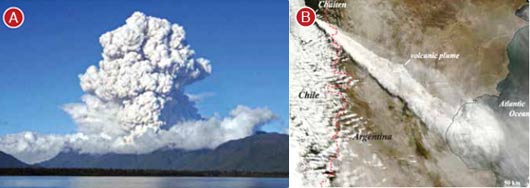
Ash particles ejected from an eruption vent are typically incorporated into an eruption column that can rise tens of kilometres into the atmosphere (see Figure 2a). Eruption plumes are then dispersed by prevailing winds and the ash can be deposited hundreds to thousands of kilometres from the volcano depending on wind, ash grain size, ash density and eruption magnitude (as shown in Fig. 2b). Dry ash is readily mobilized by wind, and can present a hazard to power systems for days to weeks after the initial fallout. Even for small volcanic eruptions (i.e. < 0.1 km3 of erupted material), thousands of square kilometres can potentially be impacted by ash fall.
During explosive eruptions, volatile gases, aerosols, and metals adhere to ash particles during interaction within the volcanic plume. Sulphur and halogen gases and associated anions and cations are adsorbed onto ash surfaces and dry to become soluble salts. This eventually leads to formation of thin salt deposits on the ash surface and these attached salts supply a content of ions to an otherwise electrically inert material. While dry volcanic ash is itself non-conductive, its fine-grained nature allows it to easily retain moisture. Once the attached soluble salts dissolve, ash becomes conductive and a hazard for power systems.
Existing literature in and interviews with experts from Italy, Japan, and Russia confirm that volcanic ash contamination of power systems can disrupt supply (Table 1).
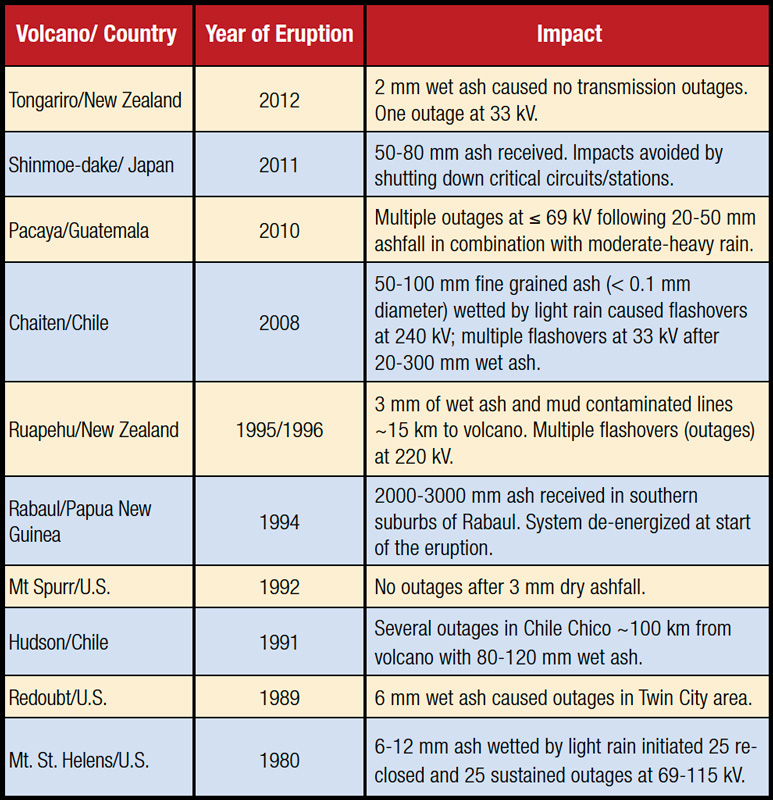
* Ash thicknesses indicate deposit maximums.
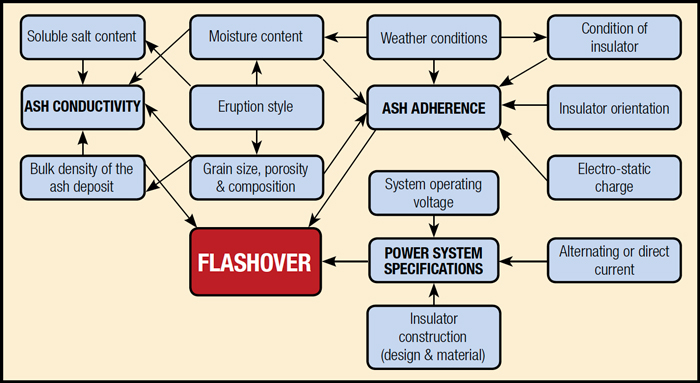
Since several physical and chemical properties of volcanic ash influence its electrical conductivity, many factors can play a role in initiating flashovers (see Fig. 3).
Some general findings from literature and service experience are:
• Dry ash is non-conductive and effectively removed from insulator surfaces by strong wind (e.g. > 40 km/hr) and heavy rain (e.g. >10 mm/hr). Light wetting conditions such as fog, dew or drizzle, however, are primarily responsible for pollution-related flashovers;
• Conductivity of volcanic ash increases with increasing soluble salt load, moisture content and compaction;
• Fine-grained ash (e.g. < 0.1 mm in diameter) is most problematic since it has greater adherence to surfaces and higher surface area, giving a higher soluble salt content and thus greater electrical conductivity when moist. However, other research has found that electrical resistivity of volcanic ash is largely independent of grain size. Of several different ash samples with grain sizes from < 32 μm to 1.4 mm, all exhibited resistivity values < 100 Ωm. This suggests all ash grain sizes (< 2 mm particle diameter) are equally capable of causing ash-induced flashover;
• Preliminary estimates suggest ~ 5 mm wet ash thickness is critical. Assuming a 5 mm thickness and using an approximate ash density of 1.2 g/cm3, the corresponding NSDD level is ~ 600 mg/cm2. This is an exceptionally high amount of contamination and not typical of airborne pollution recognized by IEC 60815-1. In comparison, for example, one of the highest known ESDDs is 12 mg/cm2, recorded in a heavily-polluted industrial area of the former Soviet Union;
• According to some research, if ≥ 30% of the insulator surface (protected creepage distance) remains clean and dry, flashover will not occur.

Electrical Properties
Given absence of a pollution classification for volcanic ash, there has been the need to define the contamination category to which volcanic ash best belongs. Results from comparing its chemical elements with industrial and chemical pollution are presented in Table 2.
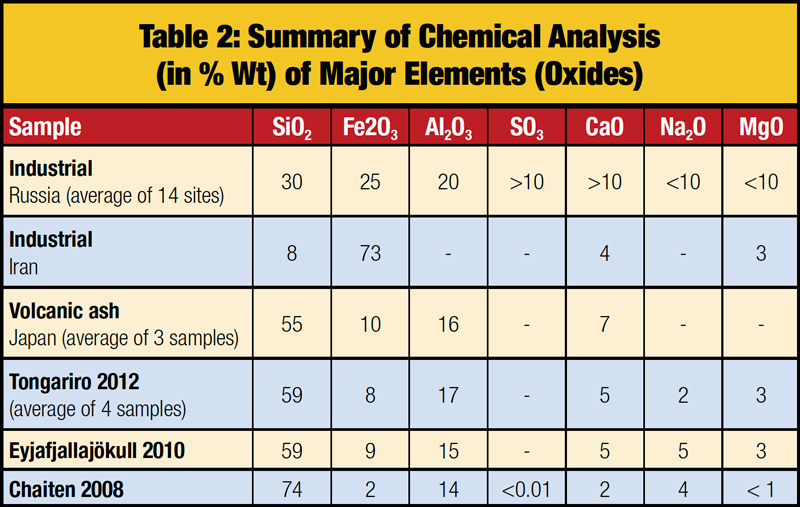
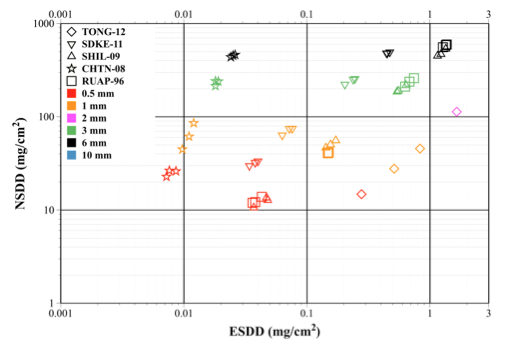
Generally, based on analysis of the distribution of the main oxides, volcanic ash is chemically similar to certain types of industrial pollution. General insulator knowledge in IEC 60815-1 can therefore be used to analyze its possible influence on the dielectric performance of HV insulation. However, lack of standard pollution severity data has made it necessary to estimate the typical ESDD/NSDD ratio associated with a major volcanic ash fall. One recent study found that volcanic ash from different eruptions can vary widely in ESDD and NSDD levels (see Fig. 4) and that the ESDD of volcanic ash increases in a log-linear fashion with increasing NSDD. This is significant considering the possibility of many tens of millimetres of ash accumulation as a result of only a single eruption.
It is understood that the ESDD/NSDD method has some inherent limitations in classifying pollution severity of specific types of salts and volcanic ash. As such, a resistivity method was developed to measure the electrical properties of volcanic ash at the first instance of fallout in order to complement ESDD measurements and other pollution monitoring technique.

Studies at STRI
The April-June 2010 eruption of the Eyjafjallajökull Volcano in Iceland caused disruption of air travel across western and northern Europe. Power companies across the Nordic countries were also unsure of the potential impact on their networks and whether they should prepare to wash substation and line insulators on short notice.

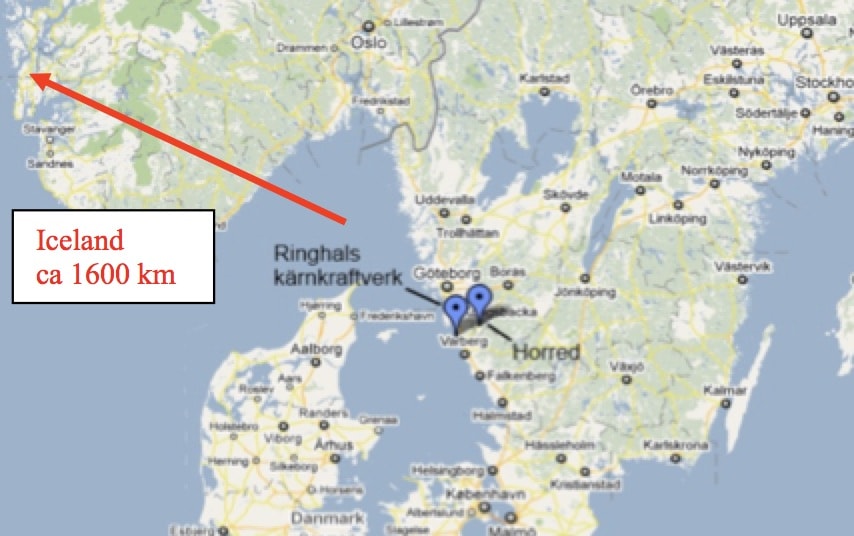
An investigation was therefore carried out that involved studying service experience from other eruptions across the globe as well as laboratory testing of volcanic ash samples taken directly from this particular eruption. The objective was to evaluate possible influence of this ash contamination on dielectric strength of outdoor glass, porcelain or silicone rubber insulators. A first step involved analysis of data from existing airborne pollution monitoring systems. Directional dust deposit gauge (DDDG) measurements according to IEC 60815-1 are performed monthly at two monitoring sites on the west coast of Sweden (Ringhals, located directly on the coast, and Horred 10 km inland – see Fig. 5). The DDDG results obtained for April-May 2010 were then used to evaluate any influence of volcanic ash pollution by comparing them with results from other months as well as the previous year (see Figs. 6a and b).
Indeed, Fig. 6a shows that there was an increase in pollution (conductivity) measured at the Ringhals site from the northerly direction over the months from March to May 2010. There was also an increase in pollution from the west during July 2010.
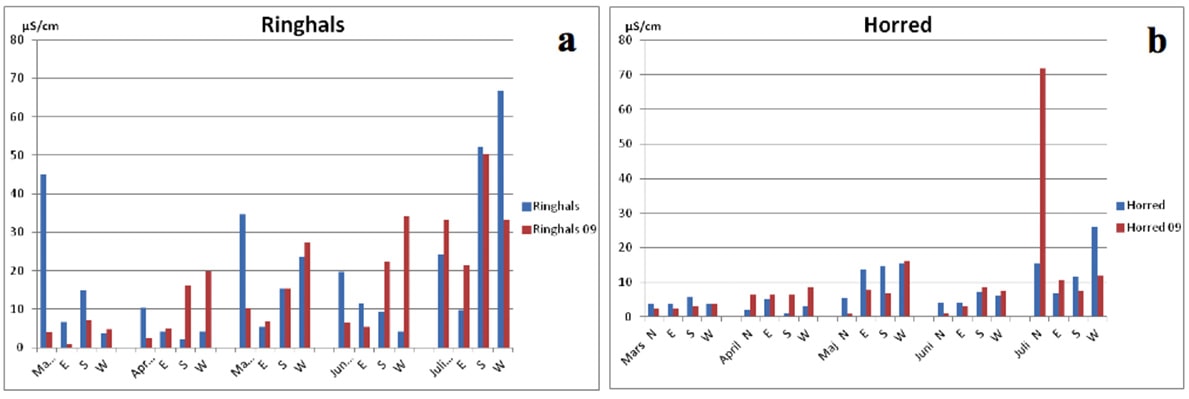
However, irrespective of the apparent increase in pollution and Iceland’s position northwest of the DDDG measurement stations, increases in conductivity at Ringhals during March-July 2010 were likely more due to the influence of the coastal environment (i.e. salt spray contamination). This conclusion is supported by results from the Horred station (Fig. 6b), where (1) the amount of pollution collected was consistently lower than measured at Ringhals despite its relatively close proximity to each other and (2) there was no significant increase in pollution from the northerly and westerly directions during the period from March to July 2010. Had large volumes of ash been transported and fallen on Sweden, it is reasonable to assume that both DDDG sites would have detected associated increased levels of pollution.
The next step in the investigation was finding a relationship between ESDD and NSDD for the 2010 Eyjafjallajökull ash (collected from a farm, located approx. 8 km from the volcano). An ash/water solution (40 g/l ash and distilled water) was prepared for analysis and 6 cm x 6 cm glass plates were artificially polluted using the dipping method and left to dry at an angle of 20°. After drying, ESDD and NSDD were measured regularly over two hours. Using a conservative average of ESDD measurements over this period, it was concluded that a uniform layer of ash with NSDD of 1.0 mg/cm2 corresponded to an ESDD of approx. 0.008 mg/cm2. The final stage of the investigation involved evaluating the possible effects volcanic ash contamination might have on the hydrophobic recovery of silicone rubber insulators. Normally, the water-repellent surface of composite insulators inhibits the formation of conductive films of water, thereby improving flashover performance under wet and/or polluted conditions. However, contaminants with high NSDD and a fast accumulation rate (such as volcanic ash) can overwhelm the natural hydrophobicity transfer of silicone oils. A resistance test was therefore undertaken to assess the influence of volcanic ash contamination on the hydrophobic recovery of silicone rubber insulators.
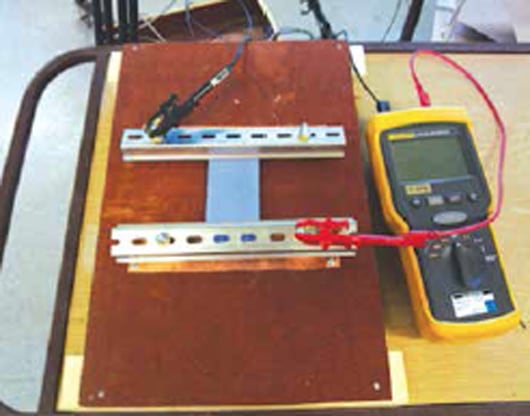
Plates of commercial silicone rubber were pre-conditioned using the Arizona State University method. 40 g/l solutions of Eyjafjallajökull ash/water and kaolin/water (for comparison) were also prepared. The silicone rubber plates were dipped into either the kaolin or ash solutions and placed horizontally on a flat surface. Electrodes were then fixed to 2 sides and resistance of the contamination layer calculated by applying 500 V across the plate and measuring associated leakage current (see Fig. 7).
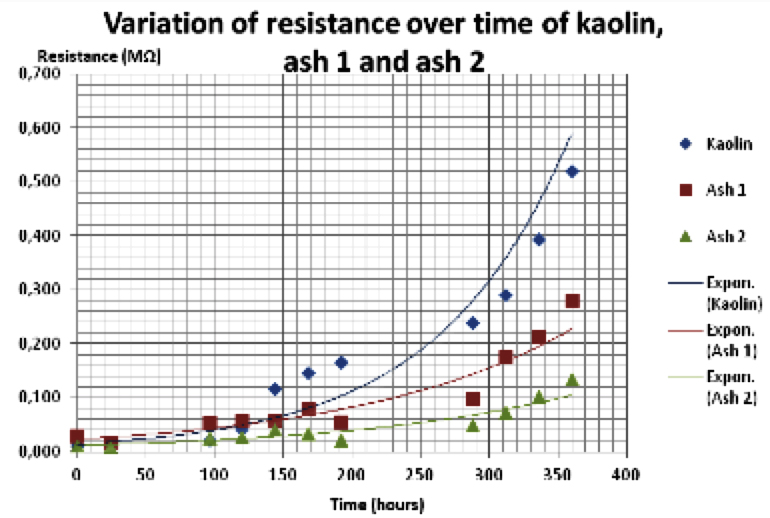
Such measurements were taken every 24 hours for 15 days (Fig. 8). Results suggest the rate of recovery of hydrophobicity is slightly slower for volcanic ash than for kaolin over an elapsed period of time, especially in the case of ash sample #2, which was finer-grained and collected some time after deposition. However, for the first 3-4 days, recovery speed was almost the same for kaolin and for ash sample #1, which was collected within 24 hrs of fallout.

Research at University of Canterbury
Over the past 25+ years, a research group led by the University of Canterbury and GNS Science in New Zealand undertook a systematic study of the impact of volcanic eruptions on critical infrastructure. Investigations found that ash-induced insulator flashover was the most common impact to power systems during and after ash falls. Given the lack of empirical data on the external factors influencing ash-induced flashovers, a need was identified for a systematic analysis of this topic.
While naturally occurring variations in the properties of volcanic ash might introduce additional effects on the flashover voltage of HV insulators, challenges in collecting pristine, unleached ash in the volumes required for pollution testing make it logistically difficult to obtain freshly fallen ash for such analysis. As such, a ‘pseudo ash’ was bulk-manufactured using a proposed methodology that aimed to replicate the chemical, physical and electrical parameters of freshly fallen ash. ESDD values of this pseudo ash showed that a 0.15 M NaCl salt solution added to a 3:1 ratio of ash to brine resulted in an ash whose electrical properties are within the bounds of freshly fallen ash (i.e. resistivity values between 100 and 1000 Ωm for uncompacted deposits). This concentration was therefore used as an appropriate dosing agent for subsequent artificial pollution tests.
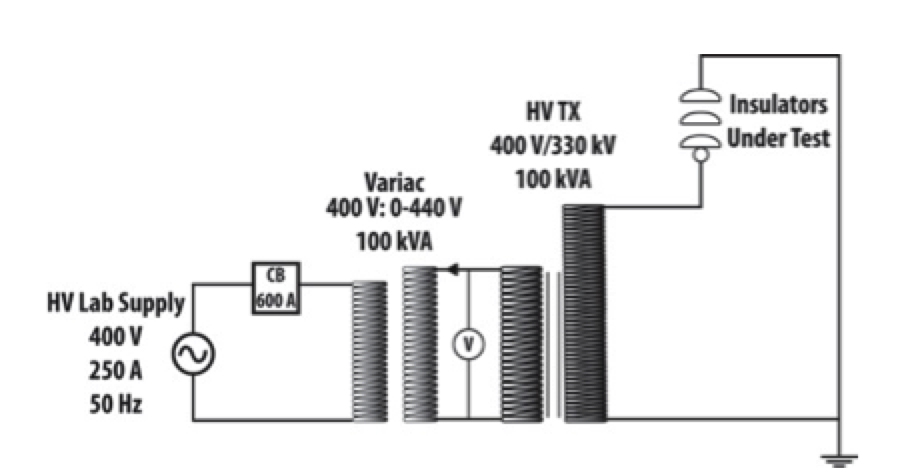
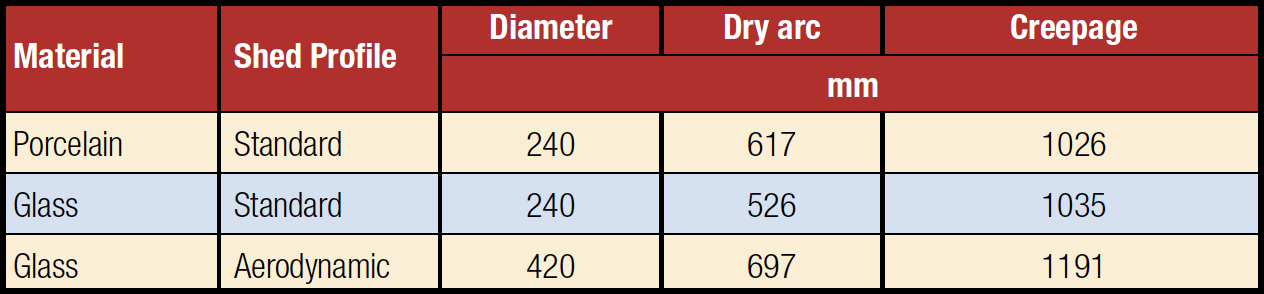
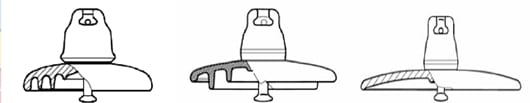
Rapid flashover tests (presently under consideration by CIGRE WG D1.44) were carried out in the HV laboratory at UC. Three ceramic (porcelain or glass) suspension insulators having different profiles and used commonly across New Zealand’s transmission system were chosen for analysis (Table 3, Fig. 10) and each string consisted of 3 insulators.
Standard artificial pollution tests recommend applying pollution by means of spraying, flow-on or dipping techniques. However, considering (1) the importance of retaining soluble surface salts inherent in freshly fallen volcanic ash and (2) the potential for volcanic ash to be deposited in large quantities (e.g. > 10 mm thicknesses), the pollution layer for these electrical tests was applied using dry pseudo ash. Four different ash-contamination scenarios were defined and replicated based on depositional patterns described in the literature and observed in the field. Scenarios were selected as representative of the worst-case, with the entire top and bottom surfaces coated as uniformly as possible.
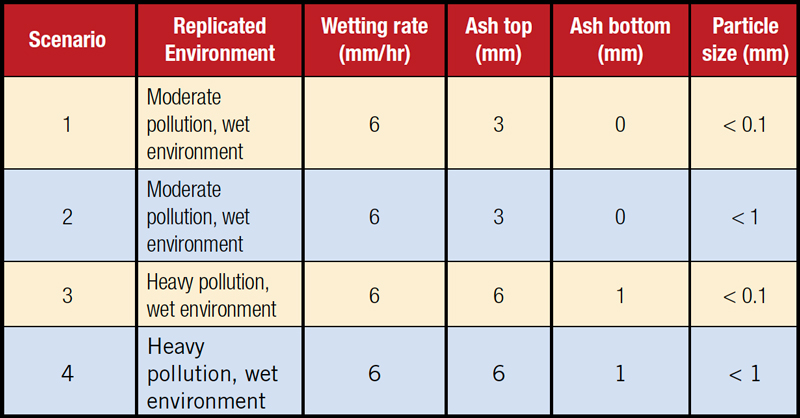

Dry ash was applied to the top of insulator weathersheds using a small sieve (diameter 10 cm, mesh size < 0.1 or < 1 mm). For scenarios 3 and 4, dry ash was applied to the bottom surface of weathersheds by first spraying the insulator with a fine mist of water (same water source as used for wetting) and then dusting pre-sieved ash over the surface by hand. Alternating between misting and dusting, a relatively uniform ash layer of 1-2 mm was achieved. An average ESDD for top/bottom surfaces was then calculated for each scenario. Very light rain conditions (using an air atomizing nozzle ~ 6 mm/hr with a volume conductivity ~130 μS/cm) were applied for wetting with spray nozzles configured perpendicular to the test insulators. The procedure for voltage tests consisted of:
1. Installing a clean insulator into position for testing;
2. Contaminating the insulator according to the scenario being investigated;
3. Applying light rain for 5 minutes before energization;
4. Energizing insulator and maintaining voltage for 2 min or until flashover;
5. Assuming no flashover, raising voltage in 5% increments every 2 min until flashover;
6. Re-energizing the insulator after flashover at ~ 2.5 steps below the flashover voltage. This sequence was repeated for each scenario with each round of tests ending once flashover voltages decreased to a minimum or until 15 consecutive flashovers were recorded.
To ensure repeatability and reliability, three rounds of tests were performed for each scenario. The average of the lowest flashover and the highest withstand values obtained during the three test rounds was then defined as the Vmin for the scenario. All insulators flashed over at similar voltages during all scenarios. However the standard glass insulator exhibited the lowest Vmin, i.e. 12 kV/unit (ESDD/NSDD = 0.4/152 mg/cm2), which is similar to that observed in other studies (11 kV/unit, ESDD = 0.3-0.6 mg/cm2).
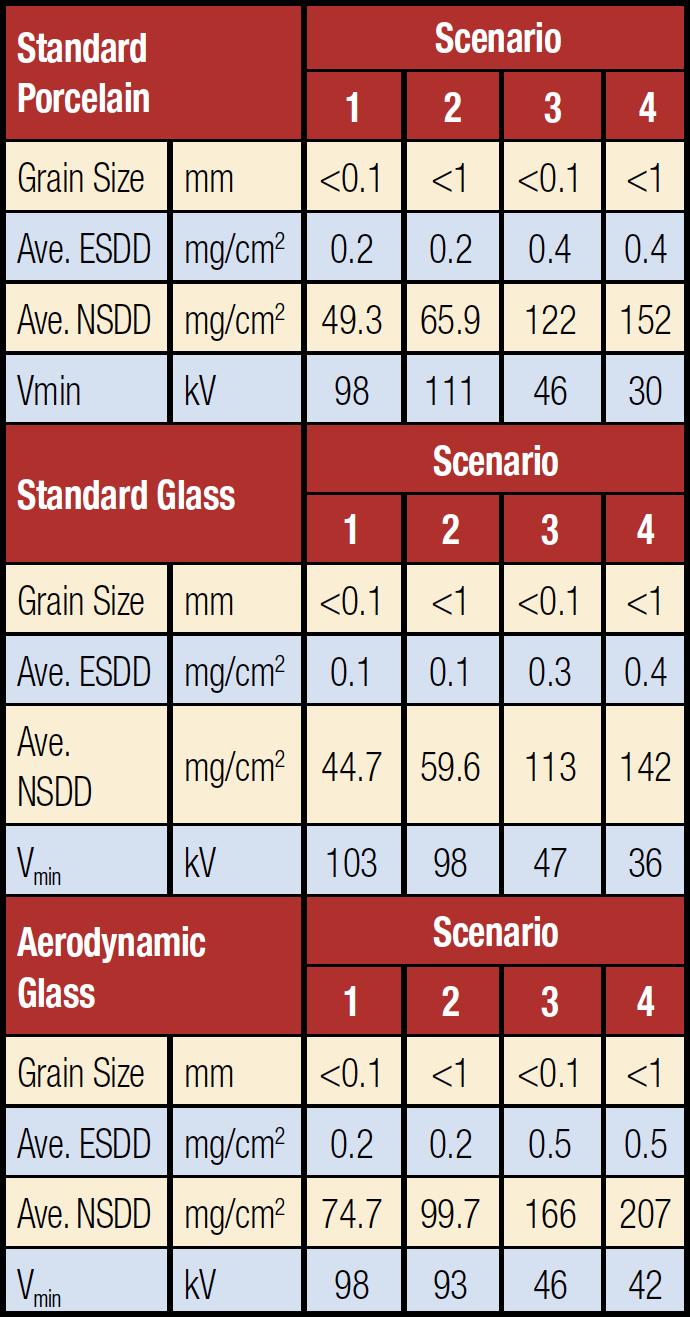
The lowest flashover voltages were observed once the top and bottom surfaces of insulator weathersheds were fully covered by ash (i.e. scenarios 3 and 4). This suggests that moderate accumulations of volcanic ash on the tops of insulator sheds (i.e. up to 3 mm as per this study) can still occur without severely reducing dielectric strength, providing the bottom surface remains clean and dry. Results suggested that, for the pseudo ash used in this study, an NSDD of 1 mg/cm2 corresponds to an ESDD of approximately 0.003 mg/cm2 for non-uniform top/bottom contamination (i.e. ash accumulates only on the top surfaces of the suspension string). This value is roughly doubled (0.006 mg/cm2) for uniform contamination, which is comparable to the 0.008 mg/cm2 found during research at STRI.
Critical NSDD levels for an insulator in service can preliminarily be estimated based on the pseudo ash ESDD/NSDD relationship and the Vmin findings from these artificial pollution tests. For example, for a 10-disc standard glass cap & pin string on a 145 kV line in an area with medium site pollution severity (as per IEC 60815-1), providing the required reliability of ~ 0.1 outages/100 km/year requires that flashover voltage of the string must be 1.5 times higher than the maximum operating voltage, i.e. ~ 13 kV per unit. Moreover, using generic flashover performance curves, results at UC can be converted to show that volcanic ash has a critical ESDD of 0.3 mg/cm2 and a critical NSDD of ~ 50-70 mg/cm2 (or a critical thickness of 1 mm, as shown in Fig. 4).
Summary & Conclusions
Chemically similar to certain types of industrial pollution, volcanic ash is composed of non-soluble fragments of rock, minerals and glass (SiO2), whose relative proportions will vary with each volcano and specific eruption and even at different phases of any eruption. Soluble surface salts are formed during particle-gas interaction within the plume and are the primary determinant of the electrical conductivity (ESDD) of volcanic ash. Ash-induced insulator flashover is the most common mode of power system component failure during ash falls. Limited data on the performance of HV insulation contaminated by volcanic ash resulted in investigations on this topic at STRI and UC. The following conclusions could be drawn from these studies:
• Rate of recovery of hydrophobicity on silicone rubber insulators is slightly lower for volcanic ash in the long-term (15 days in this study) than for standard reference kaolin. However, considering the generally superior performance of composite line insulators over strings of ceramic cap & pin insulators, even in the event of total loss of hydrophobicity it is expected that these insulators will still perform relatively well under ashy conditions;
• In general, a significant amount of volcanic ash is needed to cause flashover. Given the performance of specimen insulators during electrical tests at UC, the critical NSDD threshold is estimated to be 50-70 mg/cm2, meaning a critical thickness of ~1 mm (uniform layer on top and bottom surfaces). This is an unusually high level of contamination compared with other forms of airborne pollution mentioned in IEC 60815-1 and is likely to occur only in areas that receive direct fallout from a volcanic plume;
• Amount of ash deposited in any one place within a power network will depend on a range of factors such as eruption size, wind direction and strength, atmospheric conditions, etc. The likelihood of flashover will therefore also be dependent on local conditions (e.g. wind and relative humidity) in addition to insulator material, profile, orientation and condition as well as the conductivity of the ash.