Degradation of high voltage insulators presents a persistent challenge to the reliability and safety of transmission networks. As demand on bulk power system increases, the impact of outages increases as well. Transmission line failures cost billions of dollars each year in lost load, economic costs as well as environmental damage and liability from wildfires.
Traditional inspection methods are costly, periodic and labor-intensive but often fail to detect insulators at imminent risk of failure. Strategies to detect incipient failure on transmission line infrastructure need to improve.
This edited contribution to INMR by Jordan Edwards of CRWN.ai in Canada introduces a data-driven framework for continuous condition monitoring using IoT devices and machine learning. Leveraging sensor fusion, real-time analytics and field deployments creates the capacity to identify corona, surface discharges, tracking and flashover phenomena under varied environmental conditions. A case study from controlled laboratory environments and real-world deployments in the Province of Alberta are provided to demonstrate empirical validation of this approach.
Limitations of Current Methods
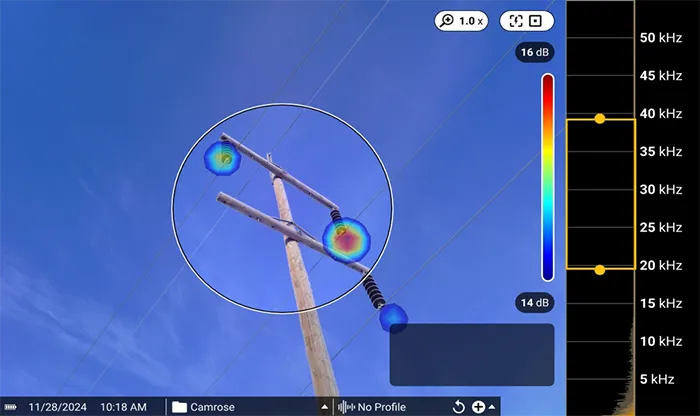
Commercial inspection technologies (e.g. ultraviolet imagers, handheld ultrasonic diagnostic imagers, visual inspection) provide valuable yet incomplete insights on transmission assets. Inspections typically occur every 2 to 5 years, leaving significant gaps in asset condition awareness. Failures often manifest between inspections, discovered only after catastrophic flashovers or wildfires. Geographic remoteness further compounds these limitations. In North America, for example, there are over 566,000 kms of high voltage transmission lines, with large sections not readily accessible for unplanned repairs.
Importance of Timeliness
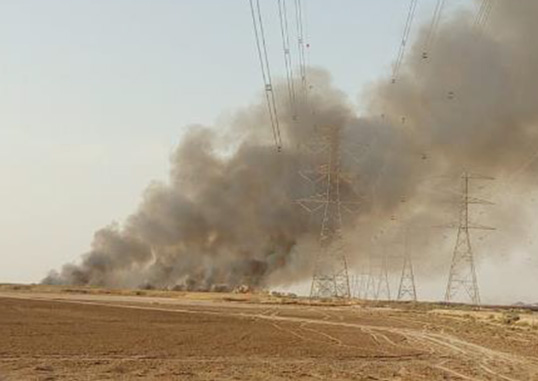
A failing insulator can present immediate risks. Once flashover occurs, damage is not confined to the insulator itself but may extend to structures and surrounding vegetation, increasing likelihood of pole fires. These risks necessitate expedient replacement of identified tracked insulators before they flashover. Because utilities generally do not know if their insulators are tracking, they lack actionable information to address this risk preemptively, without inspection.
While the typical mean restoration time in North America, as cited by NERC, is as little as 3 hours, average outage duration can climb dramatically when the failure is in a remote area, or if the infrastructure is damaged, such as when the failure causes scorching or a fire. Early detection creates the opportunity to plan and stage insulator replacements, preventing prolonged outages and pole replacements. Timely detection of possible degradation of insulation is therefore an essential requirement in monitoring capability.

Understanding Partial Discharge Factors
Partial discharge (PD) is a fundamental phenomenon in high voltage engineering, representing a localized electrical discharge that partially bridges the insulation between conductors. It occurs in regions where the localized electric field stress surpasses the dielectric strength of a small portion of the insulating medium, while the bulk of the material remains intact.
Occurrence of PD is both a primary symptom of existing insulation defects and a potent mechanism for progressive degradation, ultimately leading to catastrophic failure. For high voltage insulators, PD phenomena are primarily classified into three types: corona, internal (or void) discharge, and surface discharge.
Corona occurs in a gaseous dielectric, such as air, in a region of highly non-uniform electric field, typically around sharp points or edges of a high voltage conductor. Corona is fundamentally a discharge from the conductor into the surrounding gas. While it can occur near an insulator surface, particularly at the junction of metal hardware (like a cap or pin) and the insulating material, it does not require the solid dielectric surface for propagation. Its characteristics are therefore dominated by the properties of the gas (e.g. pressure and humidity) as well as geometry of the electrode.
Void discharge occurs within a gas-filled cavity or void completely enclosed by a solid or liquid dielectric material. These voids are typically manufacturing defects or the result of material ageing. The electric field inside the void is intensified relative to the surrounding dielectric due to the lower permittivity of the gas. When this intensified field exceeds breakdown strength of the gas, a discharge occurs within the void. Characteristics of internal discharges are governed by gas properties within the void and the electrical properties of the void’s surfaces.
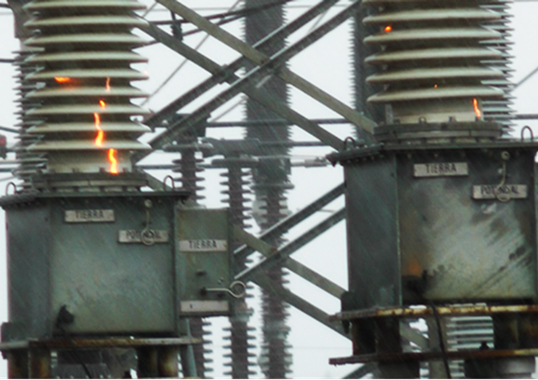
Surface discharge occurs along the interface between a gaseous and a dielectric. Unlike corona, its path is determined by the insulator surface. The initiation and propagation of surface discharges is critically dependent on the condition of that surface. Factors such as contamination, moisture, and material degradation cause tracking that facilitates discharge, often at voltages well below the flashover voltage of a clean, dry insulator.
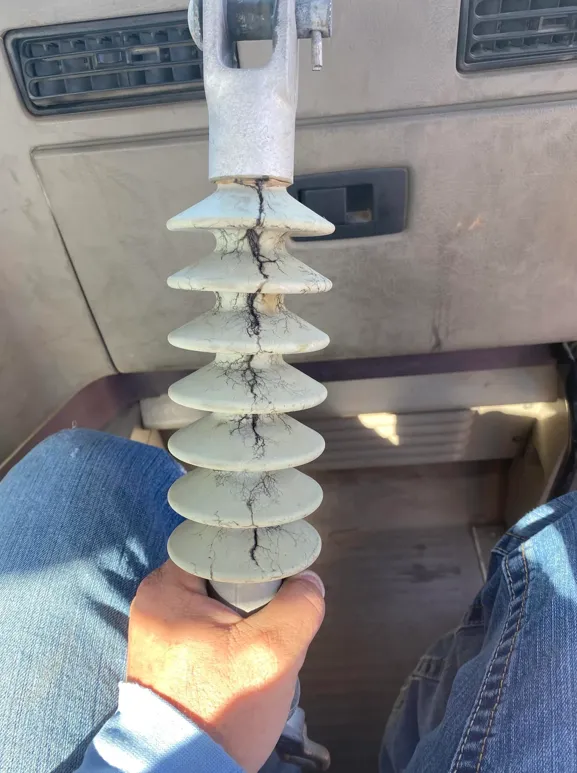
Tracked insulators are at significantly higher risk to catastrophically fail by way of flashover. Due to these risks, significantly tracked insulators should generally be replaced. Identifying tracked insulators is traditionally difficult due to the vast number of insulators deployed; inspection is infrequent, on the order of years. Often, tracked insulators are found once a flashover has caused a fire, either on the pole (commonly on the crossarm holding the insulator) or on nearby vegetation. Development of tracking is a process that can largely be attributed to PD activity, most notably, surface discharge.

Partial Discharge & Insulator Ageing
Environmental exposure contributes to material breakdown of polymeric insulators over time. Aged polymer insulators show rougher surfaces and higher porosity. As a result, they become more likely to emit corona because of E-field stress from rougher surfaces. Moreover, loss of surface hydrophobicity causes reduced corona inception voltages. Additionally, such insulators are more likely to express surface discharge as they age due to contaminants and moisture, which accelerates formation of carbonized tracks.
PD activity itself accelerates ageing of these types of insulators. Each PD event dissipates energy in a localized area, generating intense, but highly localized heat. Over time, the cumulative effect of repeated discharges leads to thermal decomposition of insulation materials. This process can result in formation of carbonized paths within the insulation, which are significantly more conductive than the parent material. Carbonized tracks reduce a polymeric insulator’s dielectric strength and create pathways for more severe discharge activity.
During PD events, high-energy electrons and ions collide with ambient gas molecules (i.e. oxygen, nitrogen and water vapor), generating highly reactive species such as ozone (O3) and various nitrous oxides (NOX). These species can directly attack the molecular chains of polymeric insulators. In the presence of moisture, a common condition for outdoor insulators, nitrous oxides can react to form nitric acid (HNO3). This acid is highly corrosive to organic materials, leading to chemical etching of the insulator surface. This degradation is particularly damaging for modern polymer insulators, since it can destroy their crucial property of hydrophobicity and make them more susceptible to formation of conductive water films, persistent surface contamination and subsequent flashover.
Partial Discharge & Environmental Conditions
PD is dynamically influenced by the surrounding environment. Among the various environmental factors, temperature and humidity are the most significant, exhibiting complex, often non-linear, and sometimes contradictory effects on PD activity. Understanding these influences is paramount for accurate insulation condition assessment, particularly for interpreting data from online monitoring systems where environmental conditions can fluctuate continuously.
Role of Temperature
A substantial body of research indicates that an increase in ambient temperature generally promotes PD activity. The most commonly-observed trend is a decrease in the partial discharge inception voltage (PDIV) – the voltage at which PD begins, and there is an increase in number and repetition rate of PD pulses at a given operating voltage.
Physically, this relates to the properties of the gas in which the discharge occurs. Reduction in gas density lowers the dielectric strength of the gas, making electrical breakdown and PD more probable at a lower electric field stress. Increased thermal energy enhances the mobility of charge carriers within and on the surface of dielectrics, facilitating processes such as charge injection from electrodes and charge extraction from trapping sites within the material. Depending on insulator geometry and material composition, this redistribution can lead to a higher concentration of electrical stress in certain regions such as within a gas-filled void, thereby increasing likelihood of PD.

Role of Humidity
In many experiments, an increase in humidity leads to a decrease in PD activity and a corresponding increase in the PDIV. This suppressive effect is rooted in the molecular properties of water. Water vapor is an electronegative gas, meaning its molecules have a high affinity for attaching to free electrons. When water molecules are present, they readily capture electrons, forming heavy, slow-moving negative ions. This process of electron attachment effectively removes the primary charge carriers from the system, arresting the avalanche mechanism and making it more difficult to initiate and sustain a discharge. This effect is most pronounced for corona, which is highly dependent on properties of the surrounding gas. But it also applies to surface discharges on clean, hydrophobic surfaces where a continuous water film does not form.
On contaminated or aged hydrophilic surfaces, moisture does not remain as discrete droplets but instead combines with surface pollutants (such as salts, dust, and industrial chemicals) to form a continuous, conductive electrolytic layer. This conductive film provides a path for leakage current to flow across the insulator surface. As this current flows it generates heat, causing some parts of the wet layer to evaporate faster than others. This non-uniform drying leads to formation of small, dry, and highly resistive gaps known as dry bands.
The entire voltage drop across a large section of the insulator becomes concentrated across these narrow dry bands, resulting in extremely high localized electric fields that cause intense arcing. Dry-band arcing is a form of surface discharge that is far more energetic and damaging than corona, and it can elongate and eventually bridge the entire insulator, causing complete flashover. In this regime, PD is dominated by surface conductivity and resistive heating, not electronegativity of the surrounding gas.
Role of Barometric Pressure
Numerous studies have confirmed that PDIV decreases substantially with decreasing air pressure. This is critical for design and operation of electrical equipment in high altitude regions, where the rated PDIV of an insulation system can be lower compared to the appropriate value at sea-level. Lower pressure not only reduces the PDIV but also alters the characteristics of the discharge itself.
As pressure decreases, number and magnitude of PD pulses tend to increase for a given voltage above inception. Moreover, the physical area affected by the discharge tends to expand, as the lower gas density allows streamers to propagate more easily. It is important to note that this trend does not continue indefinitely. At extremely low pressures approaching vacuum, dielectric strength starts to increase because there are too few gas molecules available to sustain an ionization avalanche.

Limitations of Partial Discharge Understating
A significant limitation of many foundational studies is their reliance on controlled laboratory experiments. These investigations often utilize new, clean material samples and employ standardized electrode configurations to create artificial PD sources. Most laboratory tests are designed to investigate the effect of one or two environmental stressors in isolation.
While this approach is invaluable for isolating and understanding specific physical mechanisms, direct extrapolation to the behavior of complex, geometrically intricate and field-aged insulators must be done with caution. In-service insulators are subjected continuously to multiple stressors, including electrical stress, thermal cycling, mechanical loads, UV radiation, as well as fluctuating pollution and precipitation.
The relationship between temperature and PD is not universally simple, and some studies reveal more complex or even contradictory behaviors. For example, research on silicone rubber nanocomposites has shown that while higher temperatures increase space charge dynamics (promoting PD), they can also induce further vulcanization or cross-linking within the polymer matrix. This structural change can create more trapping sites for charge carriers, which can immobilize them and impede growth of electrical trees.
Influence of humidity on PD is one of the most complex and debated topics in the field, with literature reporting seemingly contradictory results. Some studies conclude that humidity suppresses PD, while others find that it dramatically enhances it. This apparent contradiction is not a failure of the research but rather a reflection of the fact that humidity can trigger two distinct and competing physical mechanisms. In many controlled experiments, particularly those focused on clean, new insulator surfaces, increase in humidity leads to a decrease in PD activity. In stark contrast, for insulators in service, which are invariably exposed to contamination and ageing, increased humidity is a primary driver of severe surface discharge activity and a major factor in flashover events.
The individual effects of temperature and humidity are complex, but their combined influence is even more so, often resulting in highly non-linear interactions that cannot be predicted by simple superposition. Research conducted in climate-controlled chambers, where both variables can be precisely controlled, has been instrumental in revealing the nature of these synergistic effects.
Findings consistently show that the magnitude of effect on PD of one variable is strongly dependent on the other variable. At an ambient temperature of 30°C, increasing relative humidity was found to lower the PDIV. However, at the high temperature of 90°C, a surprising result was observed: at 75% RH, a high-conductivity area formed on the surface, leading to complex PD behavior that was difficult to explain with simple models. Other studies on solid insulation have also noted this strong non-linear relationship, concluding that there is no general rule to explain the combined effect of humidity and temperature on the PD phenomenon.
These strong, non-linear interactions have profound implications for the practical task of insulation condition monitoring. Seasonal variations in ambient temperature and humidity can cause large fluctuations in measured PD that are purely environmental in origin and not indicative of any change in the insulation’s physical condition. For example, one case study reported that the PD readings on a machine in winter (typically cold and dry) were over 100 times higher than the readings on the same machine in summer (hot and humid).
Accretion of ice and snow on insulators introduces a set of conditions under which corona and surface discharge behaviors diverge significantly. This scenario transforms the insulator’s dielectric properties, creating a new and complex environment for discharge activity. Initially, ice and snow can physically bridge the insulating gaps between the sheds of an insulator, effectively shortening the creepage distance that is designed to prevent flashover. This accretion is rarely uniform, especially when it occurs on an energized insulator.
Electrical forces and localized heating from minor discharge activity lead to formation of icicles, air gaps within the ice structure, and voids between the ice and the insulator surface. The electric field, which would normally be distributed along the full length of the insulator, becomes highly concentrated across these newly formed air gaps. Since the dielectric strength of air is much lower than that of ice or the insulator material, these gaps become the weakest points in the insulation system. As a result, intense PD activity initiates within these air gaps. This activity is a form of void or surface discharge, physically distinct from the corona that might occur at insulator end-fittings under clean conditions.
When ambient temperature rises to between -2°C and 0°C, a thin film of highly conductive water forms on the surface of the ice and icicles. The conductivity of this film is often elevated because impurities from pre-existing surface contamination or atmospheric pollutants captured by the precipitation that is expelled from the ice lattice as it melts become concentrated in the liquid water layer. This contaminated and conductive water film facilitates current flow across iced sections, causing full system voltage to be dropped across the remaining air gaps. This leads to initiation of powerful local arcs within these gaps. These arcs can then propagate along the conductive, melting ice surface, potentially elongating to bridge the entire insulator and cause complete flashover, often at a fraction of an insulator’s nominal withstand voltage.
These findings have significant practical implications for the power industry. The strong, non-linear dependence of PD activity on environmental conditions means that data from online monitoring systems cannot be used reliably for asset management purposes without first being rigorously correlated with comprehensive, time-synchronized weather data, including temperature and, critically, absolute humidity.
A novel remote sensing device and sophisticated AI technology has been developed which can accurately model the complexity of PD activity. The case study below describes this technology and explains the influence of these complex environmental factors on surface discharge activity.

Machine Learning Framework
Machine learning is a way for computers to “learn” patterns from data rather than being programmed with fixed rules. Instead of telling a computer exactly how to solve a problem, it is provided with many examples among which it discovers patterns and relationships.
The process starts with a collected dataset of inputs (e.g. images, numbers, text, or audio files) paired with category labels. A model structure is selected based on what type of input is being used, and how complex the patterns are likely to be. During training, the model tries to make predictions, compares them to the correct labels, and then adjusts its internal parameters to reduce the error percentage.
After many iterations through the data, the model improves its ability to recognize hidden patterns. After a suitable threshold of accuracy has been reached, the model can take in new, unseen data and make predictions or decisions, such as distinguishing between different types of PD phenomena. The accuracy of the model is evaluated not only in how often it guesses correctly overall but also where and when it guesses incorrectly. Data scientists determine what is acceptable for accuracy, precision, and confusion. Depending on the application, for example, there may be different tolerance for false positives versus false negatives.
In short, machine learning intends to teach computers to generalize from experience. It is widely used today in recommendation systems, speech recognition, medical diagnoses, and countless other applications where rules are too complex to hand-code. It is therefore also the perfect tool to use for detecting and classifying complex signals such as electrical partial discharge.
Data Science Lifecycle
Machine learning algorithms have been developed that are trained on labeled acoustic and radio frequency recording datasets of PD activity, learning statistical patterns that differentiate between healthy and degraded insulators. Once deployed, these models infer insulator condition from real-time sensor data. To create high-performing models that give reliable predictions, this process is used:
1. Controlled Experimentation
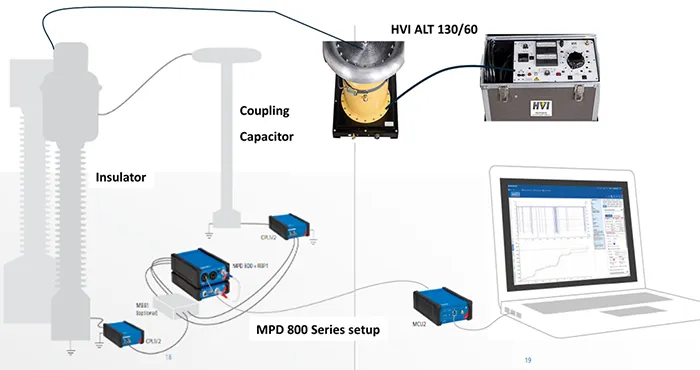
Experimentation is conducted in high voltage laboratories, such as Powertech Labs, in Vancouver. Different types and ranges of partial discharge are created, across the full spectrum of patent, aged, and degraded insulators. Equipment used includes:
1. Flat frequency response, high fidelity ultrasonic microphones;
2. High fidelity acoustic recording devices;
3. Radio Spectrum Analyzer;
4. Wide band radio antenna;
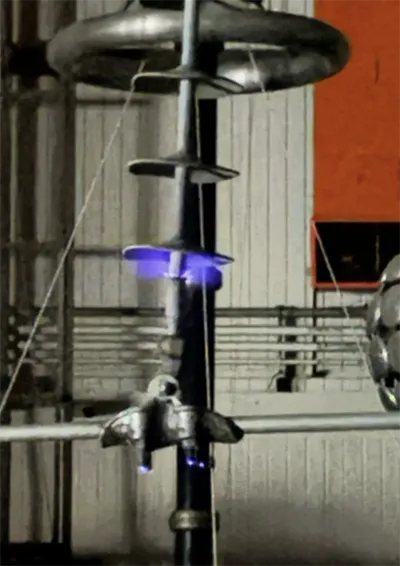
5. Solar blind ultraviolet corona camera;
6. Omicron MPD device to capture Phase Resolved Partial Discharge plots (PRPDs).
With this equipment, the following data can be detected and captured:
1. Acoustic data extending into ultrasonic frequencies;
2. Broadband radio frequency (RF);
3. Temperature;
4. Humidity;
5. Barometric Pressure;
6. Phase-Resolved Partial Discharge (PRPD) plots;
7. Ultraviolet-C lumen counts and overlaid images showing location of PD.
2. Data Cleaning & Exploratory Data Analysis
Data cleaning and exploratory data analysis (EDA) are essential steps before building a machine learning model because they ensure data quality and guide model design. Raw data often contains errors, duplicates or missing values that can mislead algorithms and reduce accuracy. Data cleaning fixes these issues, making the dataset more reliable.
EDA helps uncover patterns, distributions, correlations, and anomalies, providing insights into feature importance and potential transformations. It also identifies biases, outliers and data imbalances that could affect predictions. Without these steps, models risk being inaccurate, overfitted, or misinterpreted, leading to poor performance and unreliable real-world results.
3. Field Data Collection
To create a model that will accurately represent the real world, data collection must focus on recordings from real world conditions that are representative of existing transmission infrastructure. A data collection crew surveys each tower along target transmission lines, recording data from a wide variety of different insulator types, ages, tower construction methods, and voltage ranges. As above, recordings are taken in ultrasound, radio and ultraviolet. Measurements are taken for temperature, altitude, humidity, atmospheric pressure.
Data labelling is performed by correlating data samples to the patterns of known defects determined in the lab. These labels are compared to the readings taken with industry standard diagnostic devices (US diagnostic imager, UV Solar blind corona camera) to provide another layer of validation.
4. Model Training
CRWN.ai’s machine learning models, for example, typically use Convolutional Neural Networks (CNNs). In the training and validation of a CNN for this purpose, the audio is first preprocessed by converting WAV files into numerical representations such as spectrograms or Mel-frequency cepstral coefficients (MFCCs). The dataset is split into training, test, and validation sets. The CNN architecture is created with convolutional, pooling, and fully connected layers suited for 2D input (spectrogram images). Next, the model is optimized by iteratively minimizing an appropriate loss function through backpropagation.
The model is then trained by feeding it pre-processed audio data. Performance is monitored on the validation set, and hyperparameters adjusted. Finally, accuracy is measured against the test set.
5. Deployment
Once the models have been sufficiently tested and validated, they are uploaded to the CRWN Inferencing Engine in the cloud. Transmissions received from the devices deployed in the field will be run through the models and predictions delivered to the end-user.
6. Ground Truth Validation
Validation must be done by field inspection. To ensure that models continue to be accurate, and guard against model drift, regular ground truth validations must be performed. Model drift in machine learning refers to the decline in a model’s performance because the data it sees when deployed over time differs from the data on which it was trained. This happens when relationships between input data and dependent variables change due to evolving real-world conditions. In the case of transmission lines, this could mean that construction methods or materials change, or variables show up that were not discovered in the original training process.
Using industry standard inspection tools, measurements are taken and compared to the predictions made by the installed device in real time.
Technical Application & System Design
IoT Device (Cricket)
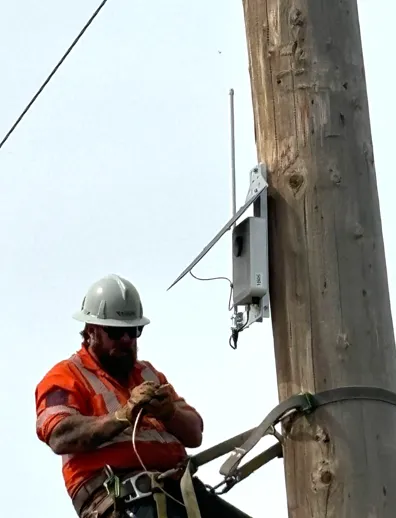
The Cricket device integrates ultrasonic, RF and environmental sensors into a self-contained solar powered unit. Safe and durable lithium iron phosphate battery packs provide a steady power supply for periods of darkness or low light levels. These devices are weatherproof, robust and designed for long deployments (~5 years) with the ability to survive harsh environmental conditions (-30°C to +60°C, high wind, dust).
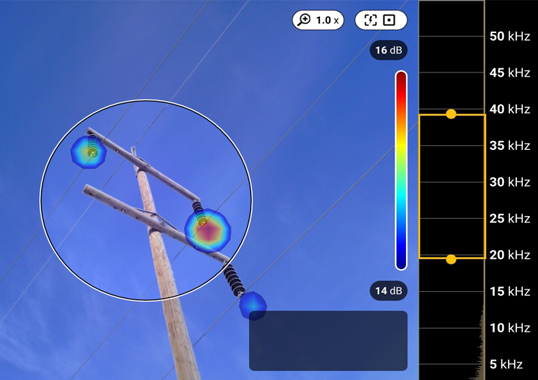
The Cricket also includes a dedicated always-on sensor for detecting sudden flashover events. Should a sudden burst of energy centered around 500 kHz occur, the device will report immediately to the cloud and a message will be forwarded to the utility. A calculation of the distance from the discharge event is made to differentiate flashover events (located close to the device) from lightning or electromagnetic pulses caused by other sources.
The Cricket device is installed directly onto the tower by means of a pair of bolts and a ground clamp directly below the insulators. Devices are mounted on transmission structures without requiring the line to be de-energized or the use of heavy equipment.
Collection & Feature Processing
On an hourly recurring cycle, the device takes recordings of ultrasound and radio emissions in targeted frequency bands. These recordings are then processed through a feature extraction algorithm. Feature extraction reduces the recordings to only 2% of the size of the original sample. These features (a list of integers) are all that is needed by the machine learning model to detect and classify partial discharge.
Transmission
The acoustic, radio sample features and a set of environmental readings are packaged and sent from the Cricket devices over long range, low power radio to gateways (LoRa), or over LTE where available to a cloud system (e.g. CRWN Cortex). On the cloud servers, the features are run through a series of models to produce predictions and report these readings back to the utility.
Generating Inferences
By using a patent (pending) ultrasound and radio frequency sensor fusion system, it becomes possible to filter for only the electromagnetic events corresponding to partial discharge. If either ultrasound or radio frequency were used on their own, signals that falsely resemble partial discharge could then be confused for partial discharge. True partial discharge creates corresponding, but non-linearly related signals in radio and ultrasound.
A two-channel Convolutional Neural Network resolves the mapping between these two signals that indicates classifications and magnitudes of partial discharge. Further data analysis and rich trend modelling take place on the combined dataset. Patterns in temporal or environmental conditions can be modelled and actionable intelligence created. This arrangement allows offloading the highest resource-demanding process (machine learning model processing) to the high power computing resources available in the cloud.
Case Study: Alberta Field Deployment
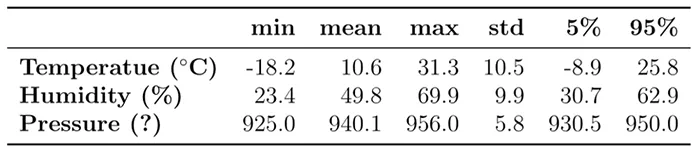
Between Dec. 2024 and Aug. 2025, 100 structures were monitored at locations across Alberta. Over 52,000 readings were collected under diverse environmental conditions. Recordings of temperature, humidity, and barometric pressure were taken in conjunction with the ultrasound and radio samples.
Key findings included:
● Surface discharge peaked near freezing temperatures, consistent with condensation effects;
● Corona was more prevalent at high temperatures and low humidity;
● Predictive models achieved high calibration accuracy, validating physics-informed hypotheses;
● Individual variability between towers was significant, underscoring the necessity of tower-specific monitoring.
Table 1 provides summary statistics of continuous variables.
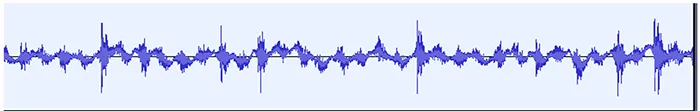
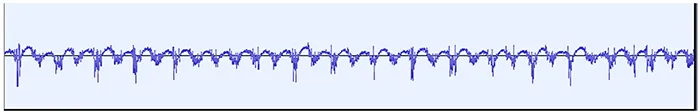
At each reading, proprietary ultrasonic and RF sensors were used to predict if the transmission structure was producing corona, surface discharge, or neither.
Conclusions & Future Work
Evidence demonstrates that environmental and temporal variability render periodic inspections inadequate. Continuous monitoring enables utilities to proactively identify and replace degraded insulators before catastrophic failure. Moreover, network-level analytics provide system-wide insights, allowing utilities to manage risk across entire corridors.
The work highlights the efficacy of combining IoT devices with machine learning to monitor the condition of electrical insulation. Compared to periodic inspections, continuous monitoring yields orders of magnitude more data, enabling predictive insights unattainable by conventional methods. Future work includes refining multi-factor ageing models, integrating weather data more deeply into predictive frameworks and expanding deployments to larger networks.
References
[1] F. Hassan, M. Lehtonen, M. Niemel¨a, and F. Aday, “Effects of environmental factors on partial discharge activity and estimation of insulation lifetime in electrical machines,” IEEE Access, vol. 8, pp. 108 491–108 502, 2020.
[2] Y. Ji, P. Giangrande, and W. Zhao, “Effect of environmental and operating conditions on partial discharge activity in electrical machine insulation: A comprehensive review,” Energies, vol. 17, no. 16, p. 3980, Aug. 2024.
[3] Z. Li et al., “Effect of temperature on partial discharges activity and electrical trees prop agation in xlpe,” IET Science, Measurement & Technology, vol. 18, no. 1, p. 300–309, Sep. 2024.
[4] A. Rumi, A. Cavallini, and L. Lusuardi, “Combined effects of temperature and humidity on the pdiv of twisted pairs,” in 2020 IEEE 3rd International Conference on Dielectrics (ICD), 2020, pp. 906–909.
[5] High-voltage test techniques – Part 1: General definitions and test requirements, Inter national Electrotechnical Commission Std. 60 060-1, 2010.
[6] High-voltage test techniques – Partial discharge measurements, International Elec trotechnical Commission Std. 60 270, 2000.
[7] D. Mello and S. Souza, “A comparison between the atmospheric correction factors used in IEC and ANSI applied to tests performed on post insulators,” in [1991] Proceedings of the 3rd International Conference on Properties and Applications of Dielectric Materials. IEEE, 1991, pp. 359–362.
[8] M. R. Rahimi, R. Javadinezhad, and M. Vakilian, “Dc partial discharge characteristics for corona, surface and void discharges,” in 2015 IEEE 11th International Conference on the Properties and Applications of Dielectric Materials (ICPADM). IEEE, Jul. 2015, pp. 260–263.
[9] CIGRE Working Group B2.58, “Pollution test of naturally and artificially contaminated insulators,” International Council on Large Electric Systems, Tech. Rep. 691, 2016. [Online]. Available: https://cigre.cz/dokumenty komise/d1/D1 44 TB Natural Pollution Testing CIGRE.pdf
[10] A. M. Nor and Q. Liu, “Effects of temperature on the partial discharge characteris tics of silicone oil,” in 2024 IEEE Conference on Electrical Insulation and Dielectric Phenomena (CEIDP). IEEE, Oct. 2024, pp. 1–4.
[11] INMR, “Practical guidelines for visual inspection & condi tion assessment of transmission insulation,” https://www.inmr.com/ practical-guidelines-for-condition-assessment-of-transmission-insulators/, Aug 2025, accessed: 2025-08-12. [Online]. Available: https://www.inmr.com/ practical-guidelines-for-condition-assessment-of-transmission-insulators/9
[12] Electrical Power Research Institute, “Plant support engineering: Switchyard component end-of-expected-life considerations and the need for planning,” EPRI, Tech. Rep., Dec 2008, accessed: 2025-08-12. [Online]. Available: https://restservice.epri.com/ publicdownload/000000000001016684/0/Product
[13] The Florida Public Service Commission Office of Auditing and Performance Analysis, “Review of electrical transmission structure inspection and maintenance procedures and processes,” Florida Public Service Com mission, Tech. Rep., Mar 2020, accessed: 2025-08-12. [Online]. Avail able: https://www.floridapsc.com/pscfiles/website-files/PDF/Publications/Reports/ General/Electricgas/2020 Trans Facil Maint Final Report.pdf
[14] Pacific Gas and Electric Company, Electric Transmission Preventive Maintenance Manual (05), Pacific Gas and Electric Company, Aug 2020, accessed: 2025-08- 12. [Online]. Available: https://www.pge.com/assets/pge/docs/outages-and-safety/ outage-preparedness-and-support/td-1001m-etpmm.pdf
[15] Southern California Edison Transmission and Distribution, “Transmission inspection and maintenance program (timp) 2022—second quarter issue,” Southern California Edison, Tech. Rep., Jun 2022, accessed: 2025-08-12. [Online]. Available: https://www.sce.com/sites/default/files/AEM/Supporting%20Documents/2023-2025/ Transmission%20Inspection%20and%20Maintenance%20Program%20%28TIMP%29.pdf
[16] M. Amin, M. Akbar, and M. Salman, “Composite insulators and their aging: An overview,” Science in China Series E: Technological Sciences, vol. 50, no. 6, pp. 697–713, Dec. 2007.
[17] D. Ghosh and D. Khastgir, “Degradation and stability of polymeric high-voltage insulators and prediction of their service life through environmental and accelerated aging processes,” ACS Omega, vol. 3, no. 9, pp. 11 317–11 330, Sep 2018.
[18] L. Mu, B. Wang, J. Hao, Z. Fang, and Y. Wang, “Study on material and mechanical characteristics of silicone rubber shed of field-aged 110 kV composite insulators,” Scientific Reports, vol. 13, no. 1, p. 16828, Oct. 2023.
[19] X. Li, Y. Zhang, L. Chen, X. Fu, J. Geng, Y. Liu, Y. Gong, and S. Zhang, “Study on the ageing characteristics of silicone rubber for composite insulators under multi-factor coupling effects,” Coatings, vol. 13, no. 10, p. 1668, Sep. 2023.
[20] F. L¨u, L. Niu, S. Wang, T. Jiang, W. Li, J. Guo, and H. Li, “Influencing of water droplets on corona inception characteristics of composite insulator recorded by UV imager,” IET Science, Measurement & Technology, vol. 14, no. 10, pp. 1049–1056, Dec. 2021.
[21] R. Ullah, M. Akbar, N. Ullah, S. Al Otaibi, and A. Althobaiti, “Understanding variations in the tracking and erosion performance of HTV-SR-Based composites due to AC-Stressed aging,” Polymers, vol. 13, no. 21, p. 3634, Oct. 2021.
[22] X. Qiao, Y. Ming, K. Xu, N. Yi, and R. Sundararajan, “Aging of polymeric insulators under various conditions and environments: Another look,” Energies, vol. 15, no. 23, p. 8809, Nov. 2022. [Online]. Available: https://www.mdpi.com/1996-1073/15/23/8809
[23] CIGRE Working Group D1.62, “Surface degradation of polymeric insulating materials for outdoor applications,” International Council on Large Electric Systems, Tech. Rep. 740, 2018.
[24] M. H. Ahmad, N. Bashir, Z. Buntat, Y. Z. Arief, A. A. Abd Jamil, M. A. Mohamed Piah, A. A. Suleiman, S. Dodd, and N. Chalashkanov, “Temperature effect on electrical treeing and partial discharge characteristics of silicone rubber-based nanocomposites,” Journal of Nanomaterials, vol. 2015, no. 1, p. 962767, Jan. 2015. [Online]. Available: https://onlinelibrary.wiley.com/doi/abs/10.1155/2015/962767
[25] L. Jiang et al., “Impact of air pressure variations on electrical vehicle motor insulation,” IET Generation, Transmission & Distribution, vol. 17, no. 16, pp. 3834–3844, 2023.
[26] M. Farzaneh et al., “Effects of ice and snow on the electrical performance of power network insulators,” IEEE Transactions on Dielectrics and Electrical Insulation, vol. 16, no. 4, pp. 1141–1153, Aug. 2009.
[27] D. D. Hinde, “Corona discharges on the surfaces of high voltage composite insulators,” Ph.D. dissertation, Queensland University of Technology, 2009. [Online]. Available: https://eprints.qut.edu.au/29320/
[28] V. M. Moreno and R. S. Gorur, “Impact of corona on the long-term performance of nonceramic insulators,” IEEE Transactions on Dielectrics and Electrical Insulation, vol. 8, no. 1, pp. 117–124, 2001.
[29] Z. Zhang et al., “A comparative study of abnormal heating composite insulators,” Sensors, vol. 23, no. 12, p. 5673, Jun. 2023.
[30] Y. Ji, P. Giangrande, W. Zhao, V. Madonna, X. Zhang, H. Zhang, and M. Galea, “Partial discharge investigation under humidity conditions via dissipation factor and insulation capacitance tip-up test,” IEEE Transactions on Dielectrics and Electrical Insulation, vol. 29, no. 4, pp. 1483–1490, 2022.
[31] M. Fenger and G. Stone, “Investigations into the effect of humidity on stator winding partial discharges,” IEEE Transactions on Dielectrics and Electrical Insulation, vol. 12, no. 2, pp. 341–346, Apr. 2005.
[32] B. Pinnangudi, R. S. Gorur, and A. J. Kroese, “Quantification of corona discharges on nonceramic insulators,” in 2005 Annual Report Conference on Electrical Insulation and Dielectric Phenomena. IEEE, 2005, pp. 743–746.
[33] M. Michelarakis, “Investigation of surface discharges in insulation gases through synchronisation of improved electrical and fast enhanced-imaging techniques,” Ph.D. dissertation, Cardiff University, 2022. [Online]. Available: https://orca.cardiff.ac.uk/ id/eprint/153964/1/Thesis – MichailMichelarakis – FinalSubmission.pdf
[34] M. Fenger and G. Stone, “How humidity affects partial discharge activity in stator windings,” in Proceedings: Electrical Insulation Conference and Electrical Manufacturing and Coil Winding Technology Conference (Cat. No.03CH37480), 2003, pp. 47–50.
[35] M. Levesque, E. David, C. Hudon, and M. Belec, “Contribution of humidity to the evolution of slot partial discharges,” IEEE Transactions on Dielectrics and Electrical Insulation, vol. 19, no. 1, pp. 61–75, 2012.
[36] Y. Lou, R. Caruana, J. Gehrke, and G. Hooker, “Accurate intelligible models with pairwise interactions,” in Proceedings of the 19th ACM SIGKDD International Conference on Knowledge Discovery and Data Mining, ser. KDD ’13. New York, NY, USA: Association for Computing Machinery, Aug. 2013, p. 623–631. [Online]. Available: https://doi.org/10.1145/2487575.2487579
[37] ICF Consulting, “The Economic Cost of the Blackout: An Issue Paper on the Northeastern Blackout, August 14, 2003.”
[38] “Transforming the Grid to Revolutionize Electric Power in North America,” Bill Parks, U.S. Department of Energy, Edison Electric Institute’s Fall 2003 Transmission, Distribution and Metering Conference, October 13, 2003
[39] https://investor.pgecorp.com/news-events/press-releases/press-release-details/2019/PGE-Responds-to-Camp-Fire-Announcement-from-CAL-FIRE/default.aspx