Power system insulators are selected to withstand a range of outdoor conditions, providing durability that exceeds a century and low probability of flashover, especially under normal operating voltage. Nonetheless, there are special considerations that affect application of components such as insulators, surge arresters, bushings and live-line tools in ‘cold weather conditions’, defined here as ambient temperature < 0°C.
In cold weather, contamination can accumulate for months. For example, ice, rime or snow can accrete on insulators and bridge the normal leakage distance. In addition, frost can stabilize pollution during melting, acting as a heavy non-soluble deposit.
This edited contribution to INMR by Dr. William Chisholm and Prof. Masoud Farzaneh, respectively Secretary & Chair of IEEE P1820, reviews the process that consolidated worldwide failure experience in cold weather, identified suitable testing procedures and developed guidance in the form of IEEE Standard 1820TM, “Guide on the Selection of Transmission and Distribution Insulators with Respect to Cold Weather Conditions”.


‘Cold Weather’ Conditions
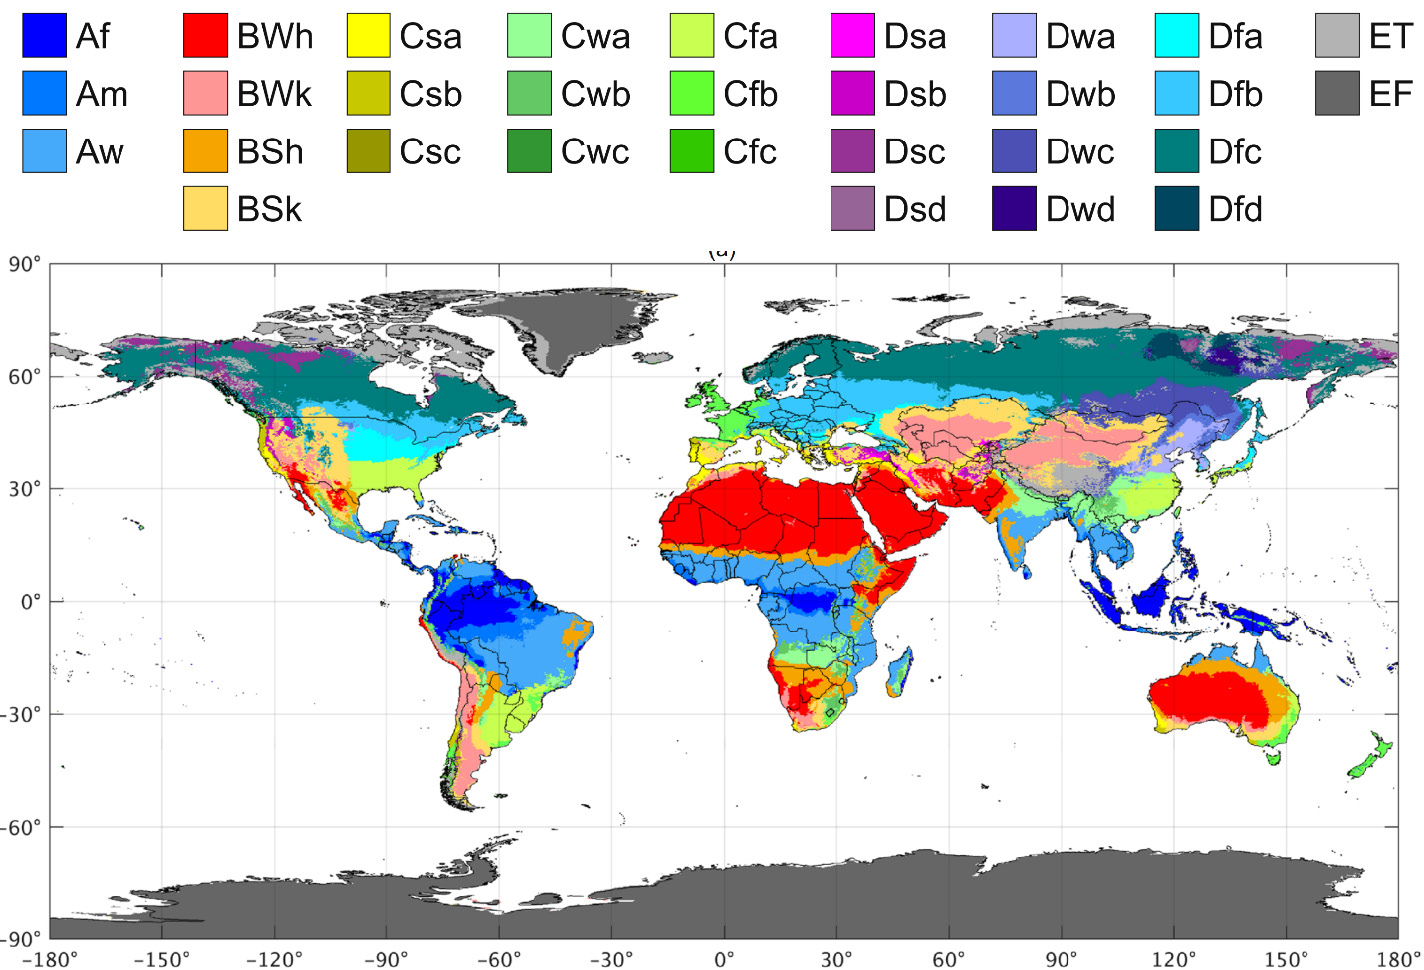
The Koppen-Geiger classification of climate provides an initial guide to the regions of the world that are considered to have ‘cold weather’ conditions. Recently, Beck et al. developed classification data with 1 km resolution and included a ‘future’ map based on climate model projections for the period 2071 to 2100. Corrected color scales in Fig. 1 were revised in 2020.
Classifications are based on:
• Air temperature: mean annual, in coldest month, in warmest month, number of months > 10°C);
• Precipitation: mean annual; amount in driest month; amounts in (driest, wettest) month of (summer, winter).
The first letter of each class (ABCDE) refers respectively to Tropical, Arid, Temperate, Cold and Polar. The class ‘EF’ is Polar-Frost with maximum temperature Thot ≤ 0°C. Counterintuitively, this region would be relatively free of electrical flashover problems, which occur only when an ice, snow, or frost layer warms from below to above 0°C. The ET (Polar-Tundra) region is predicted to shrink in the future, as shown when comparing Fig. 2 to Fig. 1. The temperate climate zone with no dry season and hot summer (Cfa) expands north (in North America) and west (in Europe).
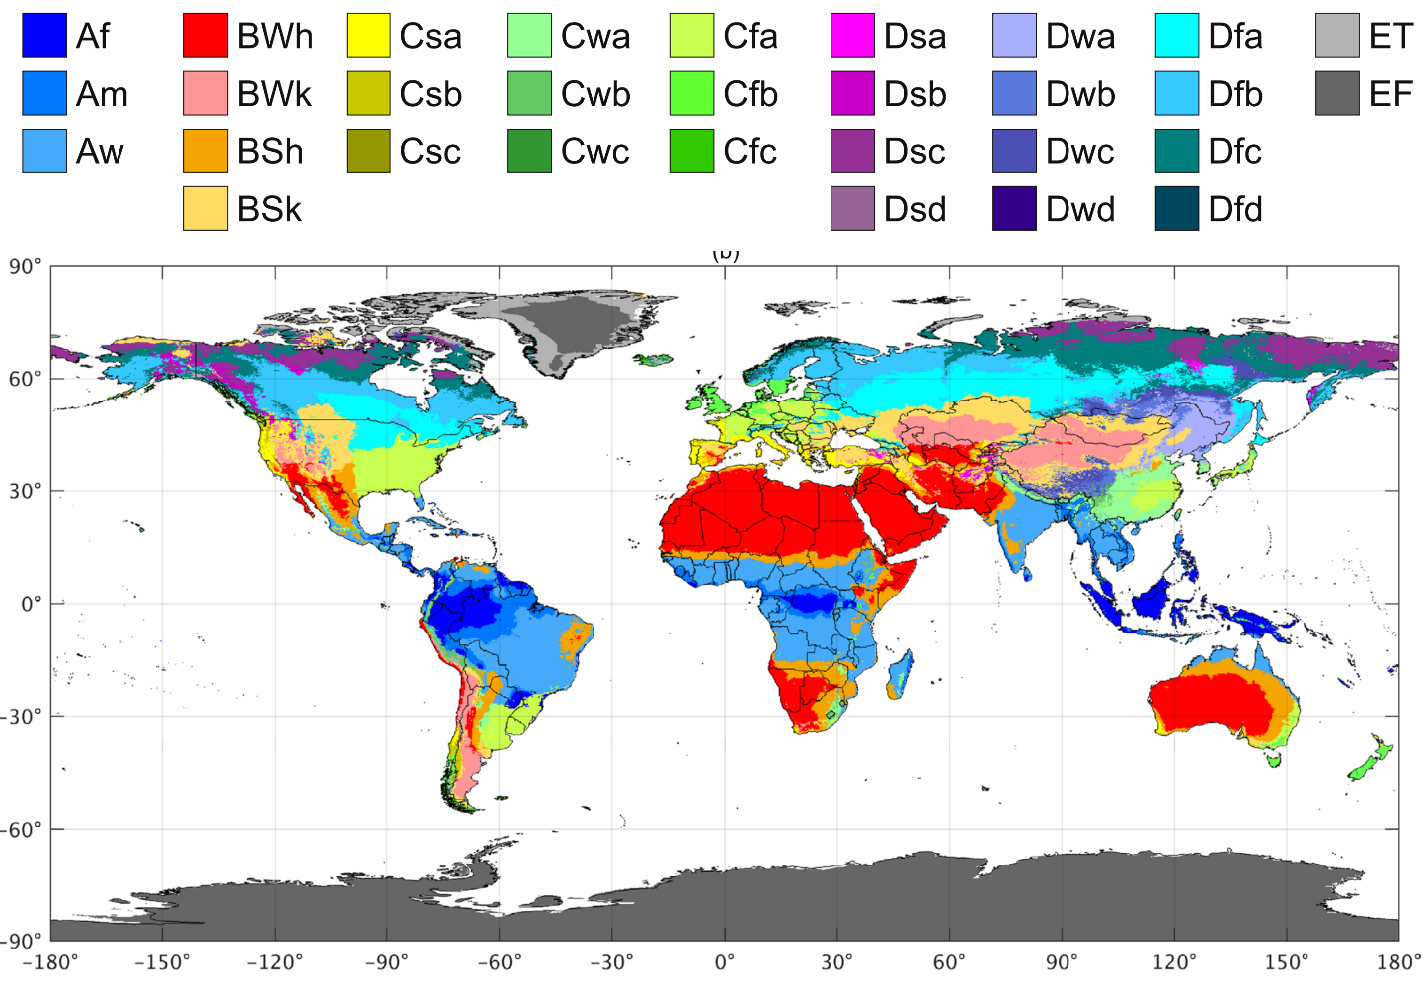
Class D cold regions without dry season in Figs. 1 and 2 are indicated by ‘Df’, with the additional refinement that ‘Dfd’ regions also have Tcold < -38°C, which calls for extra care in metallurgy. Regions ‘Dw..’ have dry winters and less risk of electrical flashover from accumulation and melting of freezing precipitation but perhaps more risk of flashover from accumulation of pollution in cold fog exposures.
Class D regions, generally north of 30° north latitude, are of greatest interest for winter conditions. The bright-green ‘Cf’ regions, temperate with no dry season, extend to the north in the future. However, evidence from the United Kingdom, South Africa and New Zealand confirm that occasional icing events including widespread electrical flashovers do occur in Class ‘Cf’ regions.
One advantage of the new resource is availability of the open-source dataset, at www.gloh2o.org/koppen in digital form, for re-plotting using MATLAB or other applications.
58 Years in Icing Performance of Outdoor Insulators
In 2014, the Institute of Electrical and Electronics Engineers (IEEE), Dielectrics and Electrical Insulation Society (DEIS) celebrated 50 years of activity by inviting reviews of specialized topics, including icing performance of outdoor insulators. In broad strokes, engineers of the 1960s efficiently solved a problem with evolution of HV to EHV systems, i.e. the need for increased electrical separation for adequate switching surge performance. Until the 1950s, linear scaling of dry-arc distance from, e.g. 1 m at 115 kV to 2 m at 230 kV gave adequate outdoor performance, despite the high magnitude of switching overvoltages.
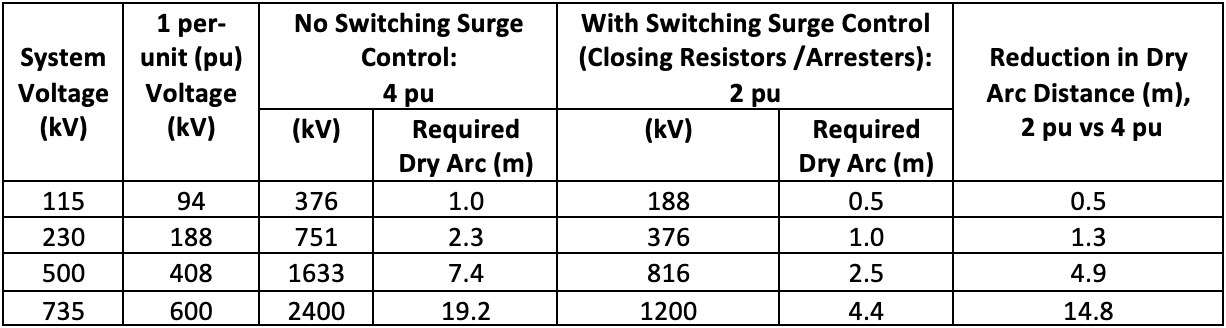
Scaling from 230 kV to 500 kV (used for example in Ontario in early 1965) or to 735 kV (used in Quebec in 1965) showed that solutions to reduce magnitude of switching overvoltages were necessary. New tools, including analog and digital models of power system networks, suggested that insertion of surge-impedance matching resistors (closing resistors) in two-step circuit breakers provided good mitigation.
During the late 1960s, considerable improvement in performance of surge arresters was realized with the rapid substitution of doped zinc oxide (metallic oxide) varistors for silicon carbide materials. This promise has been now been realized with modern station and line arresters. Future suppression of slow-front overvoltages to less than 1.3 pu is under discussion in CIGRE for UHV systems at 1000 kV system voltage.
As pointed out in the DEIS review, one consequence of this engineering achievement of reducing maximum switching surge overvoltage was that the everyday line-voltage stress per meter of dry arc distance increased from 70 kVrms line-to-ground per meter to levels above 100 kV/m. With the same insulator profiles, there was a similar increase in the operating voltage stress across leakage distance, with corresponding degradation in contamination flashover performance. For these reasons, integrated insulator selection and tower head geometry dimensioning evaluates three main aspects of reliability:
1. Lightning performance;
2. Switching surge performance; and
3. Contamination performance.
Lings et al. described development of commercial ac power systems and was facilitated by research programs such as “Project EHV” (1958-1964) and “Project UHV”, along with test facilities at American Electric Power (AEP), Bonneville Power Administration (BPA), Bely Rast in the former USSR (1976) and Tokyo Electric. Design examples for the 1000 kV Changzhi – Nanyang – Jingmen project in China (operation in 2009, total length 640 km) and an 1100 kV system in Japan (operated at 550 kV) are found in IEEE Standard 1863.
Melting ice and snow are not mentioned but appear as refinements to the selection of leakage distance through a form of site pollution severity (SPS) assessment, modeled on IEC 60815 concepts. An icing disaster in southern China, for example, was reported to have caused more than 10,000 icing flashovers in addition to mechanical collapse of 8381 transmission towers operating at from 110 kV to 500 kV.
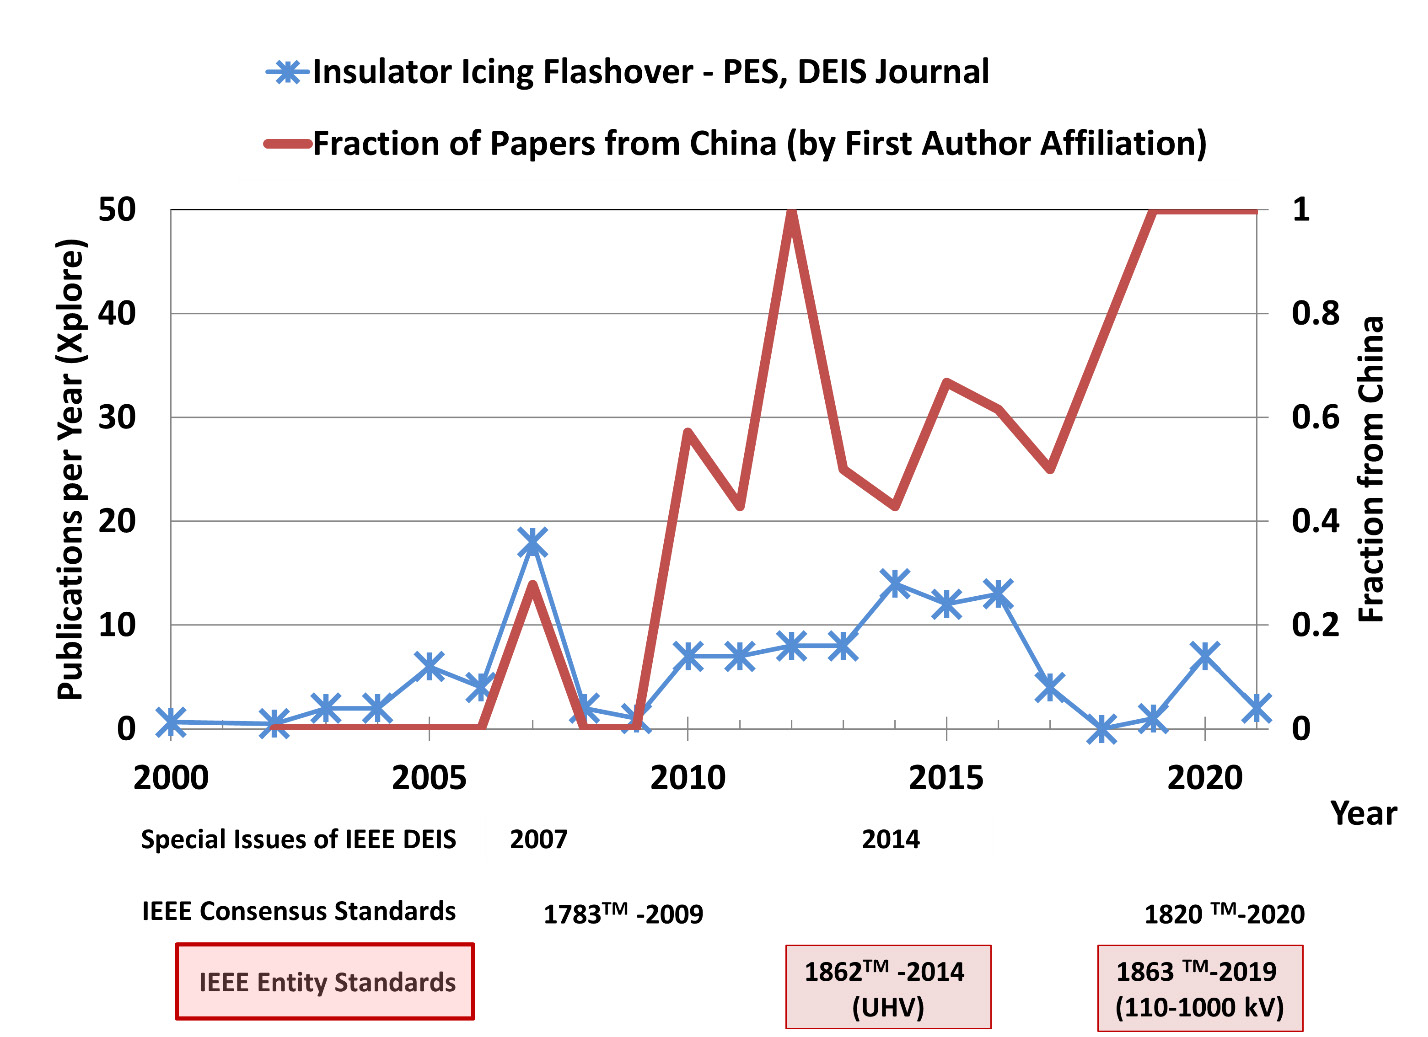
Fig. 3 shows that IEEE journal publication participation from Chinese researchers increased after this milestone event, along with invitations to contribute to a DEIS special issue on the topic in December 2007. Investments in large (25-m tall) UHV climate chambers and other facilities for reproducing freezing conditions in China now play an important part in scientific and technical advancement of this subject. The timeline in Fig. 4 notes 2007 and 2014 as years in which special issues of DEIS were devoted to icing problems, along with the publication dates of four relevant IEEE Standards.
• 1783TM -2009, IEEE Guide for Test Methods and Procedures to Evaluate the Electrical Performance of Insulators in Freezing Conditions (DEIS, Consensus Standard)
• 1862TM-2014, IEEE Recommended Practice for Overvoltage and Insulation Coordination of Transmission Systems at 1000 kV AC and Above (IEEE-Standards Association, Corporate Advisory Group, Entity Standard)
• 1863TM-2019, IEEE Recommended Practice for Overvoltage and Insulation Coordination of Transmission Systems at 1000 kV AC and Above (IEEE-Standards Association, Corporate Advisory Group, Entity Standard)
• 1820TM-2020, IEEE Guide on the Selection of Transmission and Distribution Insulators with Respect to Cold Weather Conditions (DEIS and PES, Consensus Standard)
The list distinguishes “Consensus Standards”, the traditional development model that draws on the expertise of individuals who have joined a technical committee (here DEIS Outdoor Insulation Committee or Power and Energy Society Transmission and Distribution Committee) and the IEEE Standards Association, and “Entity Standards”.
The Entity development process is described fully on the IEEE-SA website:
https://standards.ieee.org/faqs/cmm/#6.
The IEEE SA Entity Standard development process requires paid corporate membership while IEEE SA individual standards (Consensus Standards) call for a paid individual membership that is 72x lower than the Tier 1 annual corporate fee. Basic (non-entity) members, including those nominated by their technical committees, have some rights to observe but not to vote in the standard development. “In the entity model, participants are expected to support (financially and otherwise) the standards development process and to benefit from it”. IEEE-SA ascertained, through benchmarking, that its entity-standard corporate member participation fees are competitive with other organizations.
Despite these developmental barriers, there has been some degree of coordination among the four listed standards. Standard 1863-2019 cited 1783-2009 in its discussion of the dry arc distance needed for adequate icing performance in China. The relevant aspects of 1863-2019, and review comments from experts in China, were then incorporated in the development of 1820-2020. As examples, an important map of insulator site pollution severity, originally presented at the 2015 INMR WORLD CONGRESS, was used to establish a threat level of 75 mg/m3 for annual average density of particulate matter larger than 2.5 mm (PM2.5), observed with satellites. The composite map of SPS against non-soluble deposit density (NSDD) and equivalent salt deposit density (ESDD) for China differs somewhat from the map found in IEC 60815, and curve fitting was applied to both charts. The recommendation in 1863-2019 to limit dry-arc stress to 50 kVrms per meter of dry arc distance for fully bridged ice layer in melting condition was placed into context, considering also typical EHV systems (100 kV/m), HV systems (70 kV/m), and systems with adverse marine or road-salt exposure (60 kV/m).
Evolution of Standard 1820TM – 2020
Contributions at previous INMR WORLD CONGRESSES in 2011 and 2013 provided the motivation for developing a new standard that describes insulator selection for the specific cold-weather conditions that can lead to electrical flashovers. Additional experience in the previous decade have raised the profile of ice, rime and snow flashover risks and strengthened confidence in some underlying assumptions.
Recognizing Needs
Overhead power systems are exposed to a wide range of external threats and interference, ranging from low-probability, high-impact (meteorites, airplanes) to high-probability, low-impact (continuous wind, one lightning flash per km each year). Reliability problems associated with electrical flashovers of insulators under ice and snow conditions fall into the first category.
Number of ice storms per year is relatively low. But ice storms can lead to many flashovers on the most critical UHV and EHV lines when others continue to operate normally. The primary function of an icing design guide is to place the risks of flashover into the overall context of line and power system reliability, which can lead to simply accepting the risk of icing flashovers in areas of low ice and snow incidence, in the same way that lightning flashovers are accepted on unshielded EHV transmission lines in areas of low lightning flash density.
Design Goals
One challenge in managing risk of failure on overhead lines is selecting a suitable performance goal. Utilities with cold weather conditions are used to investing in stronger towers, shorter span length, increased horizontal clearances to deal with galloping from modest ice accretion and excessive sag from heavy ice loading. In some regions, the normal practice of shielding, i.e. overhead groundwires above the phases, is not used in order to mitigate possibility of conductor-to-groundwire contact from ‘sleet jump’ or de-icing activity. This is a modest example of trading off improved cold-weather reliability for degraded warm-weather (lightning season) performance.
The published version of Standard 1820TM reviews some reliability goals, such as number of lightning outages per 100 km of overhead line length per year (best for transmission lines) and mean time between failures (MTBF) for stations. In the discussion, “failure” can be a single phase-to-ground flashover of a post insulator or bushing or can be defined as the complete loss of a substation from multiple flashovers over a short period.
Icing performance reliability criteria were equated to some expectations for UHV and HV/EHV lines in China:
• UHV transmission line acceptable lightning outage rate 0.1 to 0.5 flashovers per 100 km-year;
• UHV switching surge flashover rate of 1 per 1000 switching operations;
• UHV MTBF of 1000 years for GIS and Mixed-Technology Switchgear;
• EHV switching surge flashover rate of 1 per 100 switching operations;
• Relative Overhead Line Reliability MTBF of 50, 150, 300, 700 and 1700 years.
The decision to abandon use of overhead groundwires can be guided by design shielding failure rate in IEEE Standard 1243, of 0.05 shielding failures per 100 km per year. This is a product of the exposed width of the line and the ground flash density, which can be less than 0.1 flashes per km2 per year in some cold-weather regions.
Convergence & Coordination: Log Normal Distributions
Natural phenomena are evaluated with simple statistical models. Any constraint, including that the parameter X is >0, might introduce skew in the probability density when plotted on linear scale. In the limit of many observations, most distributions of natural phenomena with positive values that vary over several orders of magnitude become log-normal, which is to say that the logarithm of X is normally distributed.
Lightning protection calculations evaluate probability of occurrence of a threat current that just causes a backflashover across the insulation of a tower, given its footing impedance and other parameters. Detailed lightning outage rate estimators such as EPRI TFLASH and Sadovic Sigma SLP compute the threat current and its probability at each tower, considering its specific height, local soil conditions and grounding. Simplified methods can also carry out this calculation assuming that every tower has the same soil conditions. The influence of the log-normal distribution of soil resistivity was illustrated in a worked Excel spreadsheet example, using log-logistic approximations to simplify the process. Simplified methods are more suitable during the design phase, when geotechnical work at each tower has not yet been completed and size of each foundation element or anchor is not known.
More recently, a similar statistical approach has been used for selecting insulator dimensions in contaminated conditions. As example, the ”Insulator Selection Tool” software allows users to explore influence of the standard deviation of ln(ESDD), using fixed values of 0.6 or 0.8. Based on the findings of Engelbrecht et al., probability of exceeding a value of ESDD at seven sites showed the common value of standard deviation of ln(ESDD) of 0.74, even though median ESDD level ranged from 0.5 to 170 mg/cm2 (0.0005 to 0.17 mg/cm2).
The ‘width’ of log-normal distributions for natural parameters has been reviewed. Ice thickness, t, in Norway had the widest dispersion (sln t = 1.32), followed by soil resistivity r (sln r = 0.9) for a global review, then ice weight W in the Czech Republic (sln W = 0.81), pollution (ESDD) and precipitation water conductivity g (sln ESDD = sln g = 0.74) and with the narrowest distribution width, lightning first negative return stroke peak current I (sln I = 0.66). The Standard also offers a convenient way to convert the value of sln X to an exponent b in a log-logistic approximation. This used to be more important when the log-normal functions were not available in common spreadsheets such as Excel.
Convergence & Coordination: Leakage Distance Selection with USCD
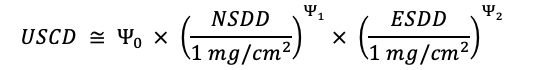
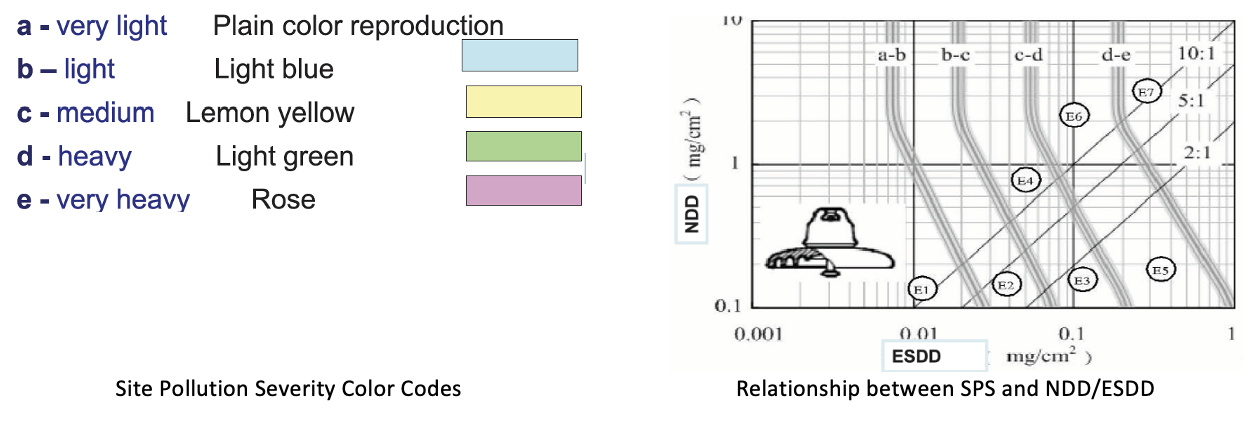
In the previous decade, there has been broad although not complete acceptance of the IEC 60815 approach to classify site pollution severity (SPS). Field data showing measured values of ESDD and NSDD are plotted on a classification chart that yields SPS levels of very light, light, medium, heavy, and very heavy. Insulator leakage distance selection then follows a unified specific creepage distance (USCD) prescription. This topic has been discussed in many INMR presentations and tutorials.
In detailed review, it was found that there were some discrepancies in country specific SPS classification charts and those published by IEC. It is convenient to show these using a general form:
where the constant Yo varies from 67 to 74 mm per kV of line to ground voltage, the exponent for NSDD is agreed to be Y1 = 0.06 and the exponent for NSDD Y2 varies from 0.136 to 0.194.
The constants were obtained by digitizing the boundaries of each classification and equating these combinations of (NSDD, ESDD) to the threshold recommended values of USCD. An IEEE contamination flashover model has no factor for NSDD (Y1 = 0) and uses Y2 = 0.213, and this is appropriate (with adjustment to Yo ) for regions where a strong relation between ESDD and NSDD such as NSDD = 5 x ESDD is found in field test results.
In laboratory tests, a constant value of NSDD is generally used to stabilize the electrically conductive ESDD. Standard 1820 makes the case that, for cold fog conditions, NSDD is extremely high, considering the mass density of typical frost layers. This moves classification of SPS to the upper limit of NSDD in the provided charts. Adjustment to SPS classification also considers that the frost layer is an insulator at -10°C and suggests a range of values to convert ESDD at 20°C to a lower value of ESDD at 0°C.
Convergence & Coordination: Relating Ice Thickness & Weight
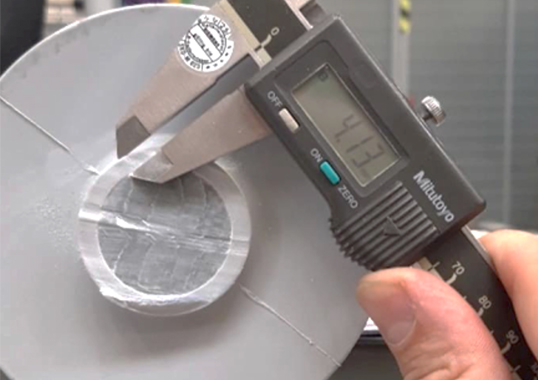
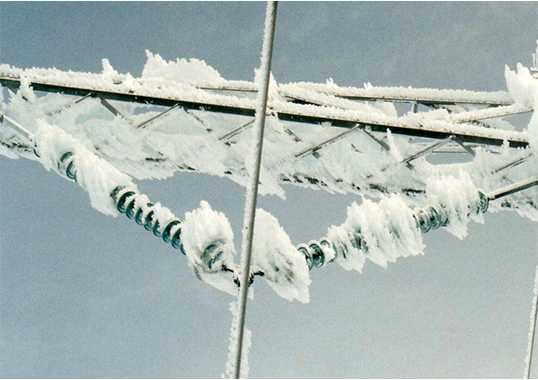
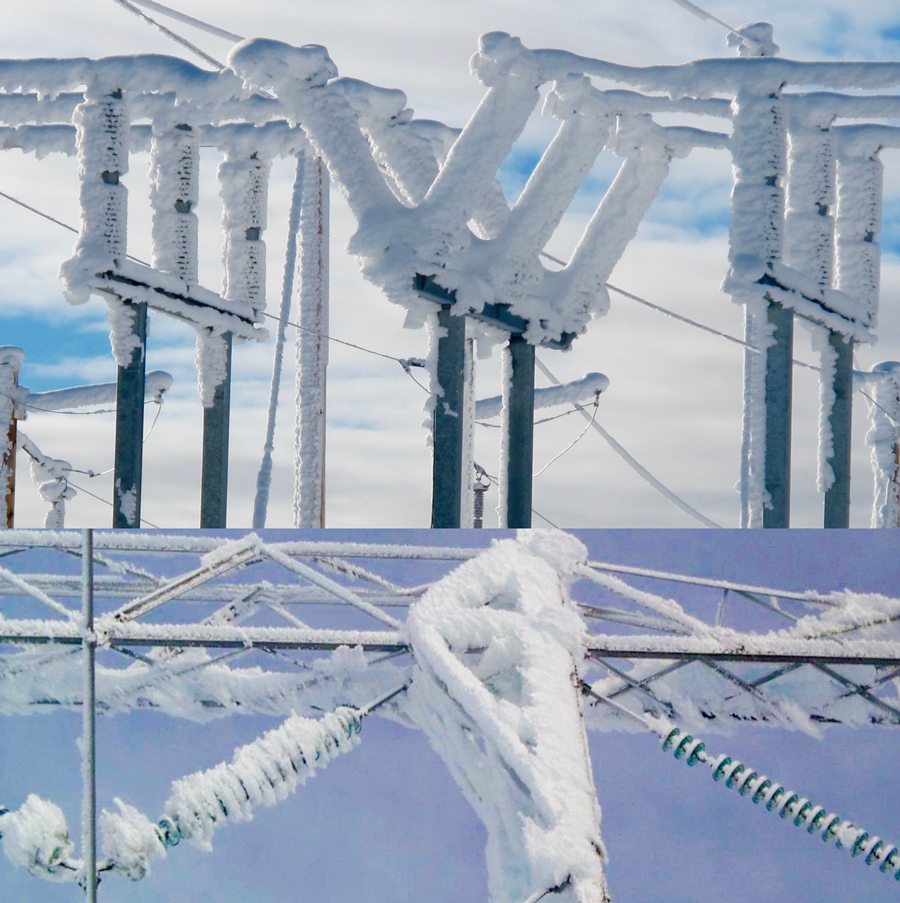
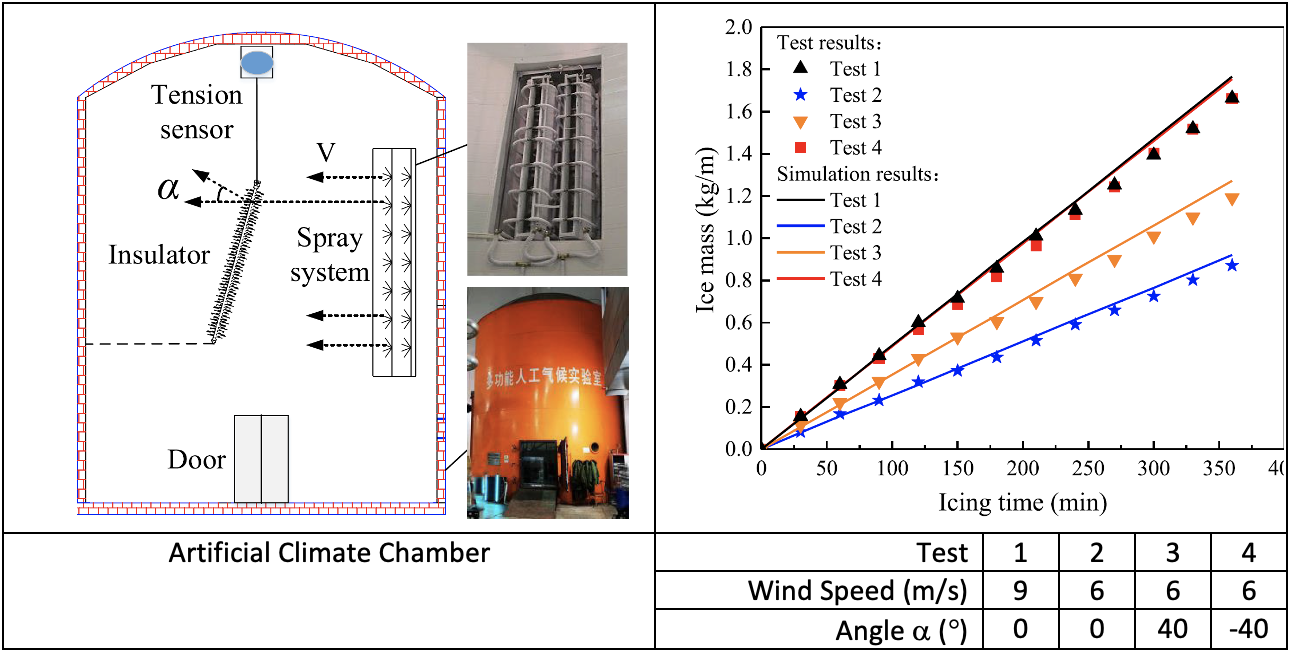
Reference measurements for power line ice accretion are the thickness and weight of deposit on a 25 mm cylinder. Ice, rime and snow accumulate in different patterns on vertical insulators and are ‘bridged’ when the inter-shed or inter-disc space is filled. For glaze-ice conditions, accumulation of 5 or 6 mm on a 25-mm diameter reference cylinder is considered sufficient for icicles to bridge a station-post insulator with 300 mm diameter. The increased spacing between discs of a ceramic insulator string requires reference accretion of about 10 mm to be bridged. Test results, such as in Fig. 4, show a wide range of bridging patterns on non-ceramic insulators.
Convergence & Coordination: V-Strings for EHV & UHV Lines
Distribution of ice plays an important role in electrical flashover performance. The three patterns of ice accretion on the non-ceramic insulator in Fig. 5, for example, suggest that there will be full bridging for a=0°, which bypasses the dry arc distance and is prone to flashover during melting. By contrast, there are air gaps between the ice accumulation on each shed with the same exposure for an inclination a = ±40°.
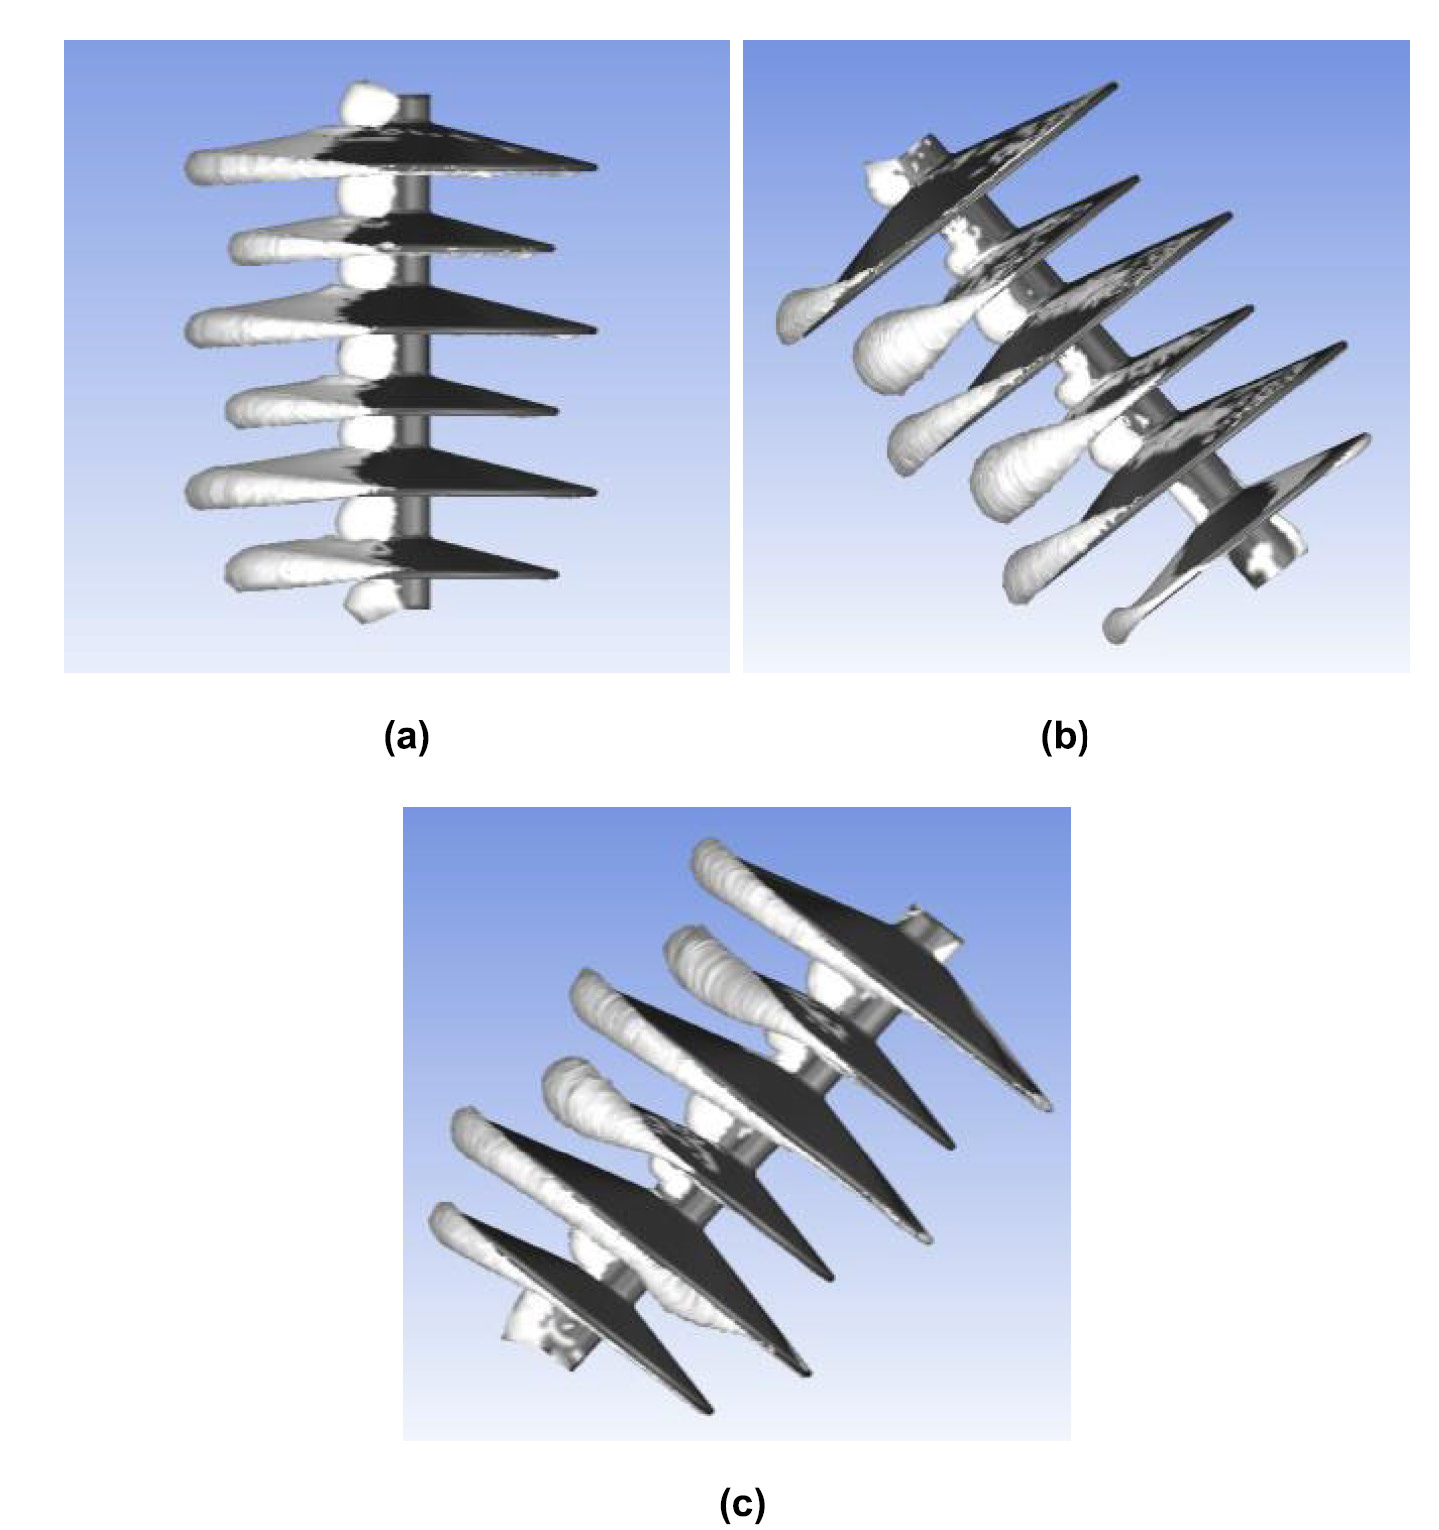
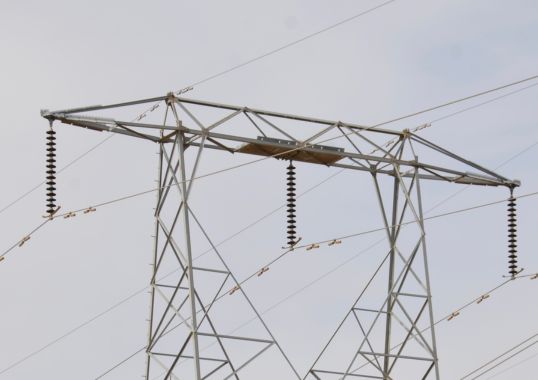
Each air gap tends to add additional flashover strength, given by the voltage drops from arc roots onto the ice surface. For this reason, multi-gap flashover models suggest and field experience confirm that V-strings tend to resist icing flashovers much better than vertical insulator strings with a = 0°. A strong point of consensus has been that ceramic disc V-strings should be used for EHV and UHV lines, as a practical alternative to long vertical insulators that satisfy operating voltage gradient limits of ≤ 70 kVrms line-to-ground per meter of dry arc distance.
Satellite Measurements of PM2.5 Using SPS
Faced with selecting insulators for regions with limited data or where time trends are important, insulation coordination specialists are continuing to explore the possible applications of satellite data to estimate SPS. This extends a tradition to estimate SPS from ground-based measurements of dustfall.
Several researchers have had success in estimating annual average particulate matter density PMD (PM2.5, in mg/m3) at ground level from aerosol optical depth (AOD). Following established practice for ground-based measurements, the satellite PMD estimates are corrected to a reference relative humidity (RH) value of RH=35%. This process has benefitted from comparison with ground-based calibration instruments.
Satellite measurements of AOD have been processed into datasets of PM2.5 density and are posted online. There are several ways that these data can be viewed. The highest-resolution data files have 12,500 latitude coordinates (55°S to 70°N) and 36,000 longitude cells. These make large datasets that cannot be practically imported into Excel, unlike the maps from 2013 with 0.1° ´ 0.1° resolution.
The Standard 1820 is intended for global application and provides global maps of average PM2.5, corrected to 35% RH, for 2015. Two maps for each continent are provided, one including natural dust and sea salt and the other excluding these components, so as to capture anthropogenic sources. Fig. 6 shows the state of the art in 2022, which gives annual datasets for North America consisting of total PM2.5 along with the fraction of aerosol associated with seven different components. The SO4, NO3 and NH4 species are commonly monitored in precipitation chemistry studies, and, along with H+, tend to dominate electrical conductivity of rain, snow, and ice samples.
The electrically conductive fraction of surface pollution, expressed as ESDD, is a strong function of sea salt (SS) density near land-ocean borders. Organic matter (OM), black carbon (BC) and mineral dust can be lumped together as contributions to non-soluble deposit density (NSDD). There has been increasing interest in monitoring accumulation of these components, especially BC, after wildfires.
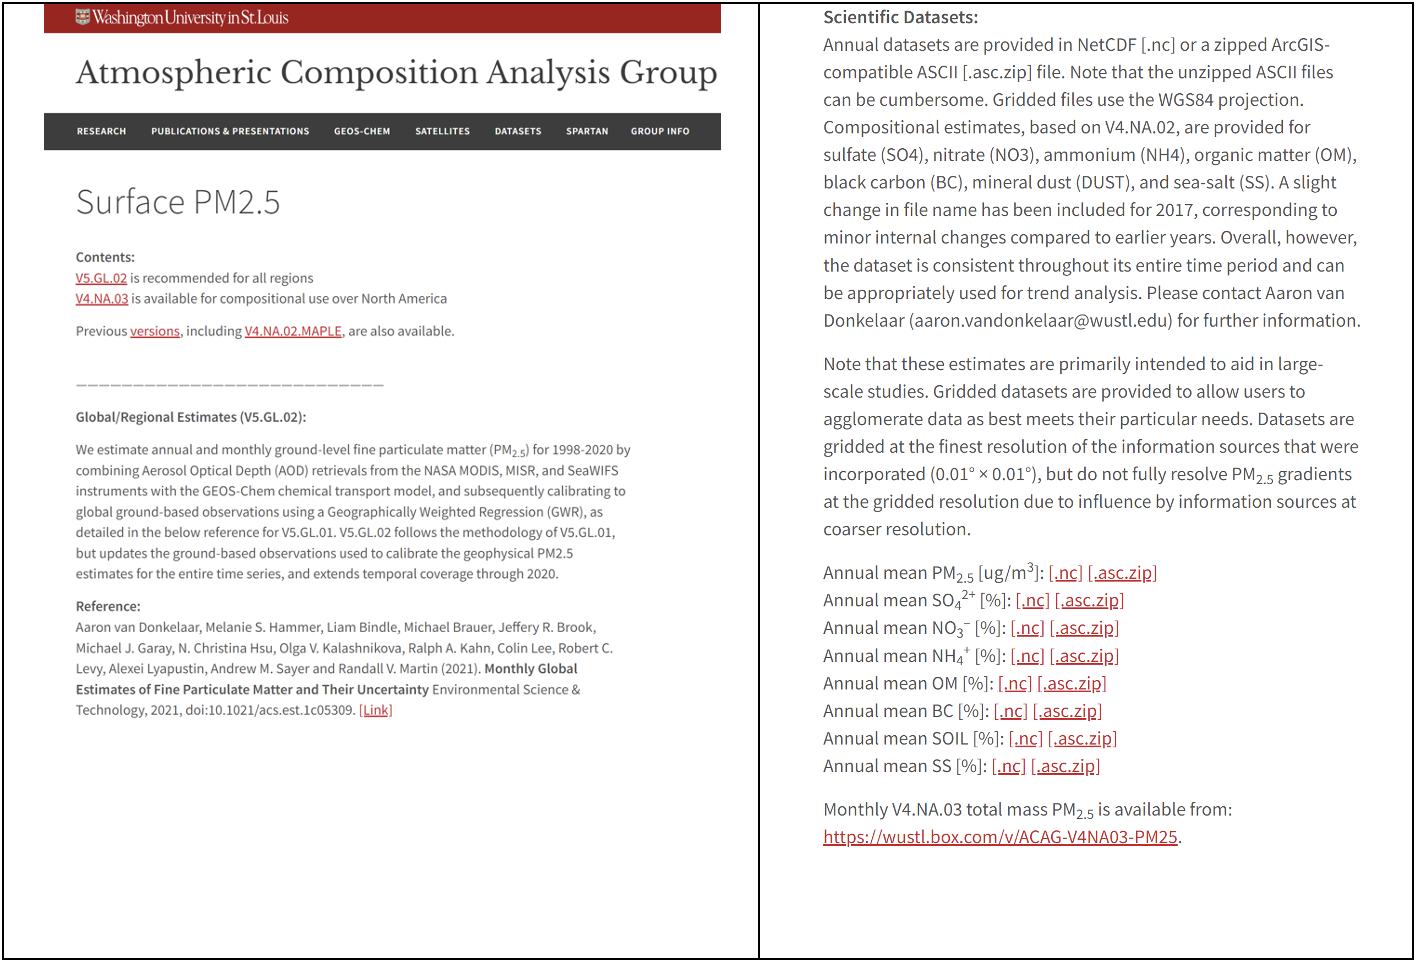
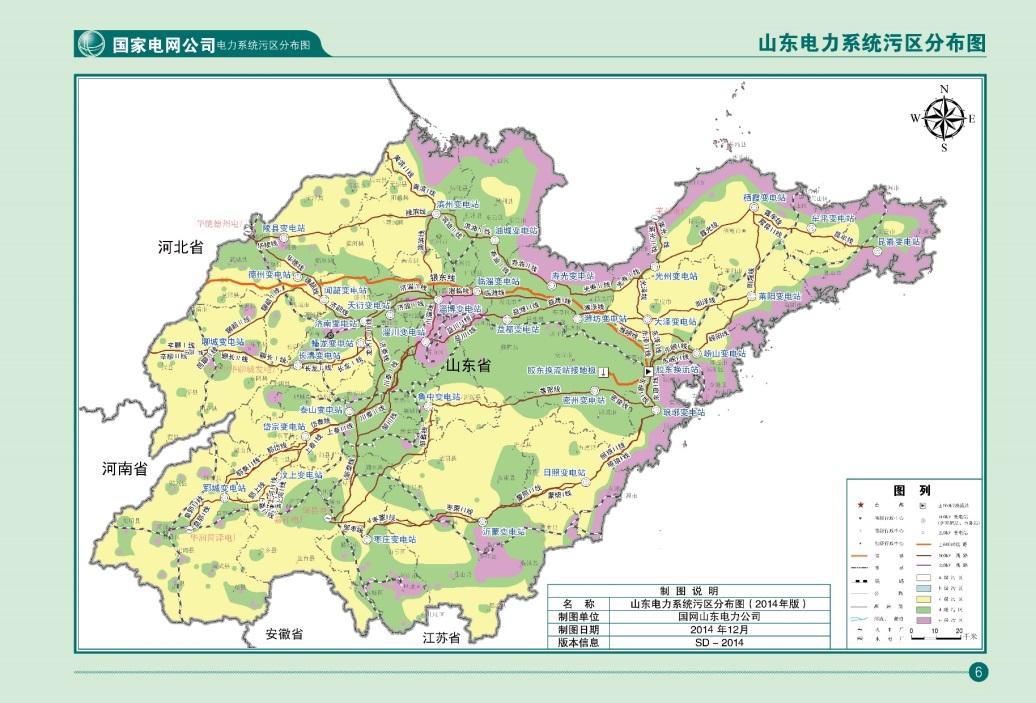
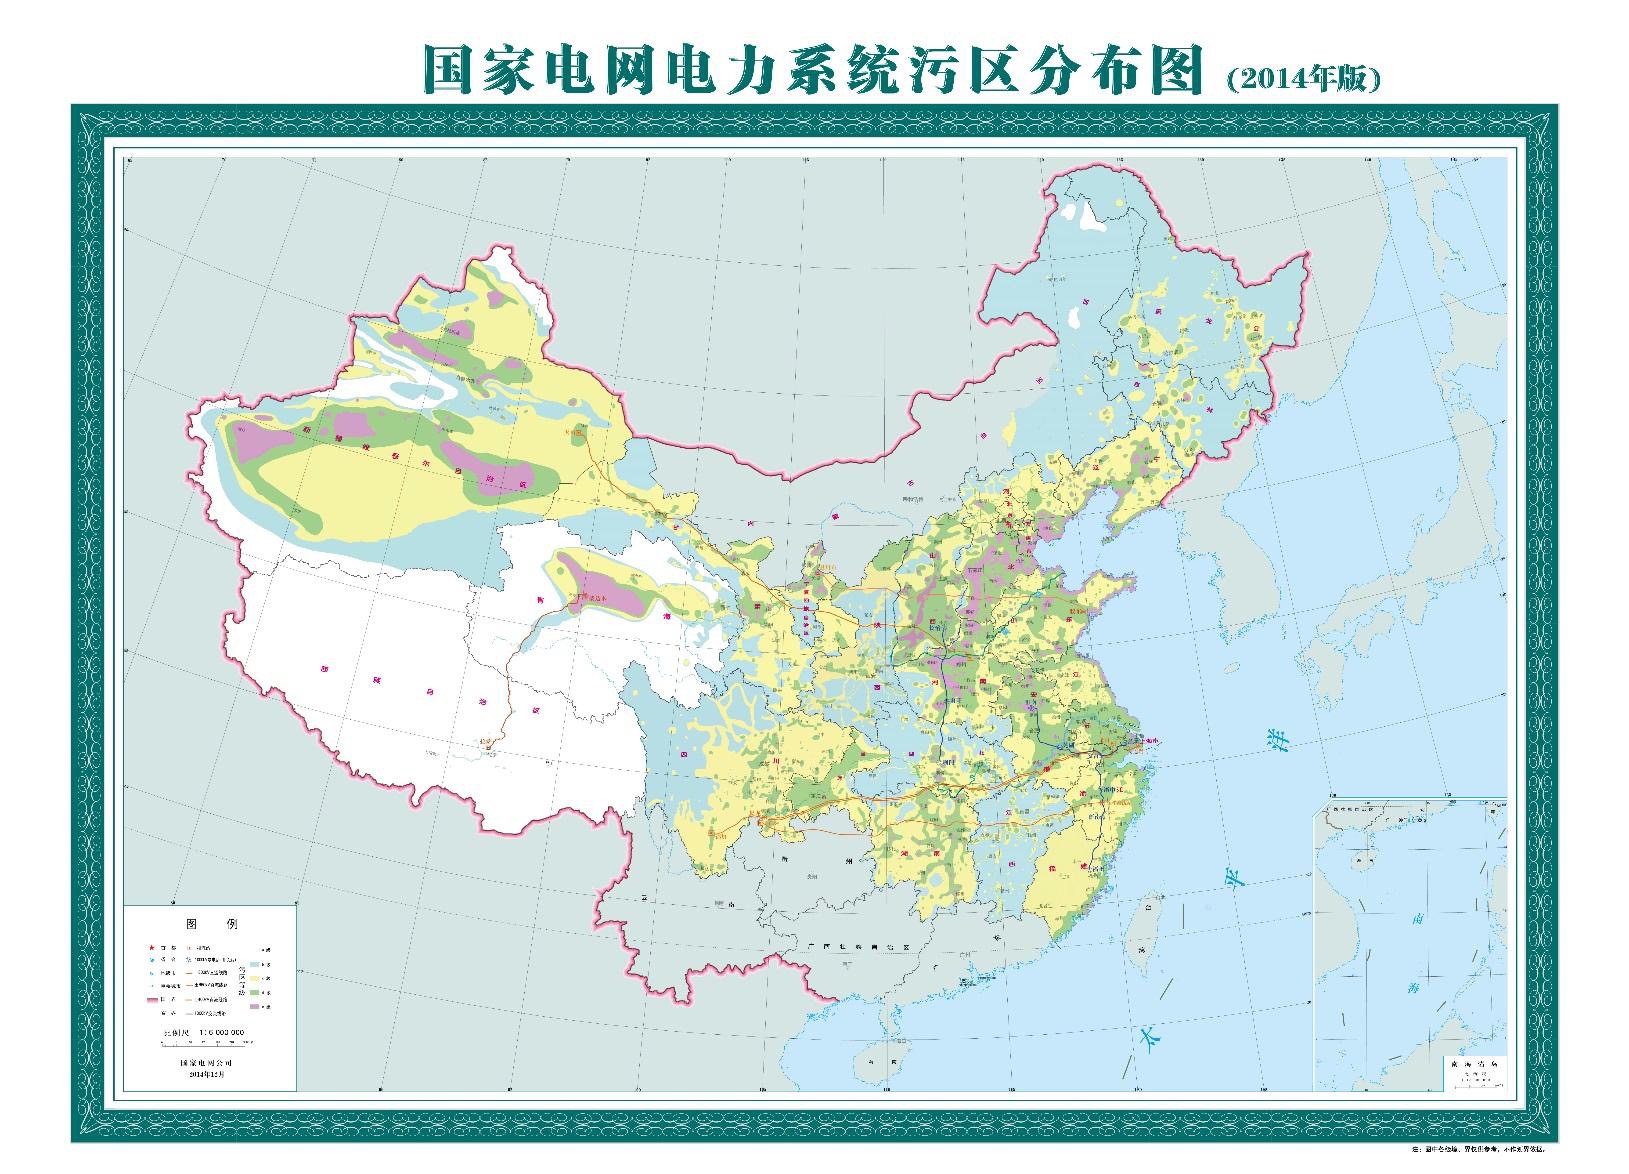
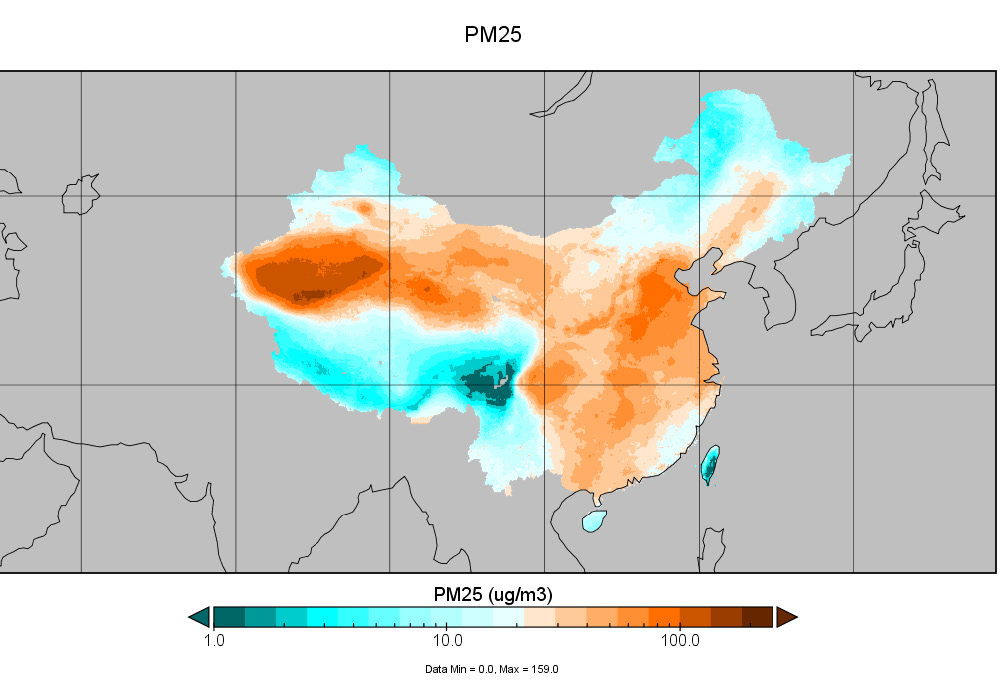
One practical approach to viewing and plotting downloaded NetCDF files is to install an application, Panoply. IEEE Standard 1820TM exploits the reference site pollution severity map for China, based on almost 93,000 measurements over the period 2007-2014, and total PM2.5 measurements for China, sampled in 2012. A detail of the insulator Site Pollution Severity (SPS) map in Fig. 7 shows a band of very heavy severity around the seacoast of Shandong Province. There are other areas of very heavy SPS throughout China, as in Fig. 10. These are approximately matched to areas where the satellite-based estimates of PM2.5 density approach 100 mg/m3. Based on this comparison, a threshold of total annual PM2.5 > 75 mg/m3 has been advanced as an indicator of very heavy pollution levels in Standard 1820TM – 2020 for those regions that do not have direct measurement programs to establish SPS.

Climate Factors in Winter Conditions
Occurrence of winter precipitation is carefully recorded in most countries to World Meteorological Association (WMO) standards. Maps describing suitable design icing levels form an important component of the mechanical design of overhead lines. While the highest anticipated levels of accretion on reference conductors are needed for this purpose, electrical design must also deal with more frequent but less severe icing events that do not cause mechanical problems yet can still lead to electrical flashovers.
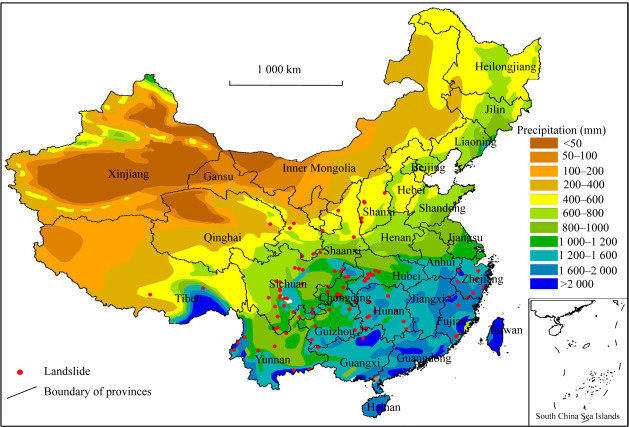
Presence of pollution on insulators is one contributing factor. Pollution accumulates during dry periods with a mass accretion rate given by the pollution density (g/m3) multiplied by a deposition velocity (m/s). The efficiency of accumulation on any surface – plant leaf, polymer or ceramic – depends on orientation to the wind, roughness and other properties. Insulator surfaces tend to be washed efficiently by natural rain. As such, identifying regions that are likely to have winter flashover problems begins with an average annual precipitation map, such as shown in Fig. 11.
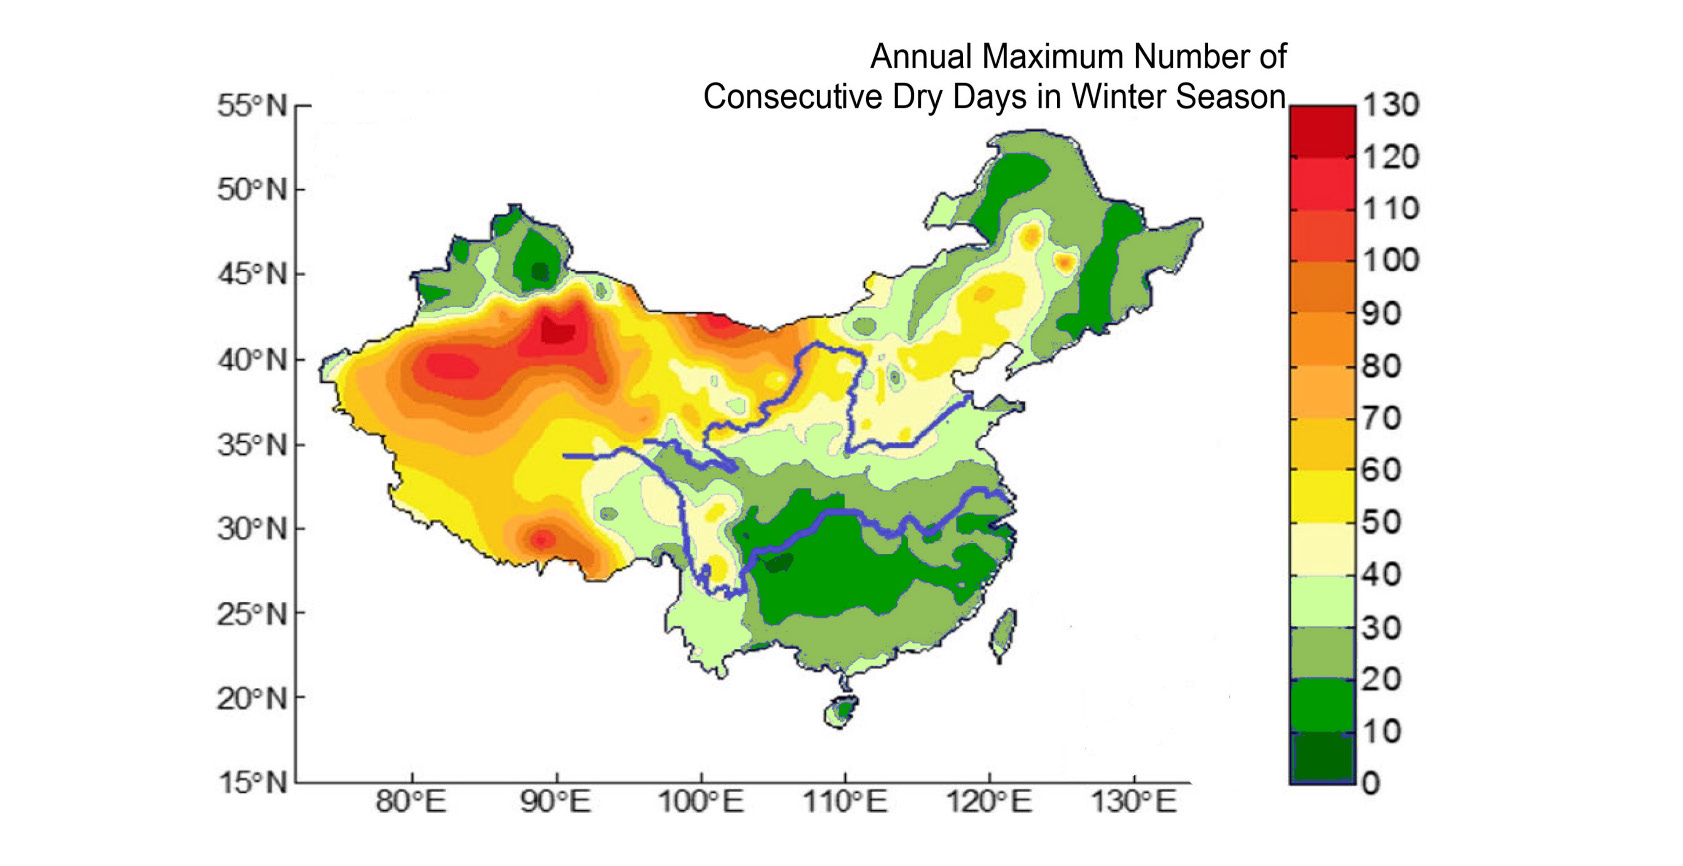
With research, it becomes feasible to find specific data for number of consecutive dry days during winter. In the case of China, for example, Fig. 12 shows relatively short duration in the southeast, rising to more than 50 days without rain in the northeast around Beijing.
Both the pollution map and the map of number of days without rain are needed to estimate local winter-season maximum ESDD level.
Insulator selection based on site pollution severity has been developed by CIGRE based mainly on local measurements of dustfall at ground level. Dustfall is a measure of total pollution accumulation on an upward facing surface, usually sampled over one-month periods with separate readings for dry and wet conditions. During winter conditions, for an 8:1 increase in dustfall, there has been shown to be a progressive increase in the linear escalation rate of ESDD versus dry days on post insulators, in the range of 0.2 to 3.1 mg/cm2 per day.
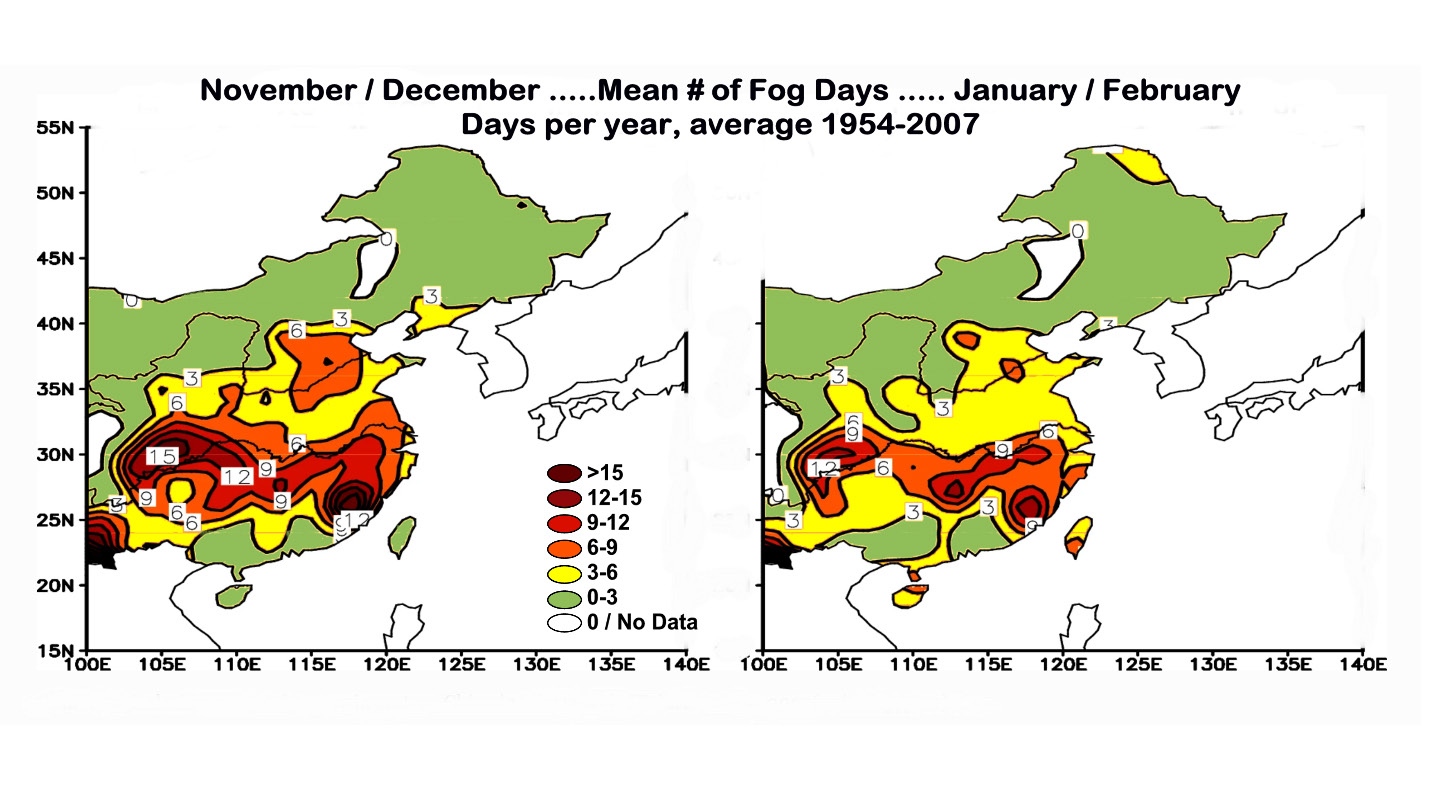
A third component is needed to quantify risk of cold fog (leakage distance) flashover risk. This component is the number of days with fog during winter months. Some regions of China have a risk of fog every other day in winter, as shown in Fig. 13. The most dangerous fog events are those that follow many consecutive dry days in winter. These tend to occur in March and April in the Northern Hemisphere.
Next Steps
New combinations of system voltage and phase-to-ground BIL in IEEE Standard 1427-2006 Table 2 are needed to support use of line voltage stress below 85 kV¬ rms line-to-ground per meter of dry arc distance. For example, 550 kV systems in icing regions need to consider using 2050, 2175 and 2300 kV BIL post insulators. None of the BIL levels listed in Standard 1427 Table 2 for 800 kV systems are suitable for icing regions, since they provide line voltage stress exceeding 118 kV/m. By contrast, the 8.3 m clearances in IEEE Standard 1862 for UHV do give insulators with 77 kV/m stress that should perform reliably under many icing conditions. However, service experience in China with stress of 65 kV/m for EHV and 70 kV/m for UHV do not fully satisfy desired reliability level, with three flashovers per year under light icing conditions when using 62 kV/m stress. Diagnosing the conditions that can lead to UHV line voltage flashovers is a priority in order to advance guidance for lower voltage levels.
The relationship between ice accretion on a reference rotating cylinder and the weight of ice accumulating on insulator strings needs further laboratory and field study. Hopefully, this will lead to insightful computer modeling. The accretion model in IEEE Standard 1820 is based mainly on insulator diameter and is more suitable for extremely heavy icing than for the important distinction between partial and full bridging by icicles in the range of 5 to 10 mm radial ice thickness.
It has been recognized that live-line tools used under freezing conditions are especially vulnerable to live-line flashover, with four documented accidents in Canada. In addition to very low contamination levels of <3 mg/cm2 and non-visible ice thickness from handling tools with leather glove covers, tests have shown that arcing from the head of the tool to the conductor on approach increases risk of flashover. Guidelines to respect a voltage stress of 73 kVrms line-to-ground per meter of live-line tool length have been published. To be clear, the typical in-service tests (including tools that failed under freezing conditions) pass in-service ac tests of 100 or 75 kV per foot (328 or 246 kV/m) at room temperature.
Previous INMR presentations have shown that suitable glove hygiene can contribute to safe live-line work programs during winter. The advice in 1820TM-2020 has been advanced into the IEEE Standard 516 on live work methods and should find a similar mention in the activity of IEC Technical Committee 78. Most of IEEE Standard 1820 deals with suitable dimensioning for conventional silicone rubber, glass and porcelain insulator materials. A recent CIGRE Green Book introduces an extensive set of research and application opportunities in terms of ice-phobic surfaces, ice-resistant profiles and de-icing strategies.
References
[1] IEEE DEIS Outdoor Insulation Committee and PES Transmission and Distribution Committee, “IEEE Std. 1820-2020, IEEE Guide on the Selection of Transmission and Distribution Insulators with respect to Cold Weather Conditions,” IEEE Standards Association, New York, 2020 December 3.
[2] H. Beck, N. Zimmermann, T. McVicar, N. Vergopolan, A. Berg and E. Wood, “Present and future Köppen-Geiger climate classification maps at 1-km resolution, Publisher Correction to 2018 10 30,” Scientific Data, vol. 7, no. 274, p. 12, 2020 08 17.
[3] M. Farzaneh and W. A. Chisholm, Techniques for Protecting Overhead Lines in Winter Conditions: Dimensioning, Icephobic Surfaces, De-Icing Strategies, Cham, CH: Springer / CIGRE Green Book, 2022 February 11.
[4] M. Farzaneh and W. A. Chisholm, “50 Years in Icing Performance of OUtdoor Insulators,” IEEE Electrical Insulation Magazine, vol. 30, no. 1, pp. 14-24, January 2014.
[5] IIG (Independent Insulator Group), “IInsulator Selection Tool – IST 2018 Reference Manual, Version 5.0.1,” https://i2group.se/wp-content/uploads/2018/03/IST_Reference_Manual_5_0_1.pdf, Ludvika, Sweden, 2018.
[6] IEEE-SA Board of Covernors, Corporate Advisory Group, IEEE Standard 1863: Recommended Practice for Overvoltage and Insulation Coordination of Transmission Systems at 1000 kV AC and Above, New York, NY: IEEE Standards Association, 2014 May 15.
[7] R. Lings, V. Chartier and P. S. Maruvada, “Overview of Transmission Lines Above 700 kV,” in IEEE PES 2005 Conference and Exposition in Africa, Durban, ZA, July 11-15, 2005.
[8] IEC, TS 60815-1:2008, Selection and Dimensioning of High-Voltage Insulators Intended for Use in Polluted Conditions – Part I: Definitions, Information and General Principles”, Zurich: International Electrotechnical Commission, 2008-10-28.
[9] Z. Su, “Classifying Pollution Severity for HVDC (& HVAC) in China,” in INMR World Congress, Munich, 2015.
[10] W. A. Chisholm and M. Farzaneh, “Progress Report on IEEE Standards for Selecting Insulators with respect to Icing,” in 2011 INMR World Congress, Seoul, Korea, 2011 April 18.
[11] W. A. Chisholm and M. Farzaneh, “Selection of Transmission & Distribution Insulators with Respect to Icing: IEEE P1820 TM,” in 2013 INMR World Congress, Vancouver, CA, 2013 September 10.
[12] IEEE Standards Association, Corporate Advisory Group, Standard 1863: IEEE Guide for Overhead AC Transmission Line Design, New York, USA: IEEE Standards Association, 2019 November 11.
[13] W. A. Chisholm, “Arrester Protection of Lower Voltage Circuits on Multi-Voltage Towers: Issues and Opportunities,” in 2019 INMR World Congress, Tucson, AZ, USA, 2019 October 22.
[14] C. Engelbrecht, I. Gutman and R. Hartings, “A Practical Implementation of Statistical Principles to Select Insulators with respect to Contaminated Conditions,” IEEE Transactions on Power Delivery, vol. 22, no. 1, pp. 667-673, 2007.
[15] Y. Huang, M. S. Virk and X. Jiang, “Study of Wind Flow Angle and Velocity on Ice Accretion of Transmission Line Composite Insulators,” IEEE Access, vol. 8, pp. 151898-151907, 2020 August 28.
[16] M. Farzaneh and J. Zhang, “A Multi-Arc Model for Predicting AC Critical Flashover of Ice-Covered Insulators,” IEEE Transactions on Dielectrics and Electrical Insulation, vol. 14, no. 6, pp. 1401-1409, 2007 December.
[17] CIGRE TF 33.04.01; D.T. Swift (Chair), Polluted insulators: a review of current knowledge: Technical Brochure 158, Paris: CIGRE availabile at e-cigre.org, June 2008.
[18] M. Farzaneh and W. A. Chisholm, Insulators for Icing and Polluted Environments, Hoboken, NJ, USA: IEEE / Wiley, 2009.
[19] T. Jickells, Z. An, K. Andersen, A. Baker, G. Bergametti, N. Brooks, J. Cao, P. Boyd, R. Duce and K. Hunter, “Global Iron Connections Between Desert Dust, Ocean Biogeochemistry and Climate,” Science, vol. 208, no. 05, pp. 65-71, 2005.
[20] A. van Donkelaar, R. Martin, M. Brauer, K. R., L. R., C. Verdusco and P. Villeneuve, “Global Estimates of Ambient Fine Particulate Matter Concentrations from Satellite‐Based Aerosol Optical Depth: Development and Application,” Environmental Health Perspectives, vol. 118, no. 6, pp. 847-855, June 2011.
[21] H. Lee, B. Coull, M. Bell and P. Koutrakis, “Use of satellite-based aerosol optical depth and spatial clustering to predict ambient PM2.5 concentrations,” Environmental Research, vol. 118, pp. 8-15, 2012.
[22] B. Duncan and et al., “Satellite data of atmospheric pollution for U.S. air quality applications: Examples of applications, summary of data end-user resources, answers to FAQs and common mistakes to avoid,” Atmospheric Environment, vol. 94, pp. 647-662, May 2014.
[23] B. Boys, R. Martin, A. van Donkelaar, R. MacDonell, N. Hsu, M. Cooper, R. Yantosca, Z. Lu, D. Streets, Q. Zhang and S. Wang, “ifteen-year global time series of satellite-derived fine particulate matter,” Environ. Sci. Technol, vol. 48, no. 19, pp. 11109-11118, September 2014.
[24] L. Lamsal and et al., “U.S. NO2 trends (2005-2013): EPA Air Quality System (AQS) data versus improved observations from the Ozone Monitoring Instrument (OMI),” Atmospheric Environment, vol. 110, pp. 130-143, March 2015.
[25] S. Philip, R. Martin and et al., “Global Chemical Composition of Ambient Fine Particulate Matter for Exposure Assessment,” Environmental Science & Technology, vol. 48, pp. 13060-13068, 2014.
[26] A. van Donkelaar, R. Martin, M. Brauer, N. Hsu, R. Kahn, R. Levy, A. Lyapustin, A. Sayer and D. Winker, “Global estimates of fine particulate matter using a combined geophysical – statistical method with information from satellites, models, and monitors,” Environmental Sci. Technol., vol. 50, no. 7, pp. 3762-3772, March 2016.
[27] Washington University in St. Louis, “North American Regional Estimates (V4.NA.03),” Atmospheric Composition Analysis Group, 2022. [Online]. Available: https://sites.wustl.edu/acag/datasets/surface-pm2-5/. [Accessed 07 07 2022].
[28] Dalhousie University, “Surface PM2.5 Global Estimates (V4.GL.02 / V4.GL.02.NoGWR),” Atmospheric Composition Analysis Group, 08 03 2016. [Online]. Available: http://fizz.phys.dal.ca/ ~atmos/martin/?page_id=140. [Accessed 26 11 2018].
[29] Dalhousie University, “Google Earth Data Sets, Satellite-Derived PM2.5 at 35% RH, 1998 to 2015, All composition and Excluding Dust and Sea Salt,” Atmospheric Composition Analysis Group, 2019. [Online]. Available: http://fizz.phys.dal.ca/~atmos/martin/?page_id=140. [Accessed 09 07 2019].
[30] W. A. Chisholm, “Adapting Satellite Measurements of Air Pollution to Select Insulators,” in 2013 INMR World Congress, Vancouver, BC, September 2013.
[31] W. A. Chisholm, “Advances in Remote Measurements of Pollution for Insulator Selection,” in 2015 INMR World Congress, Munich, 18-21 October 2015..
[32] W. A. Chisholm, “Using Satellite Maps of Pollution Flux for Improved Insulator Selection & Operation,” in 2017 INMR World Congress, Barcelona-Sitges, 5-8 November 2017.
[33] W. A. Chisholm, Z. Li and A. Mogilevsky, “Calibration of Satellite Resources for Applications of EHV and UHV Polymer Insulators,” in 2016 CIGRE-IEC Colloquium on EHV and UHV, Montreal, QC, 9-11 May 2016.
[34] A. van Donkelaar, R. V. Martin, C. Li and R. T. Burnett, “Regional Estimates of Chemical Composition of Fine Particulate Matter Using a Combined Geoscience-Statistical Method with Information from Satellites, Models, and Monitors,” Environmental Science & Technology, vol. 53, pp. 2595-2611, 2019.
[35] Y. Duan, Z. Ma and Q. Yang, “Characteristics of consecutive dry days variation in China,” Theoretical and Applied Climatology, vol. 130, pp. 701-709, 2017.
[36] W. A. Chisholm, K. Ringler, C. Erven, M. Green, O. Melo, Y. Tam, O. Nigol, J. Kuffel, A. Boyer, I. Pavasars, F. Macedo, J. Sabiston and R. Caputo, “The Cold Fog Test,” IEEE Transactions on Power Delivery, vol. 11, no. 4, pp. 1874-1880, 1996 10.
[37] H. Yu, T. Li and P. Liu, “Influence of ENSO on Frequency of Wintertime Fog Days in Eastern China,” Climate Dynamics, vol. 52, pp. 5099-5113, 2019.
[38] D. Swatek, W. McDermid and J. Laninga, “Experience with Live-Line Insulator Maintenance in Freezing Conditions,” in 2013 INMR World Congress, Vancouver, BC, Canada, 2013 September.