High voltage porcelain insulators have been applied universally for the mechanical support and electrical insulation of overhead transmissions. In North America, some of insulators in the transmission networks have been in service for more than 60 years. As mechanical parts, the insulators support the weight of the conductor and its tension along with the mechanical loads due to wind, ice, and snow. As electrical insulation, the insulators have to withstand the normal system voltage under all possible weather conditions as well as transient overvoltage due to lighting and switching operations. While some of these aged insulators are still working satisfactorily, others have shown serious defects such as rust metal fittings, broken porcelain, and/or electrically punctured. When enough insulators in an insulator string become defective, the loss of insulation strength is too great to withstand the overvoltage of the system leading to flashover of the string. Separating the insulator string and dropping of the conductors is likely to occur if a power arc current of sufficient duration and magnitude penetrate the fractured insulators causing them to explode. It is, therefore, important to assess the conditions of the insulators in service regularly and to plan the insulator replacement accordingly.
Experience on in-service porcelain insulator condition assessment started in early 1980 when a separation failure of an insulator assembly occurred on a newly constructed 500 kV line. A line drop later in the same year intensified research on the electromechanical integrity of porcelain insulators. In the study, thousands of insulators were tested live-line to identify electrically defective units and still thousands of insulators were tested after they had been removed from the lines to assess their electrical and mechanical properties. The study led to the replacement of nearly 125,000 insulators on the 500-kV lines. Replacement was also carried out on some 230kV lines. Since that time, condition assessment of in-service porcelain insulators and replacement of defective insulator units have become a routine line maintenance practice.
This edited past contribution to INMR by staff at Kinectrics presented general practice for in-service porcelain
insulator assessment services.

Techniques of Assessing in-Service Porcelain Insulators
Condition assessment of in-service porcelain insulators consists of the live-line detection of the electrically defective insulator units in the insulator strings on transmission lines and the electromechanical integrity evaluation of the insulator samples removed from transmission lines.
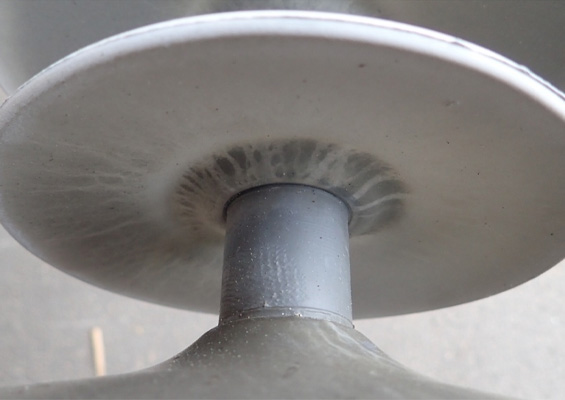
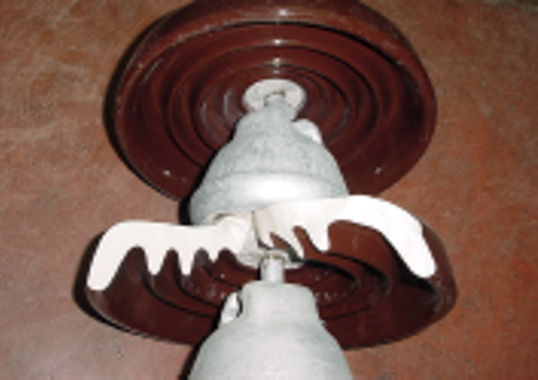
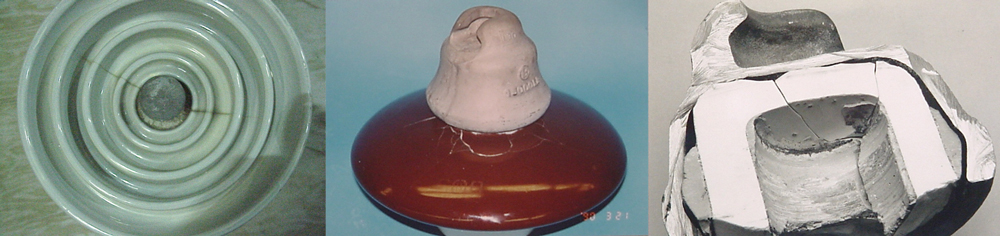
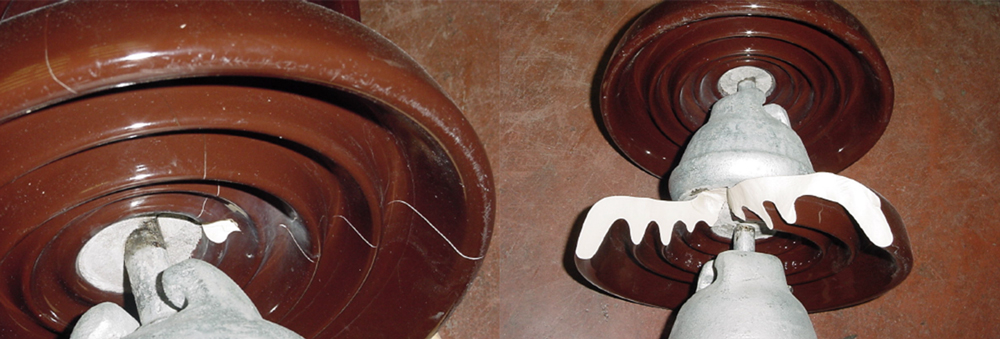
Circumference and radial cracks are most common defects that Kinectrics found in its insulator assessment experiences. These cracks sometimes are visible on the porcelain shell and sometimes are hidden under the cap as shown in Fig. 1. Old cracks on the shell have the appearance of dark lines. These dark lines were formed as the contaminant seeped into the cracks over a long period.
The deterioration of the bituminous layers that function as corrosion protection and high-pressure lubrication, cement growth, pin corrosion, lightning wearing and the propagation of small flaws across the porcelain cross section due to stress concentration by the flaws have been named to be some of the causes of porcelain fracture.
Visual means can be used to identify some of the defective insulators. Physical evidences such as broken skirts, chipped porcelain or flash damages indicate a defective unit. Other defective insulators could be identified only through testing.
Live-Line Test of in-Service Insulator Units and Defective insulator Replacement
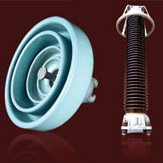
A buzz-stick could be used for detecting the electrically defective units in an insulator string on a transmission line. The buzz method is based on the principle that a noise is produced when two metallic parts with different potential are short-circuited. Procedures have to be in placed, however, to prevent short-circuiting an insulator in a string that already has insufficient insulation due to the presence of defective units. Some utilities, however, prefer insulator testers such as the one shown in Fig. 2 for live-line detections.
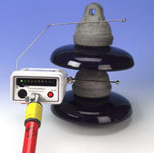
The insulator tester shown in the figure is a portable instrument that applies a current limited (maximum 50µA), 10 kVDC potential across an insulator through two probes. The insulation strength between the tester’s two probes is 60 kV (rms). Hence, the tester does not constitute a short circuit as a buzz stick does. However, since the tester is built based on the principle of measuring the DC leakage current between the cap and pin of the insulator under test, its success relies heavily on the insulator’s surface conditions. Moisture and surface contamination could lead to fault indication.
As with any other live-line works safety of the line maintenance crew is the most important issue of live-line insulator assessment and replacement. Lightning induced flashover is normally not a concern since live-line work is prohibited during a stormy day. Switching initiated flashover, on the other hand, could happen as the results of the overvoltage generated by switching operations or faults within the transmission network.
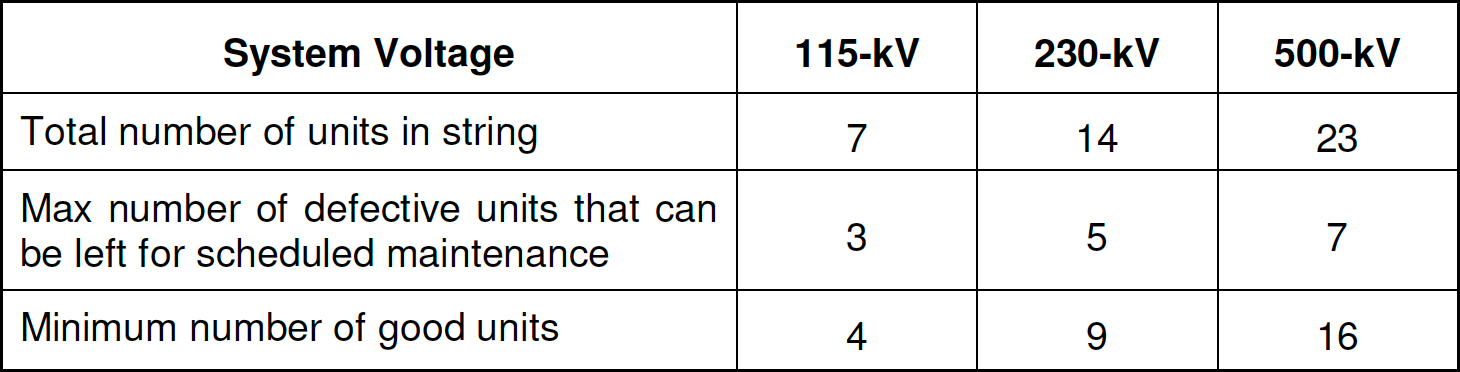
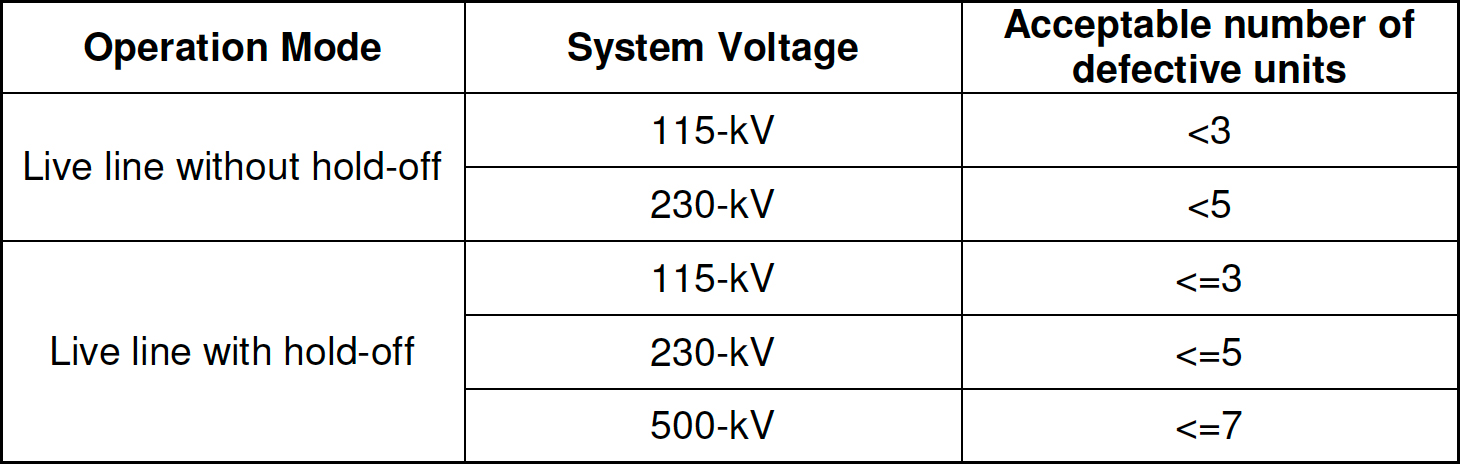
Kinectrics studied the insulation strength of transmission line insulation at the presence of live-line tools and operating crews under switching impulses using real size transmission line models in early 1976. Different types live-line work methods proposed at that time were tested. The study was carried out with a single switching impulse waveform. In late 1977, Kinectrics initiated another test program to study the insulation strength of transmission line insulation at the presence of live-line tools, operating crews, as well as defective insulator units in the insulation system [6]. A number of switching waveforms were used in the 1977’s study. Kinectrics launched three more test programs from 1979 to 1984 to bring in new work methods and fall protection systems [7,8,9,10]. All these works led to the technical directive given in the following two tables that define the priority of defective insulator replacements and mode of operation during defective insulator detections and replacements.
During the live-line detection, each insulator of the string is detected sequentially from the line end of the string. Terminate the detection for safety reasons if the acceptable number of defective units listed in Table 1 is reached before all the insulators are tested. In such a case, the insulator string is said to have reached its end of life and should be replaced as soon as possible by scheduled-outage because using live-line work methods is no longer safe. In other situation, the defective insulators are replaced by scheduled maintenance within 6-month period by either live-line or scheduled-outage.
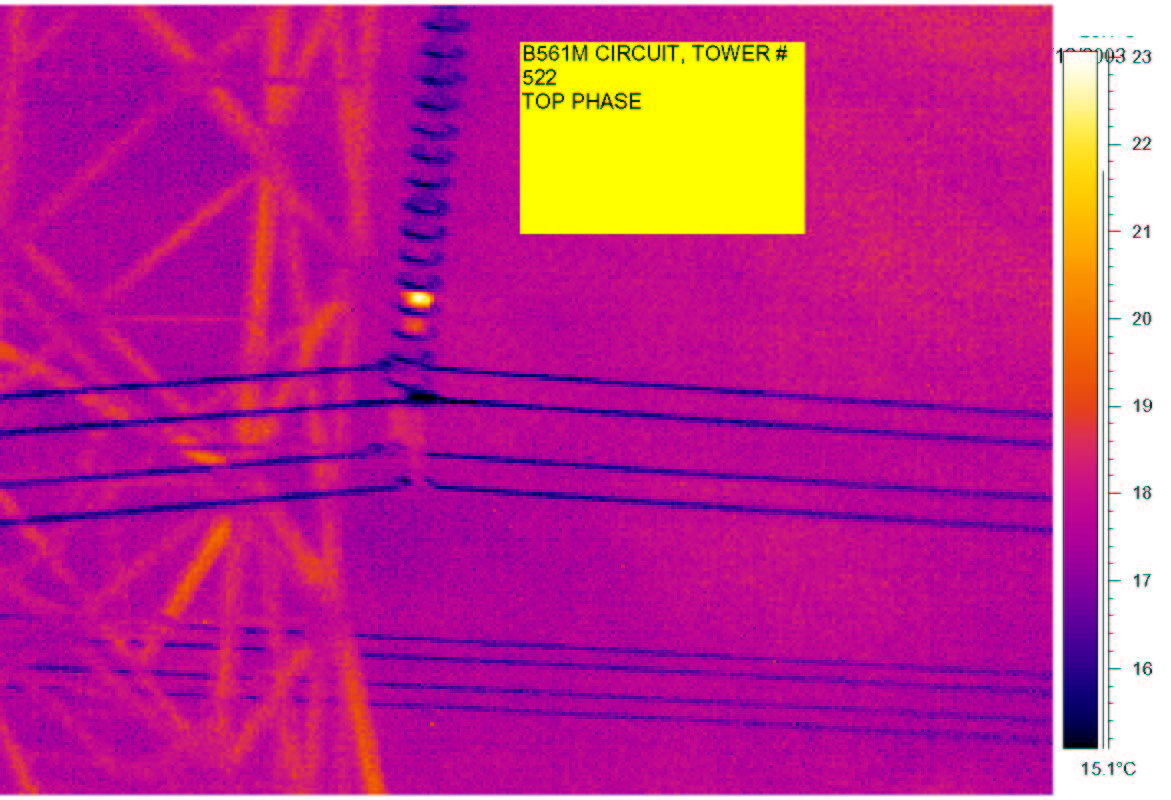
The defective insulator units sometimes exhibit abnormal temperature especially when several defective units cluster on the live end of an insulator string. This temperature abnormality provides the bases of using an IR camera to identify these defective insulator units. The IR Camera is usually mounted on a helicopter for access to the transmission towers. If the IR survey records a few anomalies there will be a follow up by a crew to test the rest of the insulator of the string with an insulator tester. A string will be replaced immediately without a follow up by a crew if the IR survey detects that the defective insulator units in the string has exceeded the maximum number given in Table 1.
Fig. 3 shows a thermograph of a suspension string on a 500-kV transmission tower. The string was later removed and tested. It was found that this string had eight (8) defective units.
Experience has shown that IR thermograph is an effective way to direct the line crew to the literary “hot spots” of the transmission lines with defective insulators.
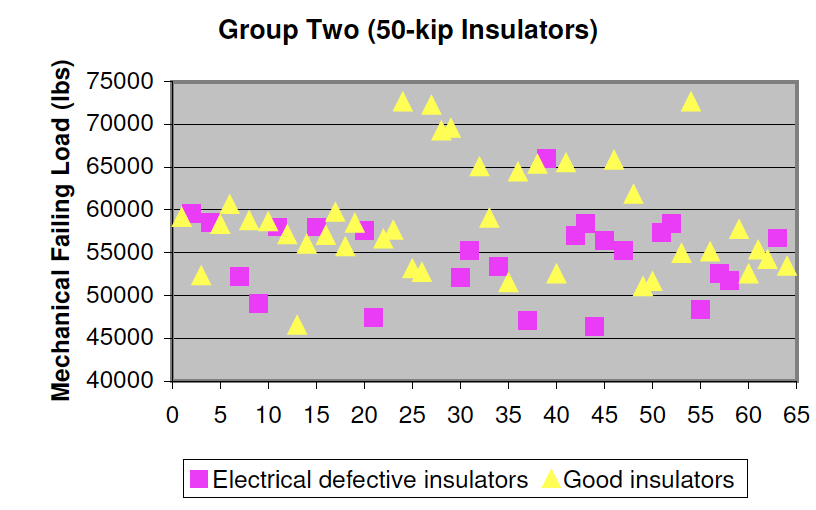
The immediate benefit of replacing the defective insulator units in an insulator string is the restoration of its insulation strength and to some extent its mechanical strength since the defective insulators are more likely to have lower mechanical strength as shown in Figs. 6 and 7. It should be pointed out that the insulator having the lowest mechanical strength in an insulator sample is not necessarily defective.
The live-line detection provides the rate of the defective insulators within a line section. Such information may allow us to estimate the electrical strength of the insulation of the line section. Once the electrical strength is known, the performance of the line section could be evaluated. Decision, such as whether the insulators in the whole section should be replaced, could be made based on the outcomes of the evaluation.

Electromechanical Integrity Evaluations of Insulator Samples
A number of tests are designed to evaluate the electromechanical integrity of the insulator samples removed from a transmission line section. These tests include:
· Megger and three AC dry flashover tests
· Combined mechanical and electrical strength tests
· Steep front-of-wave tests
· Contamination tests
· Porosity tests
· Thermo-mechanical performance test

Megger & Three AC Dry Flashover Tests
The Megger and Three AC Dry Flashover Tests are to reveal the electrical integrity of the samples. Insulators may become punctured in service due to localised electrical stress at flaws in the porcelain. This can also happen in the field from lightning strikes or overvoltage on the system. Resistance test using a 10-kV meg-ohm-meter (‘megger’), reveal either gross crack problems or contamination.
The megger test is designed to replicate the tests on insulators in the field using the insulator tester. A reading of over 10,000 MΩ indicates that no puncture was detected by this method.
The AC dry flashover test sometimes reveals crack problems that the megger and the insulator tester cannot find. When doing the AC flashover tests, dry samples are mounted individually in their normal orientation with a grounded cap. A high voltage supply with adequate short-circuit current is connected to the insulator pin. The voltage is increased until flashover occurs, and the maximum ac voltage is recorded. The process is then repeated, and a second flashover value is noted. In cases when there is a large difference between the first and second flashover value, or when the first flashover value is significantly below the typical 70-80 kV value for the discs, the unit is labelled as ‘Punctured’. A third flashover test then follows to confirm the Punctured/ Good status of the insulator under test.
Research carried by Kinectrics has shown that overall, the rate of detecting faulty insulators, using a resistance measurement at 10 kV which is what the insulator tester does, is roughly 80% to 90% of the true defect rate. This fact should be included in the decision of insulator replacement.
Combined Mechanical & Electrical Strength Tests
In North America, the electromechanical integrity of new insulators is guarantied through the combined mechanical and electrical strength tests of sample insulators as specified in ANSI C29.2. Canadian National Standard C411.1 for porcelain and glass insulators imposes more stringent evaluation conditions. The electromechanical strength of new insulators usually follows a normal distribution. Electrical breakdown usually accompanies mechanical separation during such testing, with less than a 1% exception.
The distribution of electromechanical strengths of an insulator population has normally been considered as to be time invariant for a period of up to several decades until hardware deterioration becomes a dominant factor. However, electromechanical tests on insulators removed from transmission lines as well as unused and outdoor-stored insulators showed a statistical loss of electromechanical strength with time.
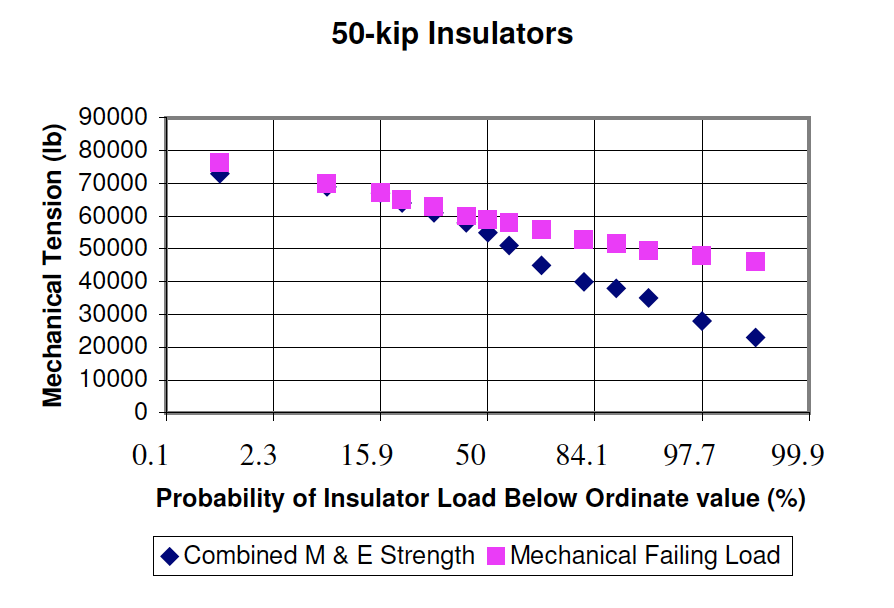
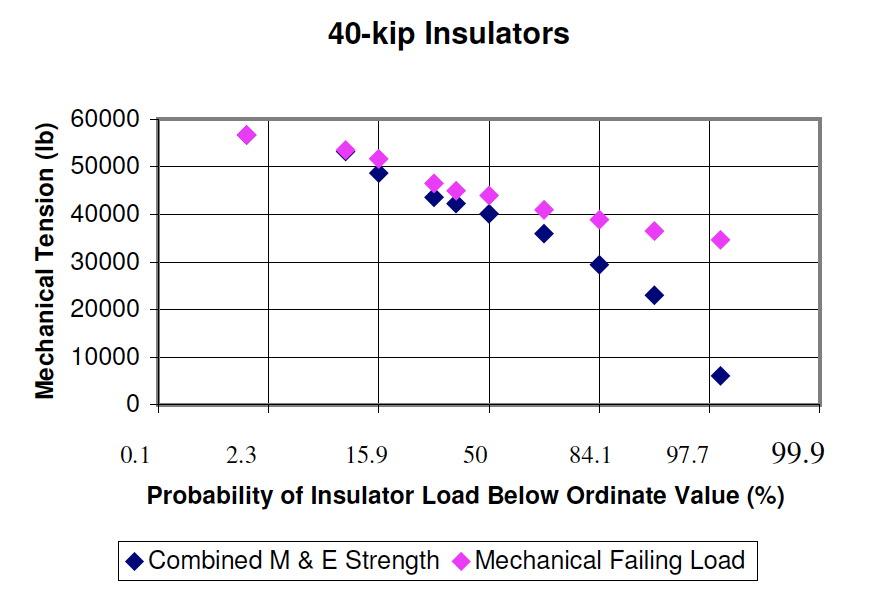
The data generated through testing insulators by Kinectrics over the years indicated that in most case, electromechanical loads of an insulator sample removed from a line section in service separate into two distributions. One distribution corresponds to mechanical strength where failure was due to physical separation, and the other distribution corresponds to the combined mechanical and electrical strength, where mechanical stress results in the electrical failure of the insulator due to porcelain fracture. The probability of the mechanical failing load of the insulator sample, when plotted on normal probability paper, forms closely to a straight line indicating that the mechanical failing load is still normally distributed. However, the plot of the electrical strengths of the insulator sample forms two line sections. The intercept of these two line sections denotes the beginning of the departure of the electrical strength from the mechanical strengths. From this point on, the sample’s electromechanical strength becomes lower than its mechanical strength. The test results suggest that the puncture insulator units increase as the load on the insulators increases. A large percentage (70% – 90%) of the tested insulators showed electrical failure prior to mechanical failure. Figs. 7 and 8 shown the test results of two insulator sample groups.
Defective insulators pose great danger to the normal operation of the transmission lines regardless the number of defective insulator units in a string. There was a separation incident involved three defective insulator units in a row and another separation incident involved only one defective insulator. Therefore, the defective insulator should be removed from the lines as soon as possible. Live-line detection and replacement appears to be the only way to fulfil this difficult task.

Steep Front-of-Wave Tests
Lightning strikes on tower top generate steep front-of-wave impulses across the insulator strings on the tower. This steep front-of-wave can lead to punctures that gradually worsen with repeated lightning strikes. Kinectrics proposed to introduce the steep front-of-wave test to Ontario Hydro’s purchasing specifications in 1982. Canadian National Standard requires a minimum resistance to puncture using ten steep-front flashover tests under each polarity with rates of voltage change in excess of 2500 kV/µs. For insulators commonly used, this steepness requires the application of steep front of waves having a peak value over 300 kV, approximately twice of the peak value of the required AC puncture voltage strength.
Steep-front-of-wave test has been proven an effect tool to evaluate the electrical and mechanical integrity of new insulator designs. New insulators fail steep-front-of-wave test often due to weak porcelain. Standard lightning impulses sometimes could also render insulators of poor porcelain to fail as shown in Fig. 8.
It was suspect that lightning punctures occur more often in aged insulators with flawed metal or porcelain although the cause and effect relationship is not clearly defined. Conversely, lightning wearing may hasten the mechanical deterioration of insulators once initiated. Therefore, the steep-front puncture rate of older insulators is an important diagnostic tool in insulator condition assessment.
Contamination Tests
Measurements of equivalent salt deposit density (ESDD) are normally done on insulators removed from the lines. The contamination test is sometimes used in insulator failure investigations to identify whether contamination contributed to a failure under investigated. The contamination test is also used to identify whether contamination poses a problem in a suspected line section.
Porosity Tests
Porosity tests were normally performed on porcelain fragment samples that were usually taken from the part of porcelain shell under the cap or a suspected area. The test was used to determine if the porcelain was properly cured. For cap and pin insulator discs porous porcelain was rare.
Thermo-Mechanical Performance Test
Kinectrics performed the thermomechanical performance tests in accordance with ANSI C29.2, CSA C411.1 or IEC 383-1 depending on the agreements with its clients. Thermomechanical performance of aged insulators is also a subject of study by a 9 CIGRE Working Group. Kinectrics’ test data show that although the thermomechanical performance test has been very effectively used to evaluate the soundness of a new insulator design, it is not very effective in assessment of the electrical strength of aged insulators.
There were extreme examples of thermo-mechanical performance test. In one extreme, none of the insulators tested failed electrically while in other extreme, all insulators tested failed electrically after four temperature cycles. Both samples were under a load of 60% of their combined mechanical and electrical strength rating. The insulator units of both samples, however, were taken from transmission lines that exhibited satisfactory performances.

Insulator Change Criteria
Live-line detections enable us to replace the defective insulator units or strings on the lines to improve its reliability. However, there will be a point in the time that insulator replacement by units or strings will either not be able to maintain the reliability of the line or not be economically justifiable. At this point, all the insulators in the line section should be replaced. We terms this as End-Of-Life (EOL) of the insulators on a line section.
EOL of the insulators on a line section is reached if a decision is made to replace all insulators in the line section. A decision of this nature is generally based on one or more of the criteria listed below:
(1) The mechanical strength of the insulators is deemed to be below a specified design load such as that can be expected under heavy icing conditions in Canada.
(2) The number of defective strings that need to be replaced under scheduled outage conditions is greater than a predetermined tolerable number.
(3) The trip-out rate due to flashover of defective strings exceeds a predetermined level.
The closely norm distribution of the mechanical strength of the aged insulators allow us to predict the mechanical strength of the insulators in a line section. When a norm distribution of the mechanical strength of the aged insulators is assumed, the mean of the mechanical strength X of an insulator sample of n insulator units is near the mean m of the insulator population, from which the sample was taken, with 99.73% of confidence level given by the following expressions
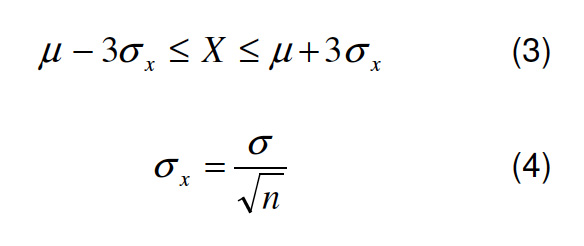 The notation δ in Equation 4 is the population standard deviation. It clearly shows that larger sample size results narrower range.
For example, if an insulator population has a mean value μ of 50,000 lbs, and a standard deviation of 6,000 lbs, Then the mean of the mechanical strength X of any 10 insulator units taken from this population is very likely within a wide range of 44308 ≤ X ≤ 55692 . If the sample size is increased to 200, the range becomes 48727 ≤ X ≤ 51273 .
The sampling distribution of the random variable, nS2/σ2 , related to the sample standard deviation S, the sample size n, and the population standard deviation σ is a chi-square (X2) distribution with n -1 degrees of freedom. This gives a measure of the deviation of S from the population standard deviation σ . For example, if the sample size is 10 then the chance of S≥σ is roughly 40%.
It would be very easy to decide whether the aged insulators in a whole line section should be replaced based on their mechanical strengths if the mean μ and the standard deviation σ of the aged insulator population in the section are known. The insulators should be replaced based on mechanical strength if
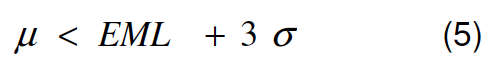 EML is the expected maximum load of the line section.
In reality, however, only the mean X and the standard deviation S of a sample from the line could be obtained through testing and, as shown earlier, sample size affects both X and S profoundly. For combined mechanical and electrical strength test, in balancing the cost of testing and the reliability of information drawn from testing, Kinectrics normally suggests a sample size of 200. With this suggested sample size, there will be 95% confidence that S≥0.9165 σ or X2 = n2/σ ≥168. There is almost impossible that S ≤ 0.8487s. The replacement criterion defined in Equation (5) in terms of X and S then becomes
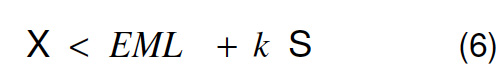 Higher confidence level requires higher k values. Values of k are given in the following table. If k is chosen to be 3.5, then there will be about 5% of chance of leaving the insulators unchanged even if the population meets the replacing criterion set in Equation (5).
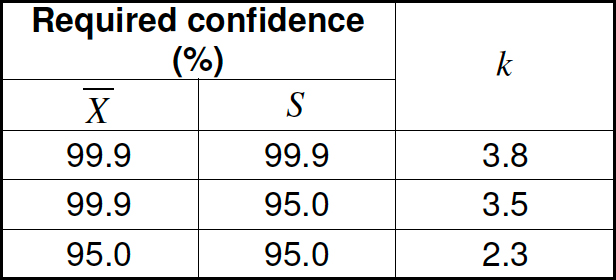
The expected maximum load in the inequality equations is a matter of choice of each individual utility after reviewing all possible loads imposed on its transmission network.
The application of the insulator changeout criteria (2) and (3) requires the knowledge of the insulation status of the line in question. It is easy to obtain this knowledge if the insulator population in a line section is homogeneous. Under this condition, the probability of having x defective units in n insulators picked randomly from the line section will be determined by Equation 1.
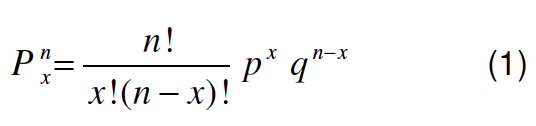
In the probability function p is the defective rate and q = 1 – p is the rate of sound insulator units within the population. We introduce the notation Pxn for the probability function for convenience.
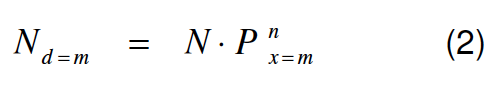
If we have a line section of N insulator strings and each string has n insulator units, then it is likely to have d m Nd=m strings in the line section with m defective units:
 It could be shown that if a line section has 100 insulator strings, each string contains 14 insulator units, then the odds of finding 11 a string having five or more defective units is very slim if a defective rate of 5 % is assumed. If, however, the defective rate is raised to 10%, then the likelihood of finding one string that has five or more defective insulators in that section is very high.
There are two defective rates that require consideration, the defective rate under normal mechanical load conditions and the defective rate under mechanical overload conditions. It should be pointed out that this mechanical overload corresponds to the overload condition under which the line is expected to carry out its duty of transmitting power.

The defective rate obtained through liveline detection could be considered as the defective rate under normal loading conditions.
The electrical strength as a function of mechanical tension obtained through the combined mechanical and electrical strength test, however, could not be used as the defective rate under overload conditions. This is because the time-load test data Kinectrics collected through testing on old insulators indicate that the puncture units of a line insulator population increase not only with its loading but the duration of the applied load as well. For a given overload condition, the actual defective rate of the insulators on the line could be several times greater than that obtained from the combined mechanical and electrical strength tests.
Evaluation of the potentially punctured insulator units in a line section, therefore, requires the knowledge of the time-load characteristics of the insulator population. Time-load test is crucial to obtain this knowledge. The time-load test should reflect the insulators’ working condition and load duration (a cumulated time over 10 years of service). Detection of the electrical soundness of the insulators under time-load test should be carried out to obtain the punctured rate of the insulators as a function of the amplitude and the duration of the applied load. The insulators should be tested for electromechanical strength and ultimate mechanical failing load at the end of the time-load test.
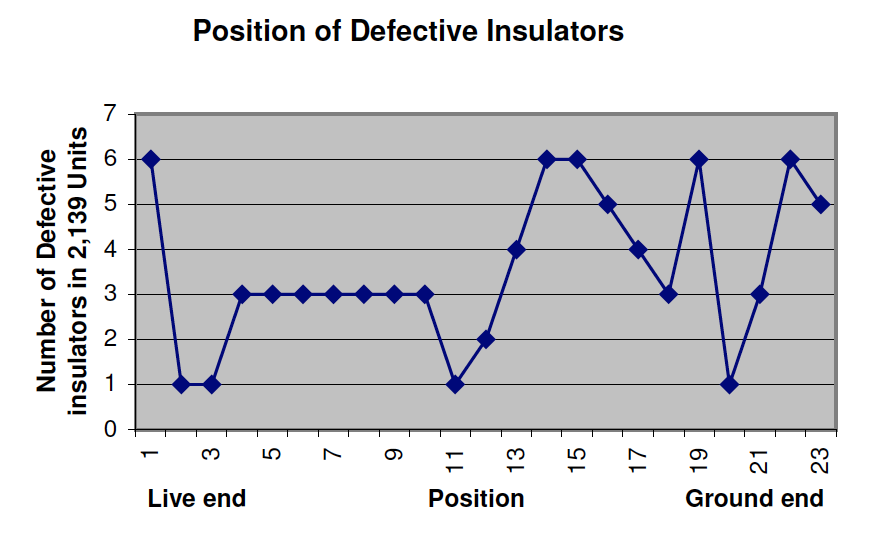
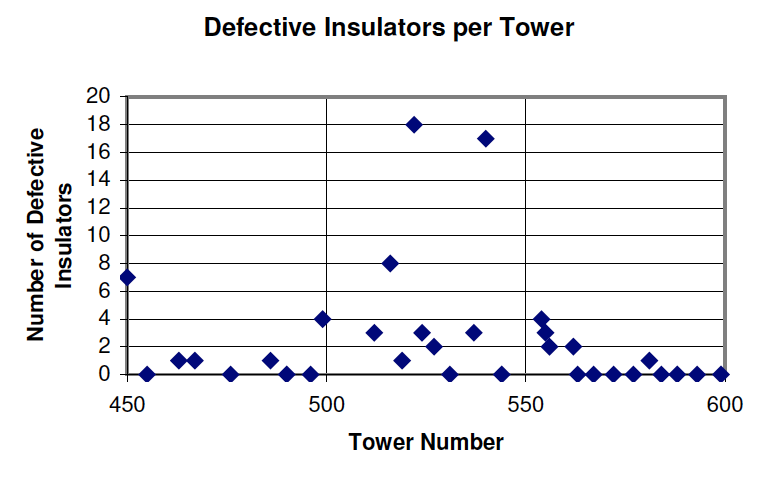
Table 2 gives the results of a survey of 31 towers, 93 suspension strings, a total of 2139 insulator units on a 500-kV line section. This section used insulators manufactured in late 1970s and was put into service in mid 1980. The survey found 30 defective strings among the 93 strings. The defective rate of the sample insulators was 3.7%. This value gives an average annually defective rate of 0.015% over 25 years period. The table also gives the calculated values of defective strings using Equation (2). The calculated values suggest that this line section is inhomogeneous. The non-uniformities are clearly shown in the plots in Figs. 9 and 10.
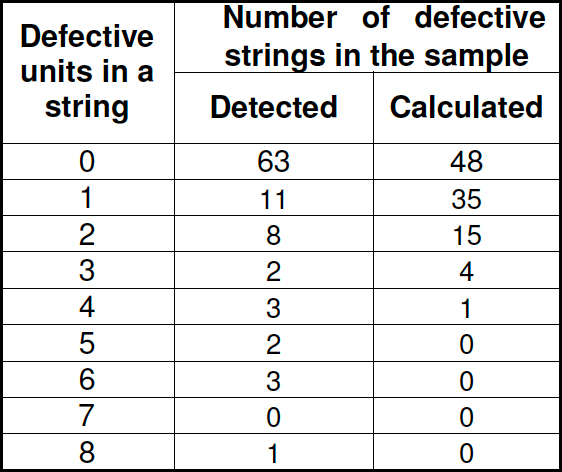
The electrical performance of an inhomogeneous line section is more difficult to predict. Inhomogeneity may initially due to batch effects. It could also be due to the electrical-stress-dependent aging of the porcelain dielectric [1]. The electrical-stress-dependent aging of the 12 remaining healthy insulators on a defective string accelerates because they are under higher stress due to the presence of the defective units. This appears to be in consistent with the observation of cascading defective units in a string. For these reasons, it might be more reliable to proportionate the defective strings obtained through liveline detection to the strings in the whole line section instead of evaluating Equation (2) using the defective rate.
Conclusions
1. Defective insulators pose great danger to the normal operation of the transmission lines regardless the number of defective insulator units in a string. They should be detected and removed from the lines as soon as possible. Live-line detection and replacement appears to be the only way to fulfil this task.
2. The mechanical failing load of the aged insulators removed from transmission lines is normally distributed. The values of the mean and standard deviation obtained from testing a sample of 200 units randomly removed from a line section could be used to decide the insulator replacement of the line section.
3. Steep-front puncture rate of older insulators is an important diagnostic tool in insulator condition assessment.
4. Porous porcelain is rare in cap and pin insulator discs.
5. Time-load test is crucial to obtain the rate of the potentially punctured insulator units in a line section. This value together with the defective rate obtained through live-line detection are the bases for the evaluation of the electrical performances of the line section under mechanical overload condition.
References
(1) J.S.T. Looms, Insulators for High Voltages, (London: Peter Peregrinus), 1988.
(2) E.A. Cherney, ‘Cement Growth Failure of Porcelain Suspension Insulators’, IEEE Trans. on Power Apparatus and Systems, Vol. PAS-102, No. 8, August 1983, pp. 2765-2774.
(3) E.A. Cherney and R.D. Hooton, “Cement Growth Failure Mechanism in Porcelain Suspension Insulators”, IEEE Trans. on Power Delivery, Vol. PWRD-2, No.1, January 1987, pp 249-255.
(4) Cherney “Electromechanical Integrity of Suspension Insulator”, Research Review (Ontario Hydro) Number 5, July 1982
(5) Reichman “Switching Surge Performance of 230-and 500-kV Live Line Tool Configurations”, OHRD Report 77- 226-K.
(6) Reichman “Effect of Punctured Insulators on Switching Surge Performance of 230-and 500-kV Live Line Tool Configurations”, OHRD Report 77- 534-H
(7) Reichman “Live Line Safety Requirements for Insulator Changeout”, OHRD Report 79-12-H
(8) Reichman “Sate Aspects of Live-Line Work Methods”, IEEE Transaction on Power Apparatus and Systems, Vol. PAS- 100, July 1981 pp3478-3485
(9) Reichman “Switching Surge Performance –New Live Line Tool Configurations”, OHRD Report 82-264-K.
(10) Reichman “Modified Live-Line Work Procedure Effect of Live Line Rope”, OHRD Report 84-356-K
(11) Staub “CIGRE WG B2-03 Research Findings into the Condition of Old Insulators Taken from Service: an Intermediate Report” Proceedings World Conference & Exhibition on Insulators, Arresters & Bushings, November 2003.