Often, overhead groundwires (OHGW) are among the first components to fail on overhead transmission lines. OHGW end-of-life assessment often triggers a mid-life renovation project to ensure many more years of reliable service from an overhead line in a desirable right-of-way.
This edited past contribution to INMR by Dr. William Chisholm, in co-operation with Kinectrics, proposed a process to review and quantify the performance of OHGW systems to rank possible renovation options. In some cases, these should consider replacing OHGW protection with other components, including optical fiber ground wire (OPGW) installed below the phases. With suitable arresters, this underbuilt OPGW can be energized at modest voltage to support future monitoring of infrastructure.
Lightning Performance Measures & Goals
Lightning Tripout Rates, Outages per 100 km per Year
Overhead transmission line design guides weave aspects of lightning protection through¬out their pages. Each also devotes a specific chapter to the prevention of shielding failures (where lightning terminates directly on an energized, insulated phase) and mitigation of backflashovers (where lightning terminates on an earthed component, but the resulting voltage rise exceeds the lightning impulse insulation strength). These guides rely in turn on specialized IEEE Standards and CIGRE references for the series of calculations made to establish the “shielding failure rate” (SFR) and “backflashover rate” (BFR) that are added to establish the total lightning outage rate, expressed in units of outages per 100 km of line length per year. While the ground flash density (Ng, in flashes per km2 per yr) varies considerably, by a factor of 100:1 in North America, utilities tend to adapt their new overhead line designs to deliver about the same outage rate. One historical security classification includes:
- Class “C”, < 4 lightning outages per 100 km per year
- Class “B”, < 1 lightning outage per 100 km per year
- Class “A”, < 0.5 lightning outages per 100 km per year
Class “A” security is the recommended design target for ultra-high voltage (UHV) lines [9] at system voltage 1000 kV AC.
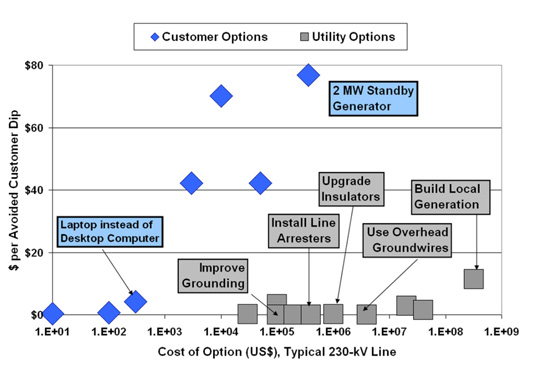
Cost per Avoided Customer Momentary Dip, USD $/CMD
A simple cost/benefit analysis was carried out to capture the main costs of overhead groundwire protection for 100-km line sections, ranging from 230 kV single circuit to 765 kV double circuit steel lattice construction Applying inflation of 54% from 2003 to 2023, the costs of overhead groundwire lightning protection include:
-
-
- Increased capital cost of line:
a. Twin OHGW, 3/8” 7/1 EHS Galvanized Steel Guy Wire, USD $700k for 2×100 km
b. Taller and stronger structures, 600-1000 kg each, 250 m spans, $3.7 M per 100 km - Capital cost of generation to meet peak loss, valued at USD $2/W:
a. For low-reactance phasing of double circuit lines (ABC/CBA), < 1 MW/100 km
b. For single circuit lines, 1 to 7 MW/100 km
c. For superbundle (ABC/ABC) phasing of double circuit lines, 0.2 to 26 MW/100 km - Present Value cost of I2R losses from currents induced in OHGW, valued at USD $0.23/kWh:
a. Continuous loss about 9x less than peak loss as running current typically 1/3 of peak
b. 3% interest rate over 50 years, $15 M per 100 km for a 345 kV double circuit line
- Increased capital cost of line:
-
The “benefits” of OHGW protection were estimated using the number of customers affected by a momentary lightning outage, which is derived from the power transfer capability. The utility investment to avoid a customer momentary dip (CMD) in an area of modest Ng = 1 flash/(km2-yr), varies from about USD $0.015 to $0.21. Double circuit superbundle configurations incur higher losses, with a resulting cost about of $0.12/CMD. Low-reactance phasing of double circuit lines is preferred from this aspect because OHGW investment is only $0.02 per avoided dip.
The amount that a utility now spends to avoid customer momentary dips defines the value of additional investments in lightning protection. In many cases the business case for additional improvement is weak because the OHGW protection has proved to be highly efficient.

Lightning Performance, HV Lines of 1940s & 1950s
The median span length with wood H-frame structures in Fig. 1 was 183 m, compared to 252 m for the steel lattice structures. In 1955, the electric utility industry relied on meteorological station measurements of “Thunder Days” to normalize performance against local lightning activity. With the data provided, it is possible to estimate a “critical current” Icrit for backflashover (kA) from the provided values of lightning impulse strength (kV), average footing resistance (Ω) and a factor accounting for parallel overhead groundwires on shielded lines. Fig. 2 shows a rough downward trend in normalized outage rate as Icrit increases.
![]()
When the critical current Icrit > 200 kA, it is often considered to be “lightning proof”. Fig. 2 shows good performance – less than 0.1 outages per 100 miles per yr per thunder day – for all but one line with Icrit > 200 kA. In a typical region with TD = 40 days/yr, equivalent to Ng = 4 flashes/km2/yr, a performance of 4 outages / 100 mi / yr (2.5 outages / 100 km / yr) meets “Class C” security.
Lightning Performance of Modern HV Lines
The North American Electric Reliability Corporation (NERC) still mentions lightning as a “hard-to-predict” challenge in its 2023 State of Reliability Overview. Lightning outages rank sixth behind Weather, Failed AC Circuit Equipment, Unknown, Vegetation and Failed AC Substation Equipment when considering the power (MVA) capacity affected by automatic transmission outages. Lightning outages would be expected in the summer season (June to October) in Fig. 3 but thunderstorms on March 22, May 21 and December 30, 2022 were the events classified as extreme.
Fig. 3 suggests that the consequences of lightning outages were well managed in 2022, through a suite of countermeasures that includes direct stroke protection, efficient fault detection and reclosing, and highly meshed networks that are resilient to the loss of any individual element. This is also reflected in the 2022 NERC Transmission Availability System Data. Considering systems rated above 200 kV, lightning contributed 649 momentary outages (23%), second only to “unknown” at 940 (33%). By contrast, sustained outages from lightning contributed only 0.38% to the total duration of sustained outages.

Shielding & Backflashover Performance of EHV/UHV Lines
As illustrated with the lightning performance data from 1955, backflashover analysis computes “critical current” Icrit , the impressed current at each tower that causes the voltage on one of the line insulators to slightly exceed its lightning impulse strength. When the return stroke exceeds Icrit , there is a line-to-ground fault that is sustained by the power system until the fault is detected and cleared.
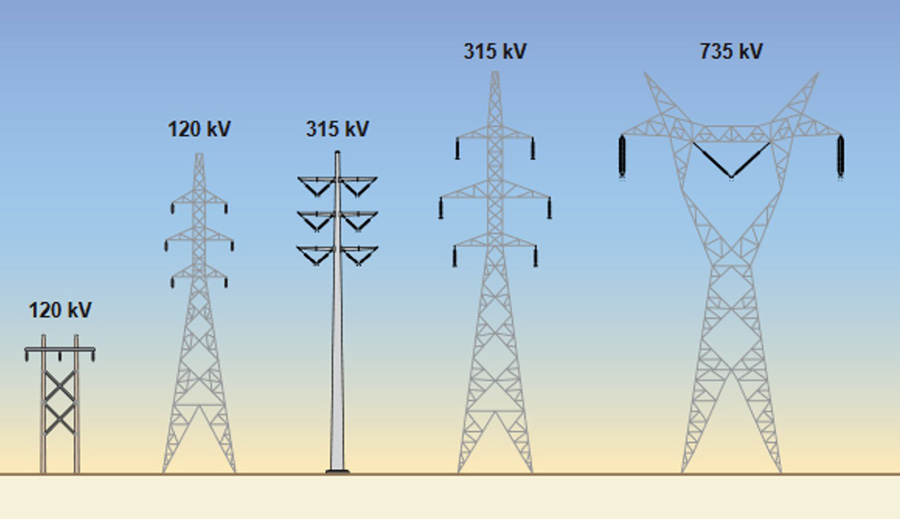
The backflashover rate of EHV and UHV lines is expected to be rather low because each structure has a large value of Icrit. The typical structures in Fig. 4 are large, with a typical effective perimeter P > 50 m of foundations in the soil. For each tower, the local soil resistivity ρ (Ωm) is divided by P to obtain the earthing resistance Rf = ρ/P. The preliminary estimate of Icrit is given by dividing the insulator critical flashover voltage (CFO, kV) by Rf measured at the base of the stricken tower. The backflashover outage rate is given by the probability that Icrit is exceeded, multiplied by the number of flashes to the line per 100 km per yr.
Recent experience suggests that high phase-conductor voltage bias and large separations among conductors in the EHV and UHV systems of Fig. 4 result in a high fraction of shielding failures.
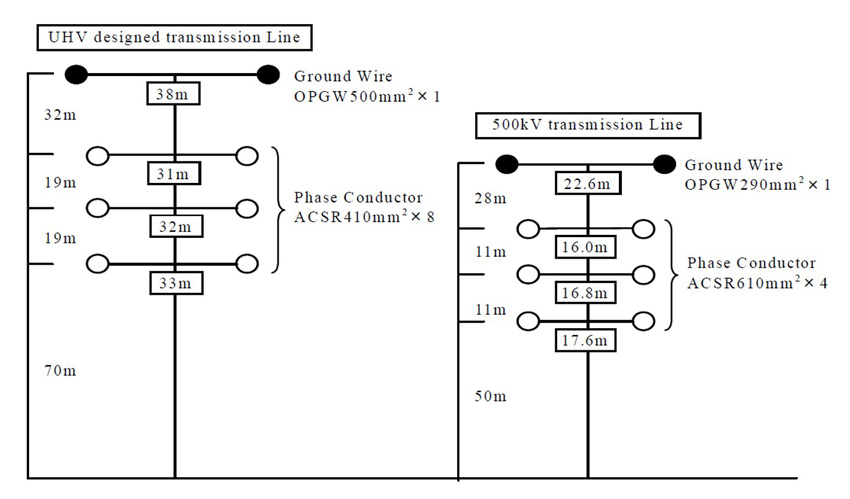
The field performance of the 500 kV shielding system in Fig. 4 was good, with 99% of the lightning flashes causing no outage, 0.4% finding their way to a phase conductor and causing a shielding failure flashover, and 0.6% causing a back-flashover. This performance was established in a region with Ng = 5 flashes/ km2/yr, leading to 131 flashes to the line per 100 km-yr and an outage rate of 1.28 per 100 km per yr. While good, this outage rate does not meet the Class “B” security criterion listed above.
The backflashover performance of the UHV design in Fig. 4 was observed to be 8 times lower than that found for the 500 kV design, because the dry arc distance is higher (5.9 m versus 3.3 m) for the UHV design. Since the UHV design is taller (140 m versus 100 m), it attracted 33% more lightning (1859 versus 1394 flashes). Since the separation among conductors of the UHV design is larger than the 500 kV design, its shielding failure rate was slightly higher. Overall, the UHV design delivered 0.71 outages per 100 km per yr, missing the Class “A” security criterion.
Rebuilding / Refurbishing Project Objectives
Improve Overall Reliability
The wind and ice loading recorded in the Canadian province of Newfoundland are exceptional. Meteorological loading conditions in the 1960s and 1970s considered ice thicknesses of between 0.5 to 1.5 inches (12.7 to 38.1 mm) of radial ice for the ice load sag curve, used to establish safe clearances to ground. Operating experience revealed larger ice load conditions for 230 kV transmission lines on the Avalon Peninsula. The rebuilding of steel tower 230 kV transmission lines on the Avalon Peninsula between 1999 and 2002 utilized a larger radial ice thickness, which, in turn, became the ruling ground clearance sag curve for these transmission lines. Calculations utilizing the sag – tension programs revealed that the equivalent “hot” conductor 18 sag curve for the rebuilt transmission lines limited the maximum conductor temperature to 80°C.
This utility has undertaken a series of rebuilding projects to improve reliability, with the following specifics:
• 1984: Ice storm failures in 22 km zone with 51 mm icing design. Upgraded to high strength 563 kcmil ACSR phase conductor; retain unshielded configuration.
• 1993-1996: Replace porcelain insulators with cement growth problems.
• 2001: Add lightning arresters to every insulator on one (of two parallel) 230-kV line.
• 2002: Following 1994 ice storm, rebuild 230 kV line for 76.2 mm ice load.
• 2003: Increase thermal rating of 230-kV line.
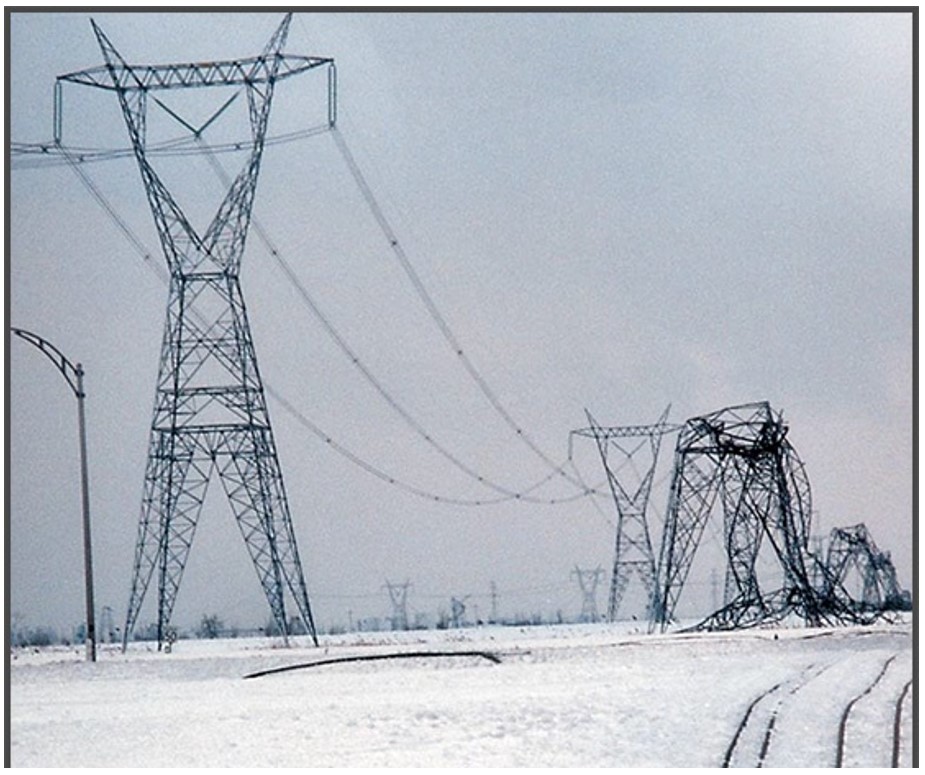
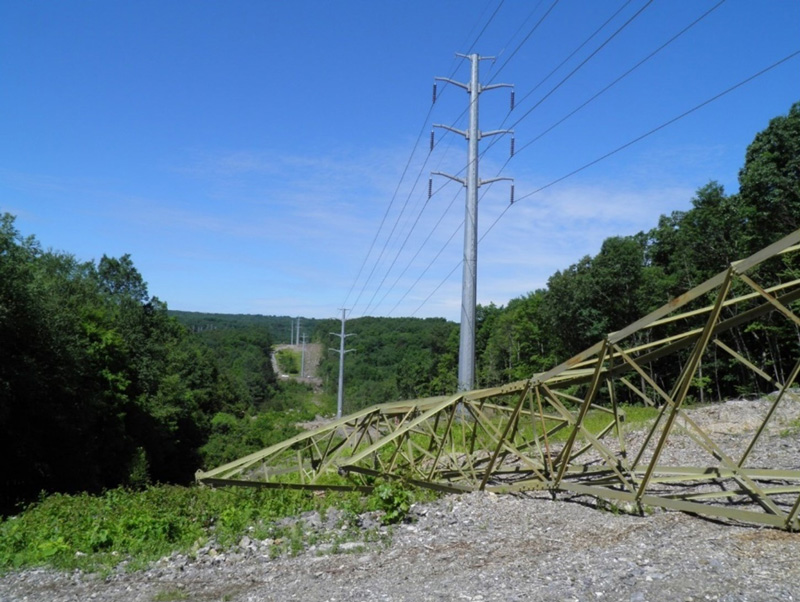
INMR has documented the response of Ontario and Quebec utilities to the devastating ice storm of 1998. This series of three sequential icing events, with no melting periods between, led to overall accretion as high as 80 mm, compared to design levels of 2” (50.8 mm) of glaze ice with density 0.9 g/cm3. The first 735 kV lines in the Manic – Québec corridor were commissioned between 1965 and 1973. Fig. 5 shows how a 735 kV line built after 1973, at left, survived the ice storm while a similar adjacent line built earlier exhibited a cascade failure of many towers.
The vertical capacity of the newer towers on the left in Fig. 5 was probably less than for the older collapsed towers, based on design optimization. However, improved balancing of loads among components, combined with the use of anti-cascading structures, succeeded in keeping the newer line intact during the ice accretion and shedding processes.
After loss of OHGW from ice storms, at least two different utilities have considered leaving them off, and providing the unshielded phase conductors with transmission line surge arresters (TLSA) instead. This approach was implemented by Transelectrica, the Romanian transmission system operator as described in INMR.
Improve Lightning Performance
In a CEATI “Best Practice” design Guide, a matrix of ground flash density Ng crossed with soil resistivity ρ (Ωm) was used to classify the best practices for lightning protection. As an example, a region with low lightning activity (Ng < 0.5 flashes per km2 per yr) and high resistivity (ρ ≥ 1000 Ωm) could consider the use of unshielded transmission lines. This alternative is especially attractive in rough terrain as well as in areas where ice accretion may exceed 25 mm.
This alternative does not work in all regions. For example, Georgia Power constructed a 110-kV wood-pole H frame line of 100 km from Sumpter to Tift County, Georgia in 1936. The phase conductor height at the tower was 15.7 m. This region reported a thunder day level of 58 days per yr. Thunder is a poor predictor of Ng, but this converts to Ng = 6.3 flashes /(km2-yr). Modern records from lightning location systems (LLS) show a cloud-to-ground Ng ≅ 4 /(km2-yr), and a “total” lightning density of 40 events/km2/yr.
The insulation strength of the seven-ceramic-disc / 2.13 m wood crossarm system was reported as 1335 kV + CFO measured with a 1.5/40 wave. Unshielded, the surge impedance of the 336 kcmil ACSR conductor (diameter 18.3 mm) is 244 Ω in two directions. The critical current Icrit is (1335 kV / 244 Ω) = 5.5 kA. This will be slightly higher considering the extra strength for negative polarity, but about 99% of the lightning flashes will have higher peak current. Nearly every lightning stroke will cause an outage.
This line had an outage rate of 14.5 per 100 km – yr in the period 1936 to 1946. The performance of the unshielded line was bad enough that it was rebuilt in 1946, using twin overhead groundwires and continuous counterpoise. After installation of the OHGW and counterpoise grounding system, the outage rate fell to 0.12 per 100 km per yr, meeting Class “A” security requirements.
There are several other examples of projects that were undertaken specifically to improve the lightning outage rate of a transmission line, generally undertaken after a decade of unsatisfactory service. The rebuilding projects all made use of OHGW. As mentioned earlier, poor lightning performance of a pair of 230 kV transmission lines with separate structures on a common right-of-way led to a significant number of simultaneous outages, and loss of supply to the Avalon Peninsula in Newfoundland, Canada. This was mitigated by fitting non-gapped line arresters (NGLA) across every insulator string on one of the two lines.

Increase Power Flow
Recent assessments highlight the need for increased power transfer in many electrical grids. Higher power transfer can be achieved with a combination of aggressive operation (using retrofitted instrumentation supporting dynamic line rating (DLR), increased aluminum area Aa, increased steel area As (to support the aluminum at high operating temperature), substitution of composite materials with low thermal expansion coefficients for steel, or increased system voltage. Modest improvements can also be achieved with conductor geometries that are perfectly compensated, such as 500 kV four-conductor bundle or 345 kV BOLD designs, that consider surge impedance loading (SIL) in the design. These considerations form an important part of CIGRE Technical Brochure 792. Larger improvements in power transfer can be achieved by converting ac systems to dc, which can also adopt compact configurations as described in Technical Brochure 831.
Another, lower cost alternative is to increase the thermal rating of the overhead line by increasing the conductor operating temperature. This option is limited by ground clearance (sag or catenary) curves for many transmission lines constructed before 1940 to respect a 50°C upper limit. Meteorological loading conditions in original designs considered ice thicknesses of between 0.5 to 1.5 inches of radial ice and wind pressures, which combine with age effects to put the conductor into its “final” state, when no more creep is expected. Each span of a stringing section between dead-end towers has a unique change in sag with temperature, leading to individual maximum temperature ratings for each span. These ratings are established with confidence by extrapolating from known conductor profiles, obtained by laser equipment in a helicopter-based condition survey.
In 2002, Hydro One carried out a laser condition survey on a 115 kV double circuit transmission line first energized in 1929, and based on the results, deemed it unfit for future service. This line used 605 kcmil ACSR (54/7) and a singe 5/16” steel overhead groundwire on ST3-81 lattice steel towers. The 115 kV line was “rebuilt” by placing double circuit 230 kV lattice structures, also in Fig. 6, at each of the original 115 kV tower locations. This project set an upper bound on what can reasonably be considered as “refurbishing” from a maintenance budget.
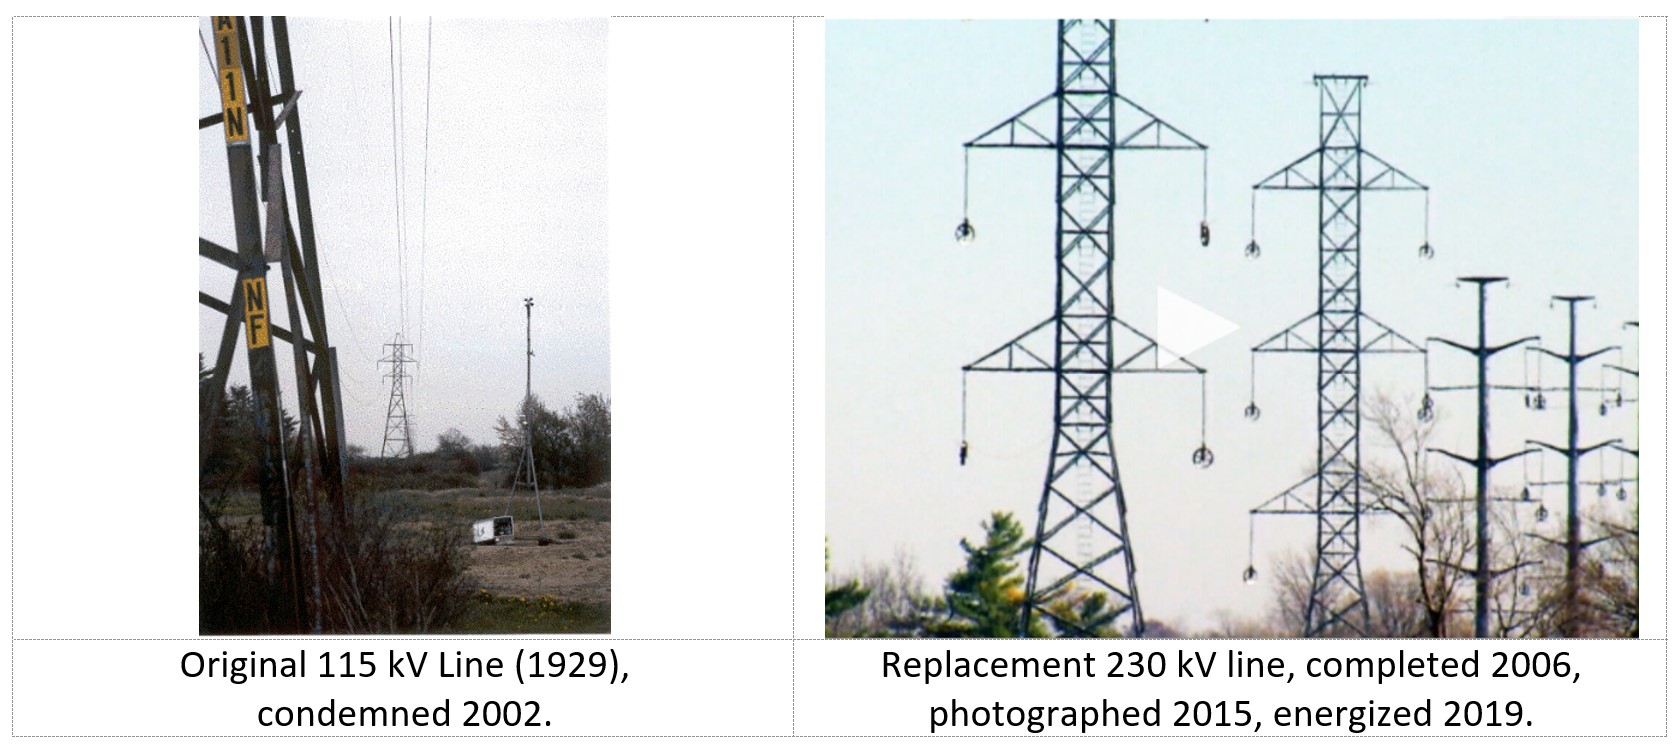
Fig. 7 shows dimensions of twin 230 kV lines, with lattice structures of 24.7 m (81’) height in the same province, which grew to be a six-circuit three-voltage corridor in the early 1990s.
These were energized in 1932 in Ottawa, Canada when its population was 127,000. Load growth corresponding to a population of 1 million led to the extension of a 500 kV system from southwest Ontario to the Ottawa area in the period 1988-1992. Within the city of Ottawa, legacy 115 kV and 230 kV circuits were accommodated on 500-kV double circuit towers, also shown in Fig. 7. When two or more lines run on the same right-of-way, towers that have the same construction and dimensions are preferred, even if the lines are energized at different system voltages. The choice of slightly unbalanced but symmetrical structures reduces some of the visual impact of lines that now traverse residential areas. Another project added 6 m tower extensions and eliminated the bottom crossarm to increase phase-to-ground clearance by a total of 9.45 m. (Q5G / Q2AH TnD World Nov 2017)
Reduce Visual Impact
Steel lattice towers, such as those shown in Fig. 7 are elegant in an engineering sense, as they develop the desired mechanical strength for a range of normal and adverse load conditions with a minimum of weight and cost. Since the 1980s, the public has expressed an appreciation instead for tubular towers in neutral colors. Steel pole structures dominate the wind turbine installations and harmonize reasonably well with urban settings as shown in Fig. 8.
The vertical suspension insulators on the new 138 kV line in Fig. 8 allow the conductors to move from side to side, as well as along the line for partial equalization of tension within stringing sections. The older line configurations in Fig. 9 also show suspension strings.
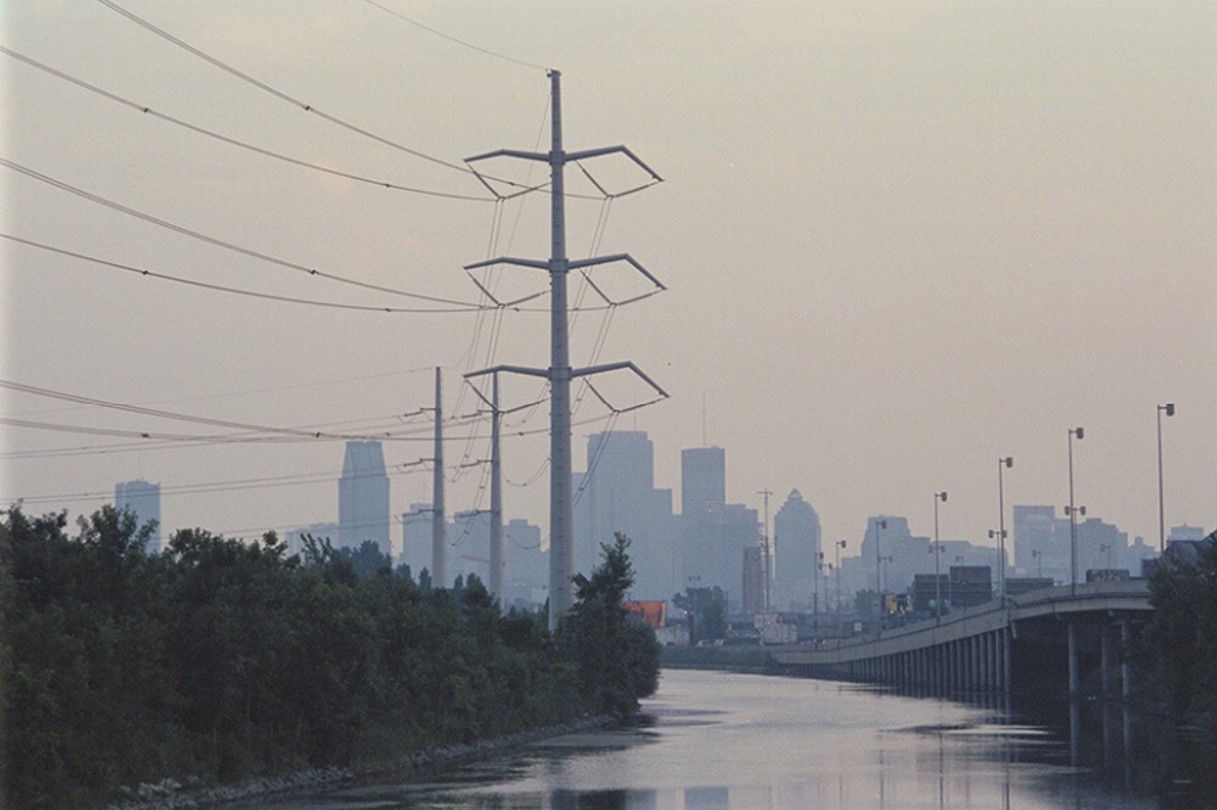
Starting first at 735 kV center phase, and then applied to the compact monopole 315 kV designs in Fig. 10, “V” strings of twin insulators stabilize the horizontal conductor motion at the tower head. This is defined as “compact” construction because it allows a reduction in electrical clearances.
Address Right-of-Way Encroachment
In many regions, overhead lines originally situated in open terrain have supported development, including many houses backing directly on the right-of-way. In France, for example, EDF has addressed the risk of exposure to fault potential transfer from 63 kV and 90 kV systems by fitting transmission line surge arresters to directly reduce the number of faults.
References
[1] EPRI, EPRI AC Transmission Line Reference Book – 200 kV and Above, Third Edition (the Red Book), Palo Alto, CA: EPRI 1011974, December 2005.
[2] ESKOM, The planning, design and construction of overhead power lines, Johannesburg: Crown Publications cc, May 2010.
[3] CIGRE Study Committee B2: Overhead Lines, Overhead Lines, Cham, Switzerland: Springer Nature, 2017.
[4] CEATI International, “Best Practices Guide for Extra High Voltage (EHV) AC Overhead Transmission Line Design – Electrical Aspects,” CEATI Report T163700-3398A, Montreal, Canada, February 2019.
[5] IEEE, IEEE Guide for Improving the Lightning Performance of Transmission Lines, Piscataway, NJ: IEEE Standard 1243-1997, Reaffirmed 2008, September 2008.
[6] IEEE Power & Energy Society, Transmission and Distribution Committee, IEEE Standard 1410-2010: IEEE Guide for Improving the Lightning Performance of Electric Power Overhead Distribution Lines, New York: IEEE Standards Association, 2011 Jan 28.
[7] CIGRE WG 33.01, Guide to Procedures for Estimating the Lightning Performance of Transmission Lines, Paris: CIGRE Technical Brochure 63, October1991 revised 2021.
[8] CIGRE WG C4.23, “Procedures for Estimating the Lightning Performance of Transmission Lines – New Aspects,” CIGRE Technical Brochure 839, Paris, June 2021.
[9] IEEE-SA Board of Governors and IEEE Power and Energy Society, IEEE Recommended Practice for Overvoltage and Insulation Coordination of Transmission Systems at 1000 kV AC and Above, New York, NY : IEEE Standard 1862-2014, 15 May 2014.
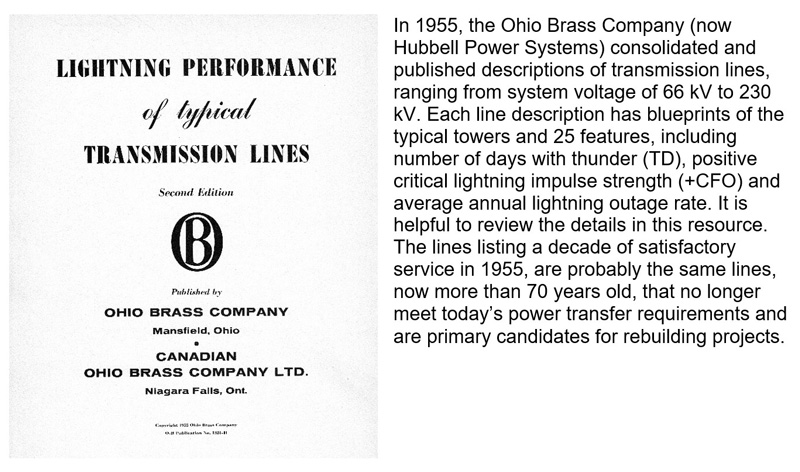
[10] Ohio Brass Company, Lightning Performance of Typical Transmission Lines, Second Edition, Mansfield, OH: Ohio Brass Company Publication 1321-H, 1955.
[11] NERC (North American Electric Reliability Corporation), “2023 State of Reliability Technical Assessment,” 06 2023. [Online]. Available: https://www.nerc.com/pa/RAPA/PA/Performance%20Analysis%20DL/NERC_SOR_2023_Technical_Assessment.pdf. [Accessed 30 07 2023].
[12] NERC, “Transmission Availability Data System (TADS),” North American Electric Reliability Corporation, 2023. [Online]. Available: https://www.nerc.com/pa/RAPA/tads/Pages/default.aspx. [Accessed 30 07 2023].
[13] CIGRE WG 33.01, Guide to Procedures for Estimating the Lightning Performance of Transmission Lines, Paris: CIGRE Technical Brochure 63, 1991.
[14] CIGRE WG C4.26, Evaluation of Lightning Shielding Analysis Methods for EHV and UHV AC and DC Transmission LInes, Paris: CIGRE Technical Brochure 704, October 2017.
[15] NALCOR, “Island Interconnected System Supply Issues and Power Outages,” [Online]. Available: http://www.pub.nf.ca/applications/IslandInterconnectedSystem/files/rfi/PUB-NLH-177.pdf. [Accessed 30 07 2023].
[16] Newfoundland Labrador Hydro, “Uptrade Transmission Line Corridor, Bay d’Espoir to Western Avalon,” September 2011. [Online]. Available: http://www.pub.nf.ca/applications/ARCHIVE/NLH2012Capital/files/application/NLH2012Application-VolumeII-Report10.pdf. [Accessed 30 07 2023].
[17] INMR, “Looking Back on the Great Ice Storm of 1998,” 28 11 2020. [Online]. Available: https://www.inmr.com/looking-back-on-the-great-ice-storm-of-1998/. [Accessed 30 07 2023].
[18] INMR, “Experience from Application of Transmission Line Arresters in Romania,” 07 03 2023. [Online]. Available: https://www.inmr.com/experience-from-application-of-transmission-line-arresters-in-romania/. [Accessed 31 07 2023].
[19] Vaisala, “Vaisala Xweather Interactive Global Lightning Density Map,” Vaisala, 2023. [Online]. Available: https://interactive-lightning-map.vaisala.com/. [Accessed 01 08 2023].
[20] CIGRE WG B2.63, Compact AC overhead lines, Paris: CIGRE Technical Brochure 792, February 2020.
[21] CIGRE WG B2.62, Compact DC overhead lines, Paris: CIGRE Technical Brochure 831, March 2021.
[22] CTV News, “Powerline to nowhere: $100M powerline costing taxpayers millions,” Bell Media, 05 11 2015. [Online]. Available: https://toronto.ctvnews.ca/powerline-to-nowhere-100m-powerline-costing-taxpayers-millions-1.2644932. [Accessed 13 09 2023].
[23] R. Anderson, H. V. Niekerk, H. Hroninger and D. Meal, “Development and field evaluation of a lightning earth-flash counter,” IEE Proceedings, vol. 131 Part A, no. 2, pp. 118-124, March 1984.
[24] M. Peterson, D. Mach and D. Buechler, “A Global LIS/OTD Climatology of Lightning Flash Extent,” JGR Atmosphers, vol. 126, no. e2020JD033885, p. 23, 19 Feb 2021.
[25] NOAA, “GOES – East Full Disk – Geostationary Lightning Mapper,” NEDIS.STAR.Webmaster@noaa.gov, 02 08 2023. [Online]. Available: https://www.star.nesdis.noaa.gov/goes/fulldisk_band.php?sat=G16&band=EXTENT3&length=240&dim=0. [Accessed 02 08 2023].
[26] Environment Canada, “The average lightning flash density (flashes per square kilometre, per year) in Eastern Canada (1999 to 2018).,” 21 06 2016. [Online]. Available: https://www.canada.ca/en/environment-climate-change/services/lightning/statistics/maps-hotspots.html. [Accessed 13 7 2022].
[27] R. Evert and M. Gijben, “Official South African Lightning Ground Flash Density Map 2006 to 2017,” in Earthing Africa Symposium & Exhibition 2017, Johannesberg, South Africa, 5-9 June 2017.
[28] CIGRE WG C4.407, Lightning Parameters for Engineering Applications, Paris: CIGRE Technical Brochure 549, August 2013.
[29] Vaisala Xweather, “The Annual Lightning Report – Total Lightning Statistics for 2022,” Vaisala, 2023. [Online]. Available: https://indd.adobe.com/view/d0591066-471e-41b9-83e1-4dc937aaeb96. [Accessed 10 09 2023].
[30] P. Sporn, “Lightning Experience on 132-kV Transmission Lines of the American Gas and Electric Company System, 1930-1931,” AIEE Transactions, pp. 482-490, June 1933.
[31] CIGRE WG C4.39, “Effectiveness of line surge arresters for lightning protection of overhead transmission lines,” CIGRE Technical Brochure 855, Paris, December 2021.
[32] E. Tarasiewicz, F. Rimmer and A. Morched, “Transmission Line Arrester Energy, Cost, and Risk of Failure Analysis for Partially Shielded Transmission Lines,” IEEE Transactions on Power Delivery, vol. 15, no. 3, pp. 919-924, July 2000.
[33] J. Takami and S. Okabe, “Observational Results of Lightning Current on Transmission Towers,” IEEE Transactions on Power Delivery, vol. 22, no. 1, pp. 547-556, January 2007.
[34] W. A. Chisholm and S. de Almeida de Graaff, “Adapting the Statistics of Soil Properties into Existing and Future Lightning Protection Standards and Guides,” in 2015 International Symposium on Lightning Protection (XIII SIPDA), Balneario Camboriu, Brazil, 28 September – 2 October 2015.
[35] EPRI, Transmission Line Reference Book, 345 kV and Above, Second Edition, Palo Alto, CA: EPRI, 1982.
[36] A. R. Hileman, Insulation Coordination for Power Systems, New York: Marcel Dekker Inc., 1999.
[37] EPRI, Transmission Line Reference Book: 115-345 kV Compact Line Design, Palo Alto, CA: EPRI 1016823, 2008.
[38] EPRI, “Guide for Transmission Line Grounding: A Roadmap for Design, Testing and Remediation,” EPRI, Palo Alto, CA, 2004. 1002021.
[39] W. A. Chisholm, “Arrester Protection of Lower Voltage Circuits on Multi-Voltage Towers: Issues & Opportunities,” in 2019 INMR World Congress, Tucson, AZ, October 20-23, 2019.
[40] F. Rizk, “Negative Impulse Ground Wire Corona Parameters for Backflash Evaluation of High Voltage Transmission Lines,” IEEE Transactions on Power Delivery, vol. 37, no. 4, pp. 2474-2481, August 2022.
[41] F. Rizk, “Novel Solution to Back Flashovers on High Voltage Transmission Lines: The Embedded Ground Conductor,” IEEE Transactions on Power Delivery, vol. 37, no. 6, pp. 5345-5355, December 2022.
[42] W. Chisholm and W. Janischewskyj, “Lightning Surge Response of Ground Electrodes,” IEEE Transactions on Power Delivery, vol. 4, no. 2, pp. 1329-1337, April 1989.
[43] J.-F. Goffinet, “Design & Erection of Insulated Cross-Arms,” 07 01 2022. [Online]. Available: https://www.inmr.com/design-erection-of-insulated-cross-arms/. [Accessed 10 09 2023].
[44] CIGRE WG B2.56, Ground Potential Rise at Overhead AC Transmission Line Structures during Power Frequency Faults, Paris: CIGRE Technical Brochure 694, 2017 07.
[45] L. Grcev, B. Markovsi and M. Todorovski, “Lightning Efficient Counterpoise Configurations for Transmission Line Grounding,” IEEE Transactions on Power Delivery, vol. 38, no. 2, pp. 877-888, April 2023.
[46] W. A. Chisholm, “Evaluation of Simple Models for the Resistance of Solid and Wire-Frame Electrodes,” IEEE Transactions on Industry Applications, vol. 51, no. 6, pp. 5123-5129, November/December 2015.