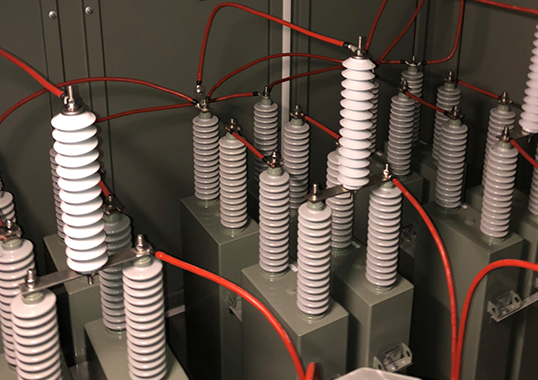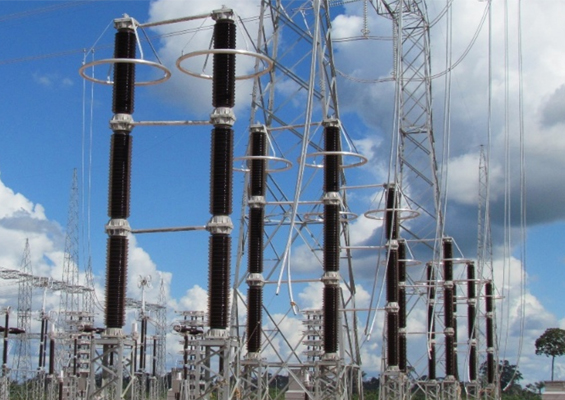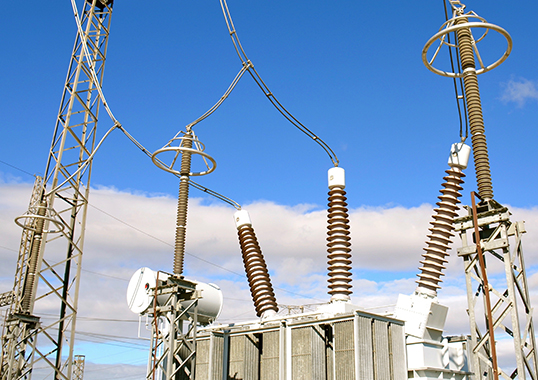
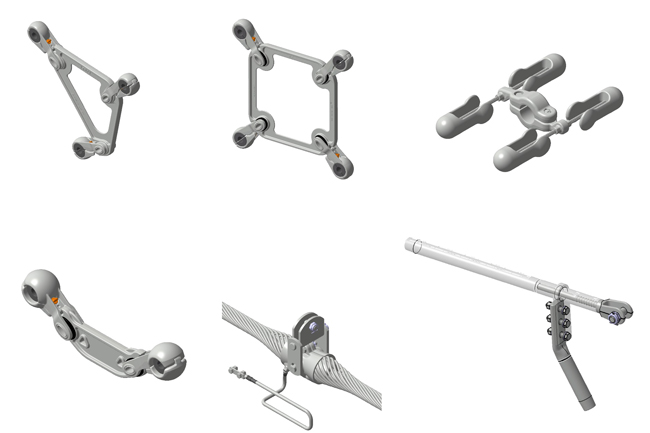
Protection against overvoltages using gapless zinc oxide surge arresters has been accepted and adopted worldwide. In particular, assets such as transformers, cables and gas-insulated substations are highly vulnerable to transient surges from lightning and switching. While performance of such arresters under these types of overvoltages is superior to previous coordinating gaps and silicon carbide technology, effectiveness of surge protection and the resulting protection margin for equipment depends greatly on physical distance between the arrester and the equipment being protected.
This edited past contribution to INMR by Professors A. Haddad and M. Albano at Cardiff University in the U.K. as well as experts from the National Grid, explored different scenarios of substation arrangements and quantified protection margins offered by arresters as a function of their distance from equipment.
Overvoltages due to lightning and switching surges have significant impact on substation design and insulation coordination of power systems. Quantifying and mitigating their impact in and around substations needs to be investigated to allow determination of overvoltage levels and their probability throughout a substation. This facilitates insulation co-ordination procedures with the aim of reducing rate of failure, system outages and restoration costs. To reduce system outages, withstand voltage level is selected such that it will allow flashovers to occur at selected points (e.g. co-ordinating gaps) away from expensive and difficult-to-repair equipment. At high system voltages, it is generally more economical to use overvoltage protection versus increasing the insulation withstand level of equipment.
Zinc oxide arresters are recognized as an effective means to protect against lightning and switching surges. They are characterized by faster action and superior energy absorption capability, in addition to suppressing follow-on AC current, allowing continuity of supply following operation. Current insulation co-ordination practice adopts a statistical approach that involves determination of overvoltage distribution caused by lightning events and switching operations and then relating this to electrical strength of equipment. Such an exercise ensures that dielectric strength of substation equipment remains higher than the level of overvoltage stress imposed on them. Where not met, overvoltage protection is needed. Usually, a protective margin is adopted to ensure reliability of the system. Introduction of overvoltage protection can be used to increase withstand level of a substation.
In the U.K., for example, 420 kV substation equipment has a standard lightning impulse withstand voltage (LIWV) of 1425 kV. In IEC 60071-2, it is recommended that the highest occurring voltage on the terminals of equipment with non-self-restoring insulation should be reduced by a factor of 1.15 (1239 kV). According to this standard, minimum protective margin is 15% for switching overvoltages and 25% for lightning events.
Commonly adopted 400 kV arresters present a determined LIWV value obtained from standardized laboratory tests. However, terminals of substation equipment where arresters have been applied can experience significantly higher voltage magnitudes due to location of the protecting arrester.

Circuit Model Parameters
EMTP models for selected configurations of substation layouts are developed to compute lightning and switching overvoltages. In these models, overhead lines, cables, transformers, GIS and substation entry circuits are considered and various circuit connection scenarios simulated.
Overhead Line Towers & Conductors
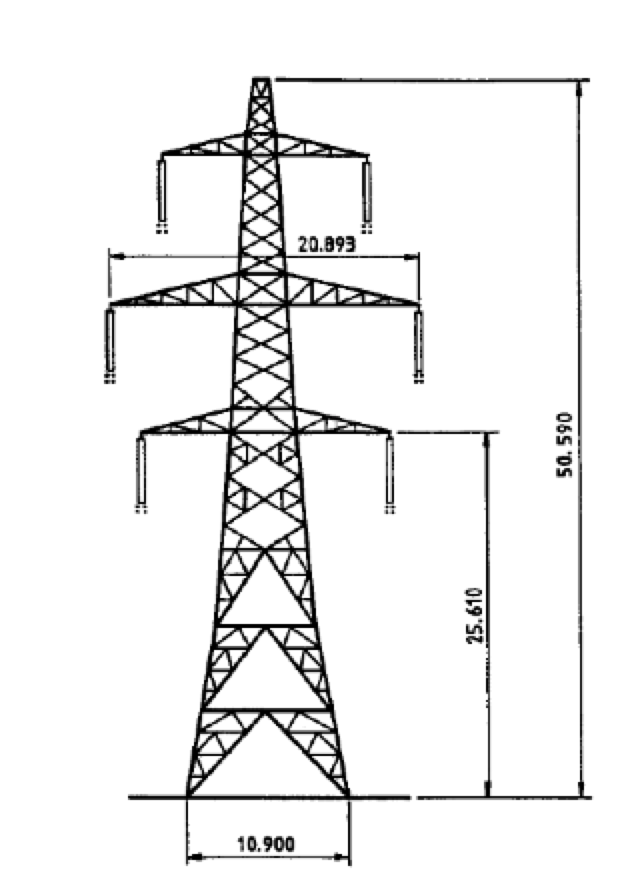
The overhead line tower adopted for this study is the L6 STD tower with dimensions shown in Fig.1 and Table 1. Four distributed-parameter lines representing the tower structure are used in series with the tower footing resistance. Tower footing resistance is modeled as simple linear resistance and has been set to 20 . Soil ionization is not considered.
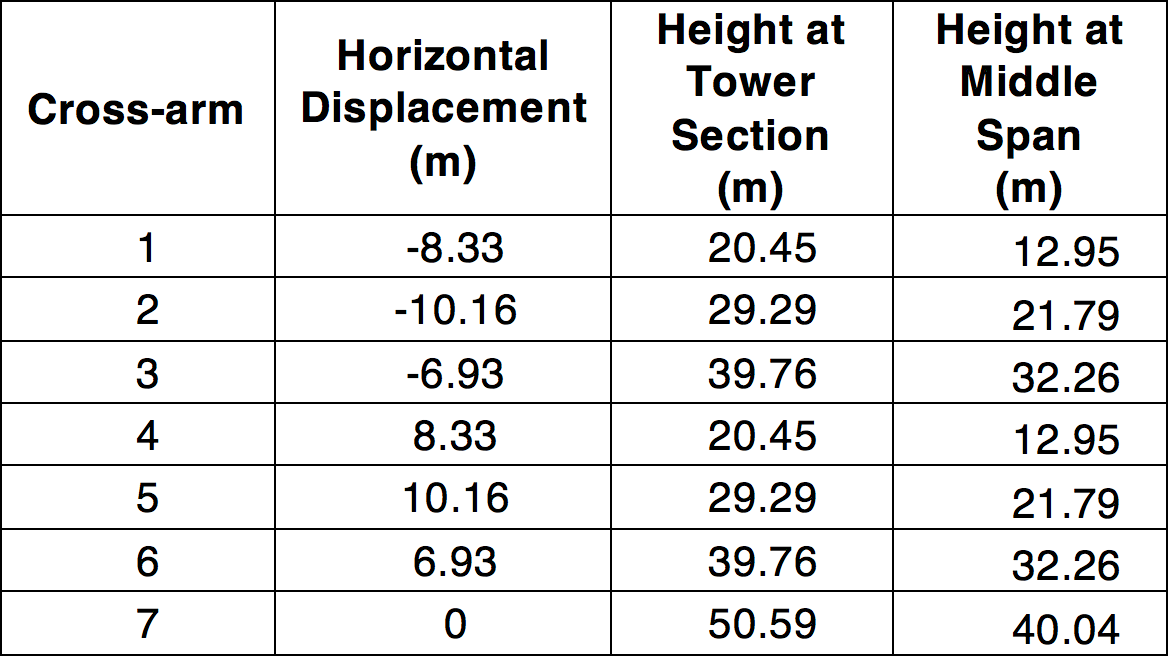
For lightning studies, all spans have been modeled in detail, assuming 360 m length for each from strike point to substation. Beyond striking point, longer equivalent spans were used to represent total length of the line, which suppresses unrealistic surge reflections. L6 double circuits are characterized by four Zebra sub-conductors on phase conductors and a single Lynx conductor on earth wire. The lower conductor at the midspan point is assumed to be 12.95 m above ground level. The JMarti model has been selected for this work.
Insulators & Arcing Horns
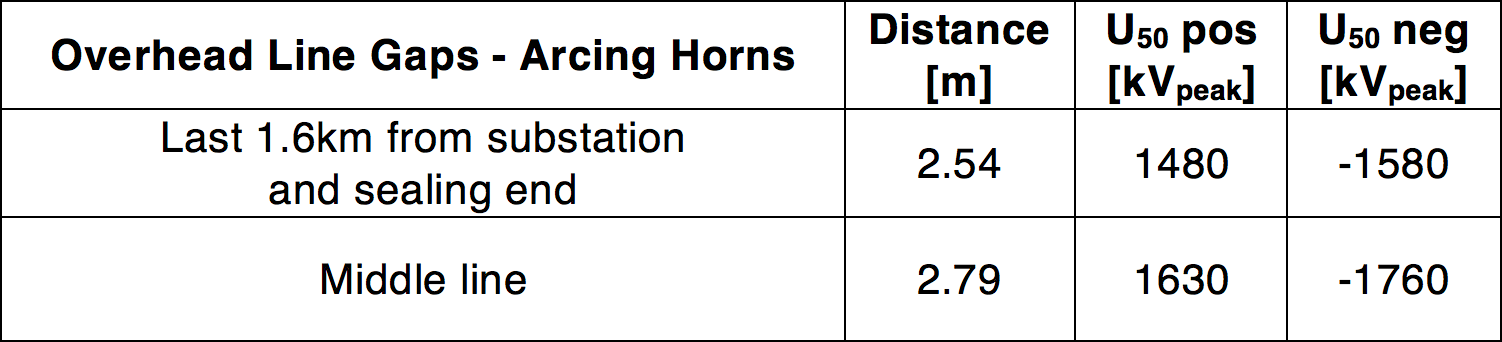
The insulator string withstand voltage and its voltage-time characteristic during flashover were modeled using TACS. The insulator string model consists of voltage dependent switches in parallel with capacitors between the phases and the tower, which is at ground potential in order to simulate the coupling effect between conductors and tower structure. Risk of a flashover event across the insulator is assessed by comparing voltage time curves and actual voltage of the insulator using the TACS model. For the EMTP model, arcing horn distance was considered instead of insulator length. The arcing horn setting is according to NGTS 3.2.3 and shown in Table 2.
Line Entry, Busbars & Cables
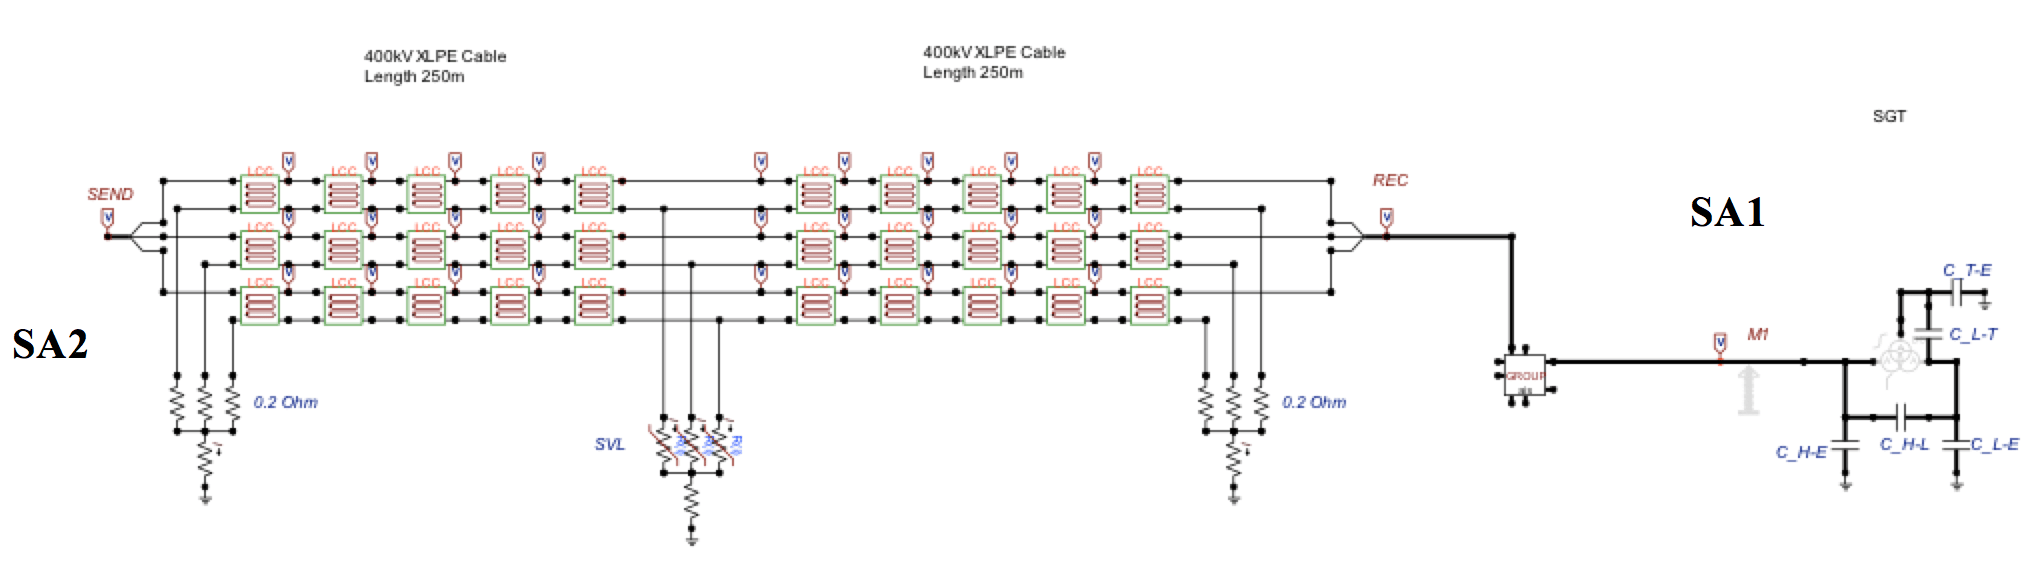
Use of inclined conductors from the first tower to the substation gantry was considered to reduce unrealistic high reflection. Bus work and conductors at air-insulated substations (AIS) are modeled as line sections, untransposed distributed parameter sections: For lengths more than 3 m, modal surge impedance was used but lengths less than 3 m, are introduced in the system as lumped parameter inductor; here, a value of 1.0 µH/m was adopted. Cables are modeled as distributed lines with surge impedances lower than that of the overhead line. Typical ranges are 30 to 60 for XLPE cables. High voltage cable models adopted in EMTP studies are LCC components and the PI model calculated at 500 kHz and each component represents 50 m of cable. Therefore, analysis of 500 m cable length uses 10 sections. The EMTP model here represents the 420 kV XLPE cable specifications with a cross-section of 2500 mm2 and axial distance equal to 0.25 m. The presence of the cable requires some additional assumptions on bonding and on the number of cable sections adopted. Generally, for cable lengths below or equal to 300 m, only one section of cable is adopted and therefore the middle point is not accessible. Instead, for lengths above 300 m, two sections of cable are required and the middle point can be accessed along the cable section.
Other Substation Plant
In substations, other high voltage plant need to be represented in the transient analysis. The main parameter of equipment that affects lightning surge is capacitance to ground since it reduces incoming overvoltage slope/magnitude. In lightning studies, the arrester model included the added inductance of the connecting leads as suggested by manufacturers; a lumped inductance element with a per unit length value of 1.0 µH/m was used. In this work, inductance was included as the EMTP group for the arrester model. The arrester selected is a commercially available ZnO type with ratings: Um=420 kV / Ur=330. In order to take into account possible effects of the AC steady state voltage during the lightning event, all lengths of the overhead line have been modeled and connected to an AC source model, with a network equivalent surge impedance and short circuit impedance. The equivalent surge impedance value used is 200 Ω, assuming that two outgoing lines were connected at that node.

Simulation Scenarios
Several lightning and switching studies were conducted to determine the maximum separation distance between arrester and transformer that still offers satisfactory overvoltage protection. The following two scenarios were considered:
Scenario S1: Single line (L6- construction, 10 km, 50 km and 100 km lengths) into AIS busbars and transformer;
Scenario S2: Single line terminated with a cable section (50 m, 100 m, 200 m, 400 m, 500 m lengths), an AIS and a transformer.
The Lightning Impulse Protective Margin (LIPM) and the switching Impulse Protective Margin (SIPM), as defined in NGTS 3.2.3, were calculated as indicators of protection efficiency.
Overvoltages & Protection Levels Under Lightning Surges
Two main lightning impact scenarios on overhead lines were investigated: shielding failure and backflashover. The Heidler source is used as the lightning source with 400 resistance parallel impedance. The selected current magnitudes of the lightning surge are 30 kA and 150 kA for direct strike and backflashover respectively. The lightning impulse is applied at a point located 0.9 km from the substation (3 spans). In shielding failure simulations, the stroke is directly applied to Phase A conductor of the incoming overhead line and, in the case of the backflashover event, the stroke is applied to the earth wire at the third tower location. A safety margin equal to 1.15 on LIWV has been selected. Therefore, any overvoltage above the threshold of 1240 kVpk has been identified as critical for non-self-restoring insulation.
Scenario S1
In scenario S1 (comprising the SG Transformer, the AIS and the overhead line, as shown in Fig. 2), maximum overvoltage magnitudes were computed at the super grid transformer, installed within the air insulated substation, for both lightning and switching events. Effective protective distance of arresters can then evaluated for each event. The presence of arcing horns on insulator strings of the transmission line plays a significant role in reducing maximum overvoltage entering the substation. However, the flashover threshold voltage of the arcing horn is known to be variable on real electrical networks and hence not easy to account for. In the simulation, when a simplified flashover model of the arcing horns is adopted, the sparking gap is set to 2.54 m, for the last 3 towers before the substation and to 2.74 m for the remaining towers.
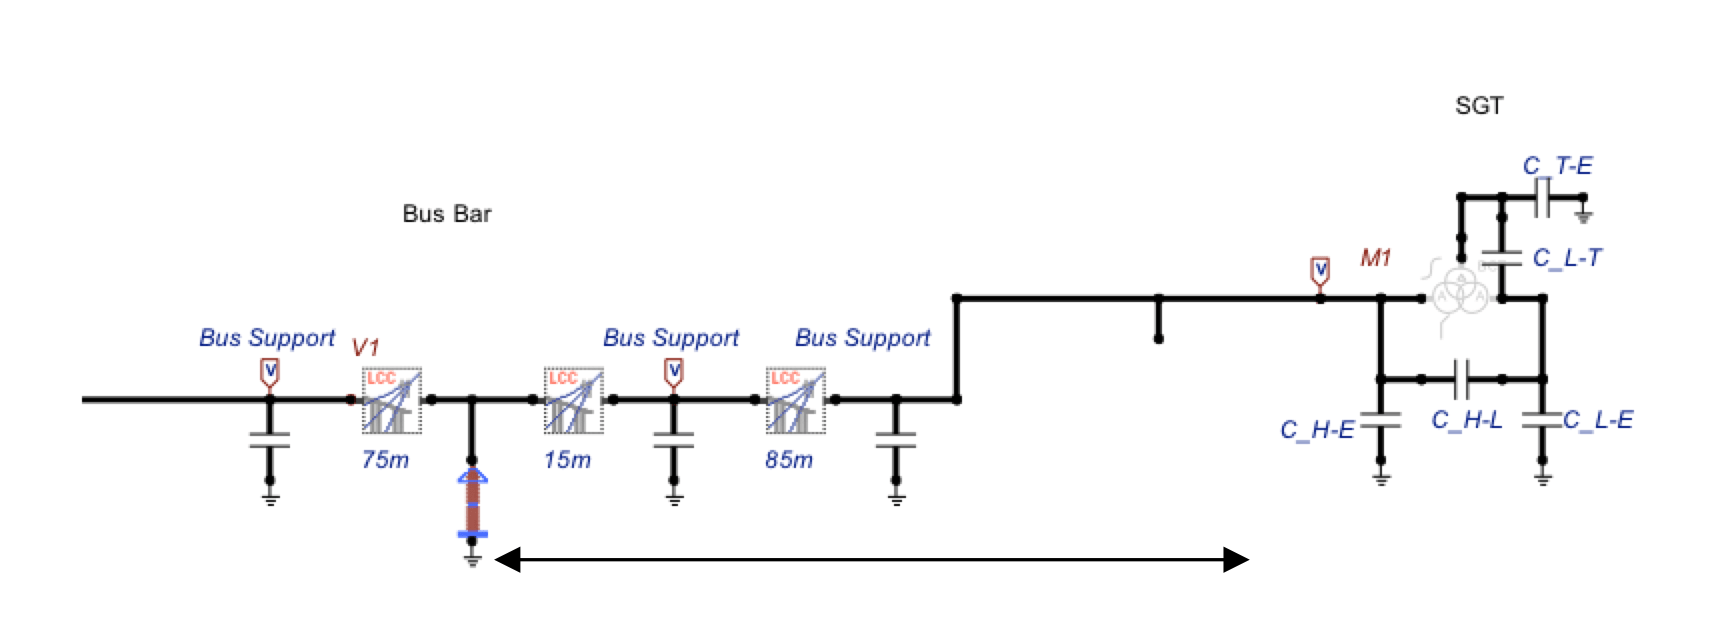

a) Scenario S1- Shielding failure simulations
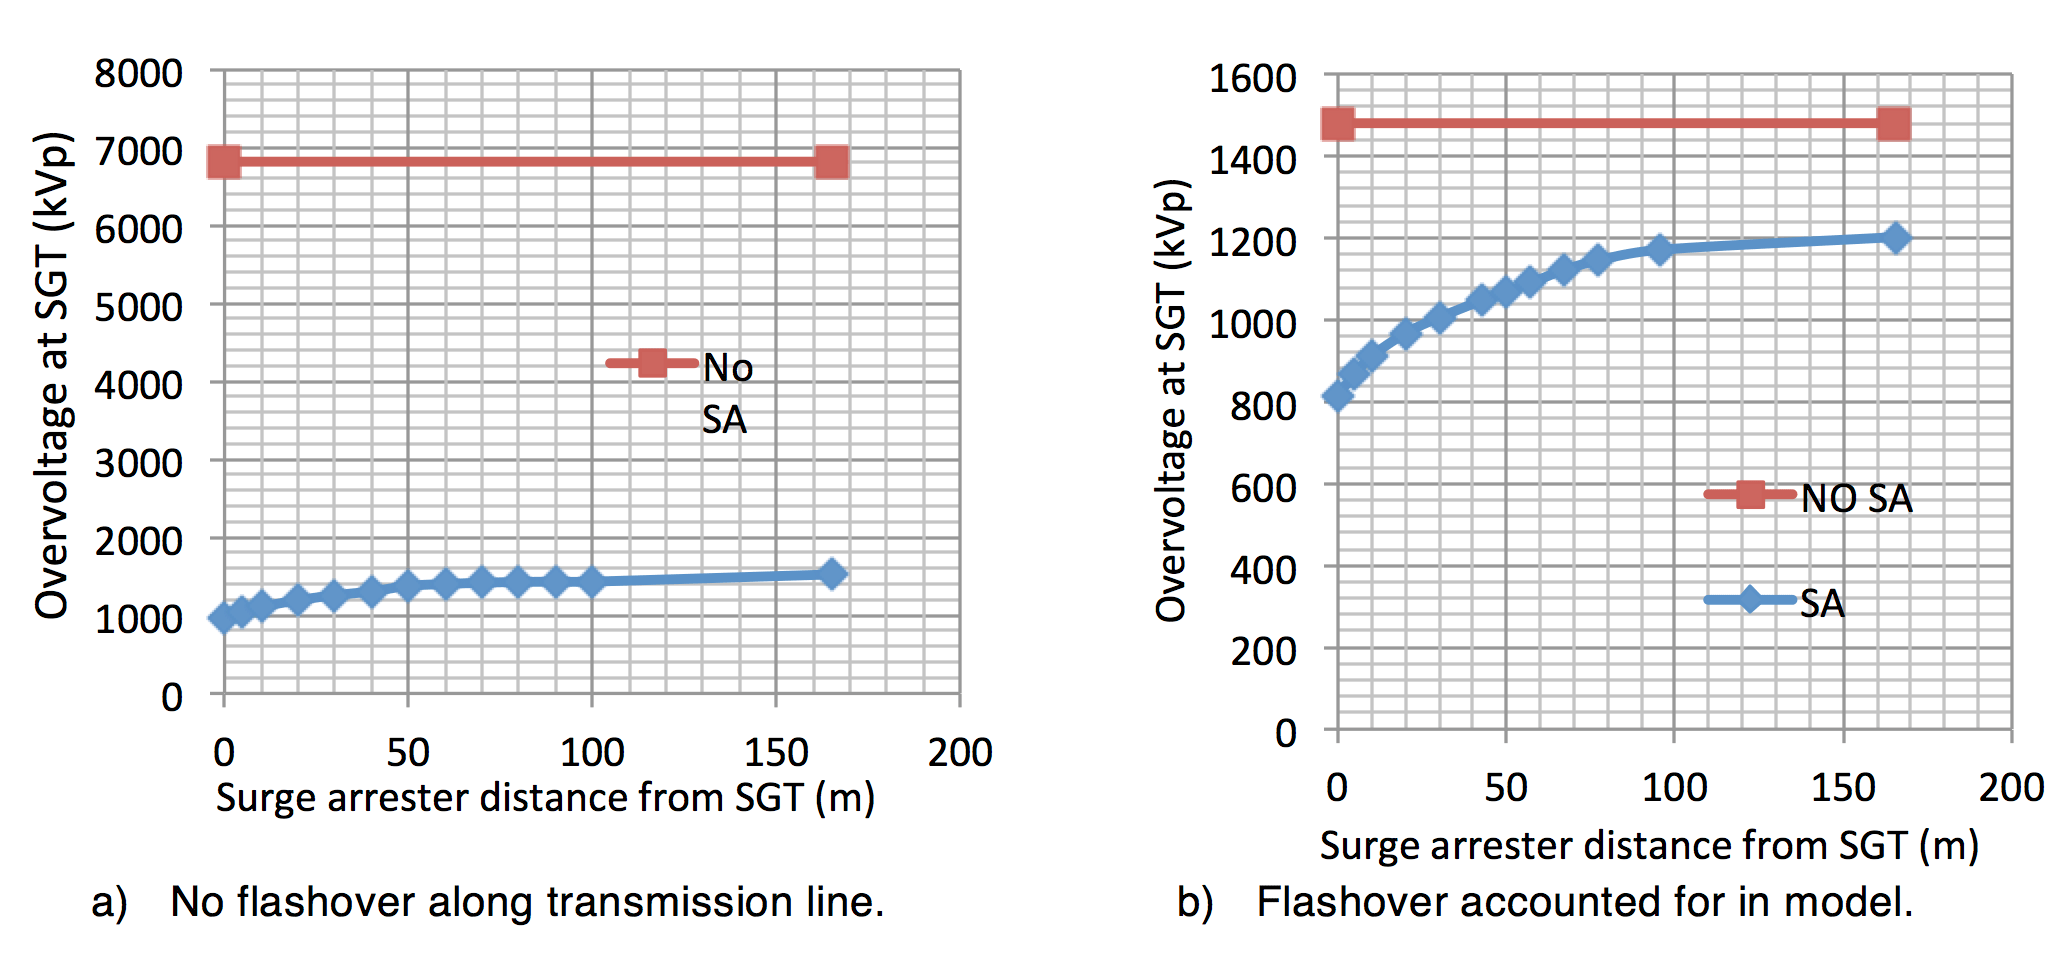
Maximum prospective surge magnitudes at the SGT in the absence of arresters under shielding failure events were computed. Simulation of prospective peak surge voltages appearing at the substation following a shielding failure with and without flashover on the arcing horns are summarized in Fig. 3. The simulation results of the two configurations (with and without insulator flashover), taking into account application of arresters at selected locations are plotted as the variation of lightning voltage magnitudes at SGT terminals versus separation distance from the arrester location – respectively for no-flashover and with-flashover models.
b) Scenario S1 – Backflashover lightning simulations
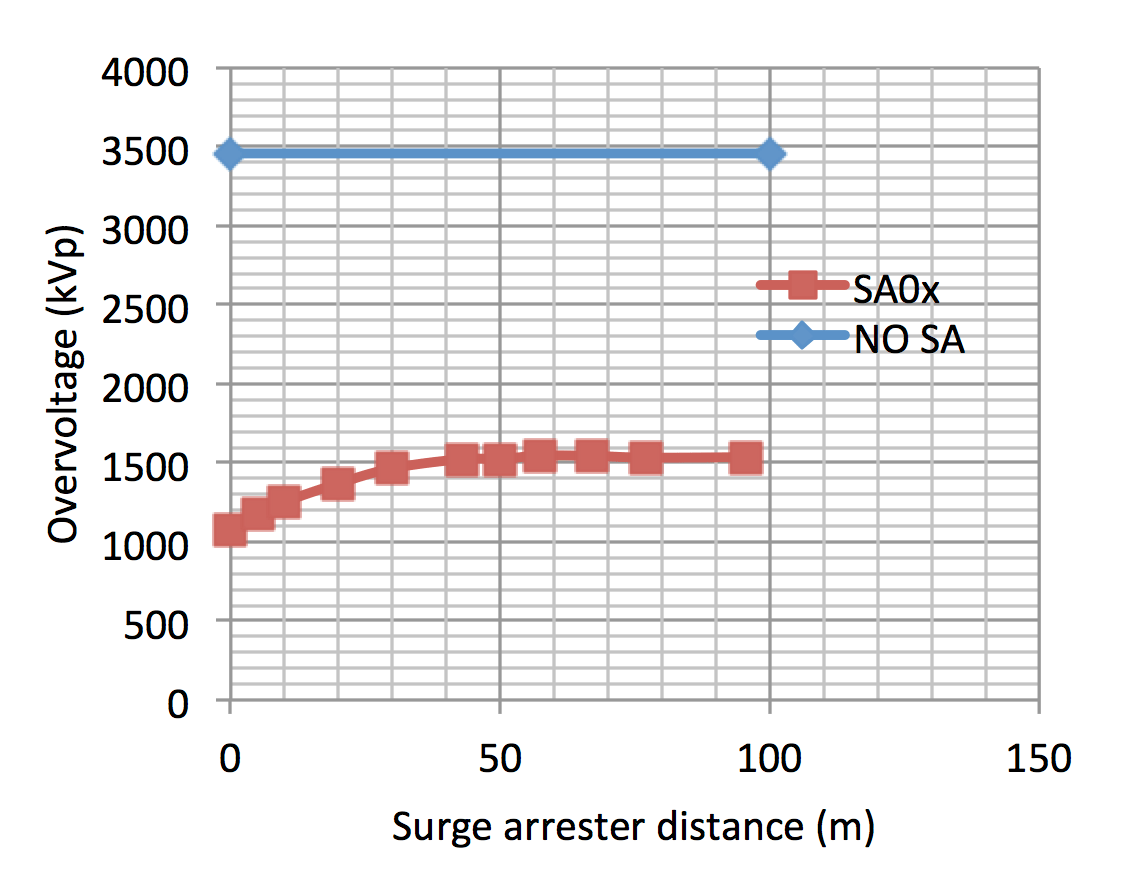
In this model, the lightning stroke is applied on the earth wire at a point located 0.9 km from the substation. Fig. 4 shows overvoltage magnitude computed at the SGT terminals (node M1 on Fig. 2) versus arrester distance from equipment (red curve) and without arresters (blue curve). Maximum calculated LIPM is around 32% when arresters are installed at the SGT terminals. No overvoltage protection is offered by arresters at distances greater than 20 m.

Scenario S2
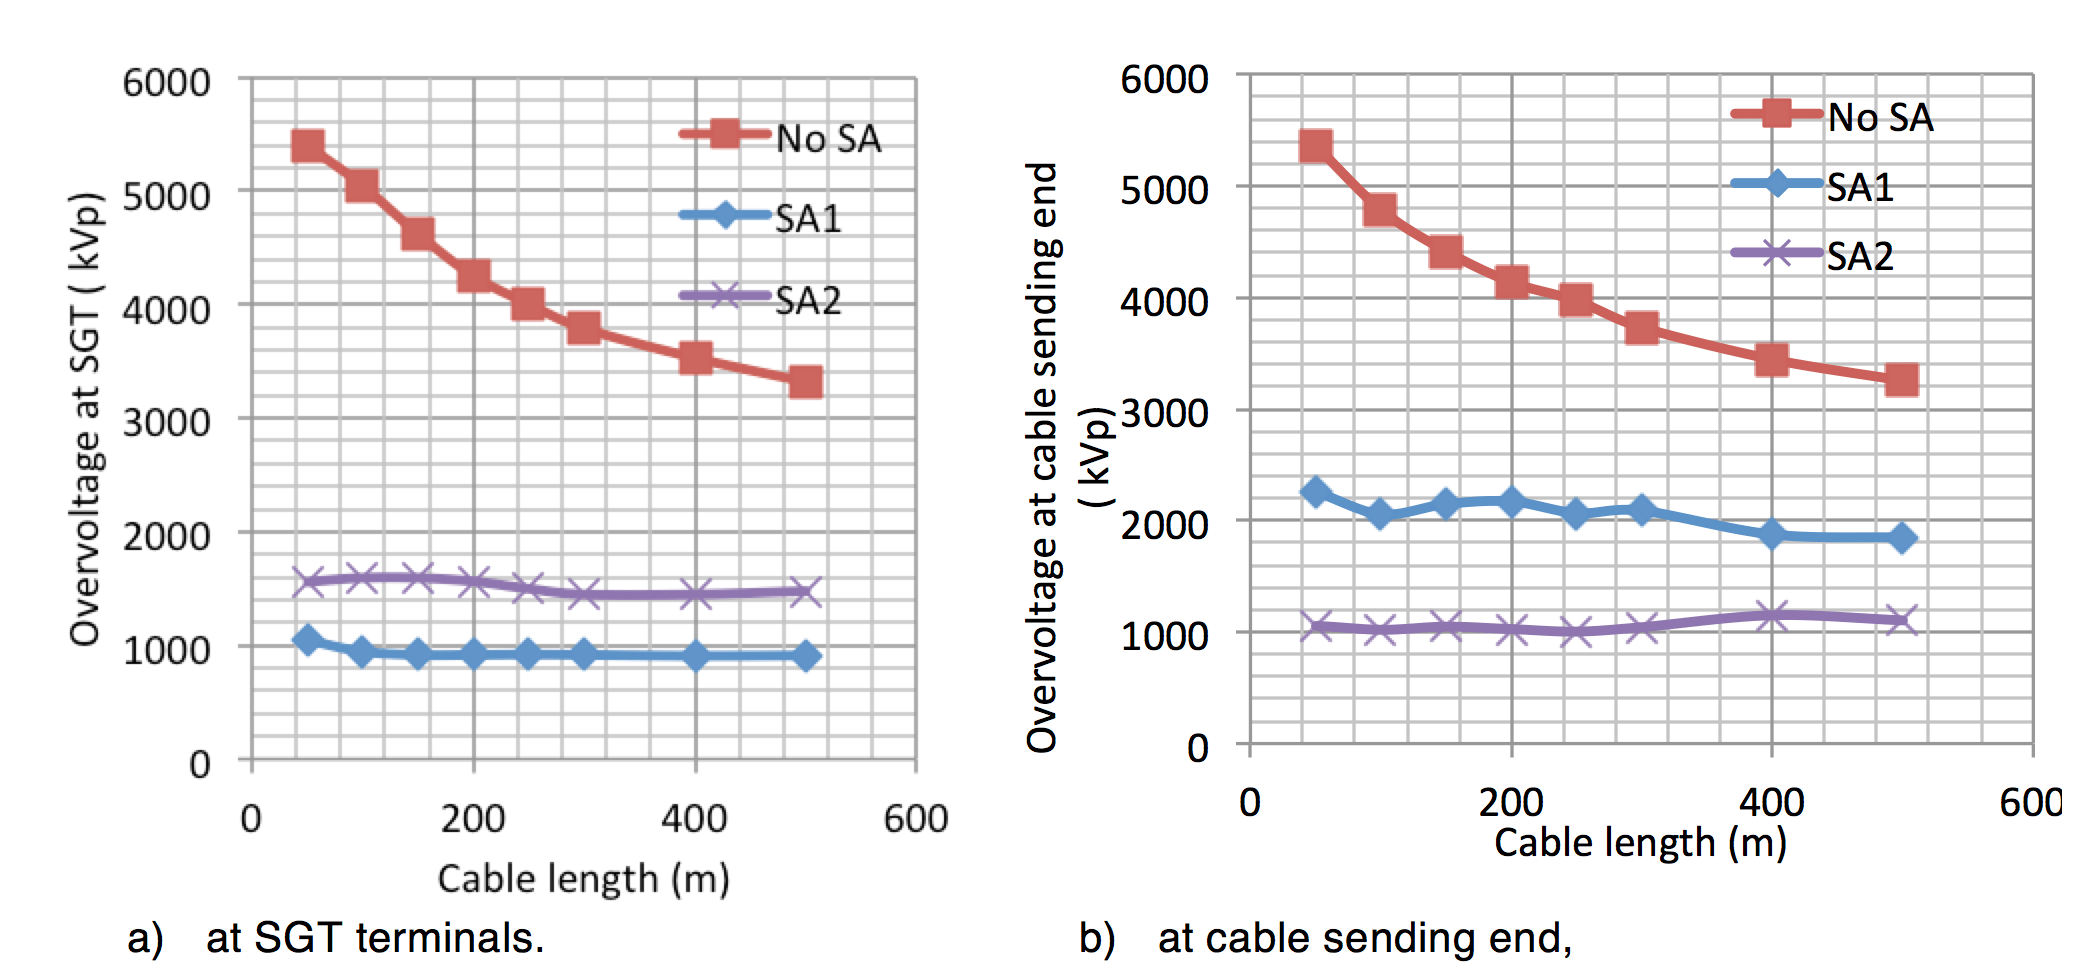
In the second scenario, the simulations consider the added effect when an XLPE cable section is present, as shown Fig. 5. The cases for the following cable lengths were investigated: 50 m 100 m, 150 m, 200 m, 250 m, 400 m and 500 m. Studies were carried out to evaluate the protection level when placing surge arresters at selected locations:
• At SA1 location, on the HV side of the power transformer,
• At SA2 location, at the cable sending end, and
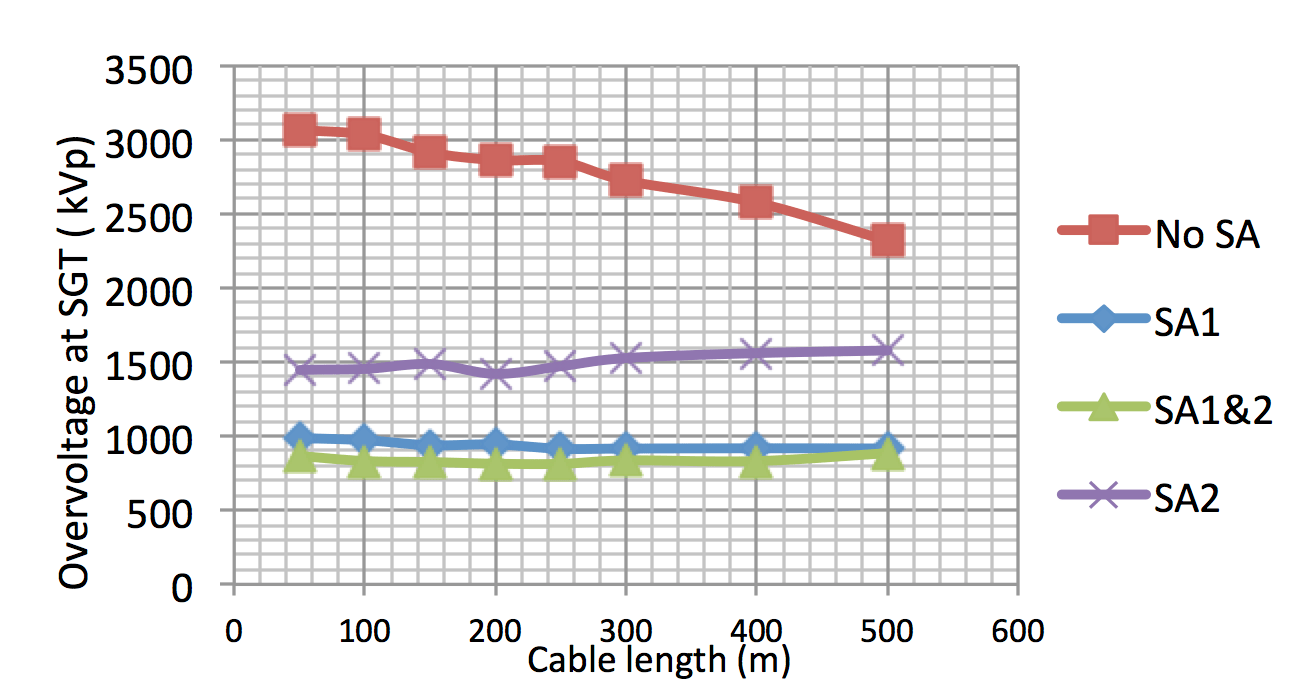
• At both SA1 and SA2 locations, i.e. at the HV side of the power transformer and at the cable sending end.
a) Scenario S2: Direct lightning (shielding failure) simulations
Without taking into account the additional surge protection offered by the arcing horn on the transmission line, the results indicate that the XLPE cable and the HV equipment in the substation would be put at risk by a shielding failure on the transmission line, as shown in Fig. 6a. The application of surge arresters lowers significantly the maximum values of the incoming surge. However, in the case where a surge arrester is only used at the cable sending end (SA2), the XLPE cable is protected but the transformer will be subjected to voltages beyond its insulation withstand level and, hence, will not be protected by the surge arrester, as can be seen in Fig. 6b. The application of a surge arrester at the SGT (SA1 location) offers an excellent overvoltage protection for the transformer; cables of lengths over 150 m provide an additional protection. From these studies, it was established that the protection of the cable and the SGT could be obtained with the use of arresters at both SA1 and SA2 locations.
b) Scenario S2 – Backflashover lightning simulations
Results of the backflashover lightning simulations for scenario 2 are summarized in Fig. 7. Without arrester protection, very high overvoltage magnitudes were computed at the transformer terminals. Application of arresters at the cable end is not sufficient to lower voltage below the acceptable withstand level (SA2) at the transformer because of busbar length between cable and SGT. Installation of arresters at SA1 protects the SGT in an effective way. The LIPM increases with increase in cable length but additional cable protection at the SGT is constant for cable sections between 250 m and 500 m. To protect the SGT and the XLPE cable effectively, arresters have to be used at both SA1 and SA2 locations.

Overvoltages & Protective Levels Under Switching Surge
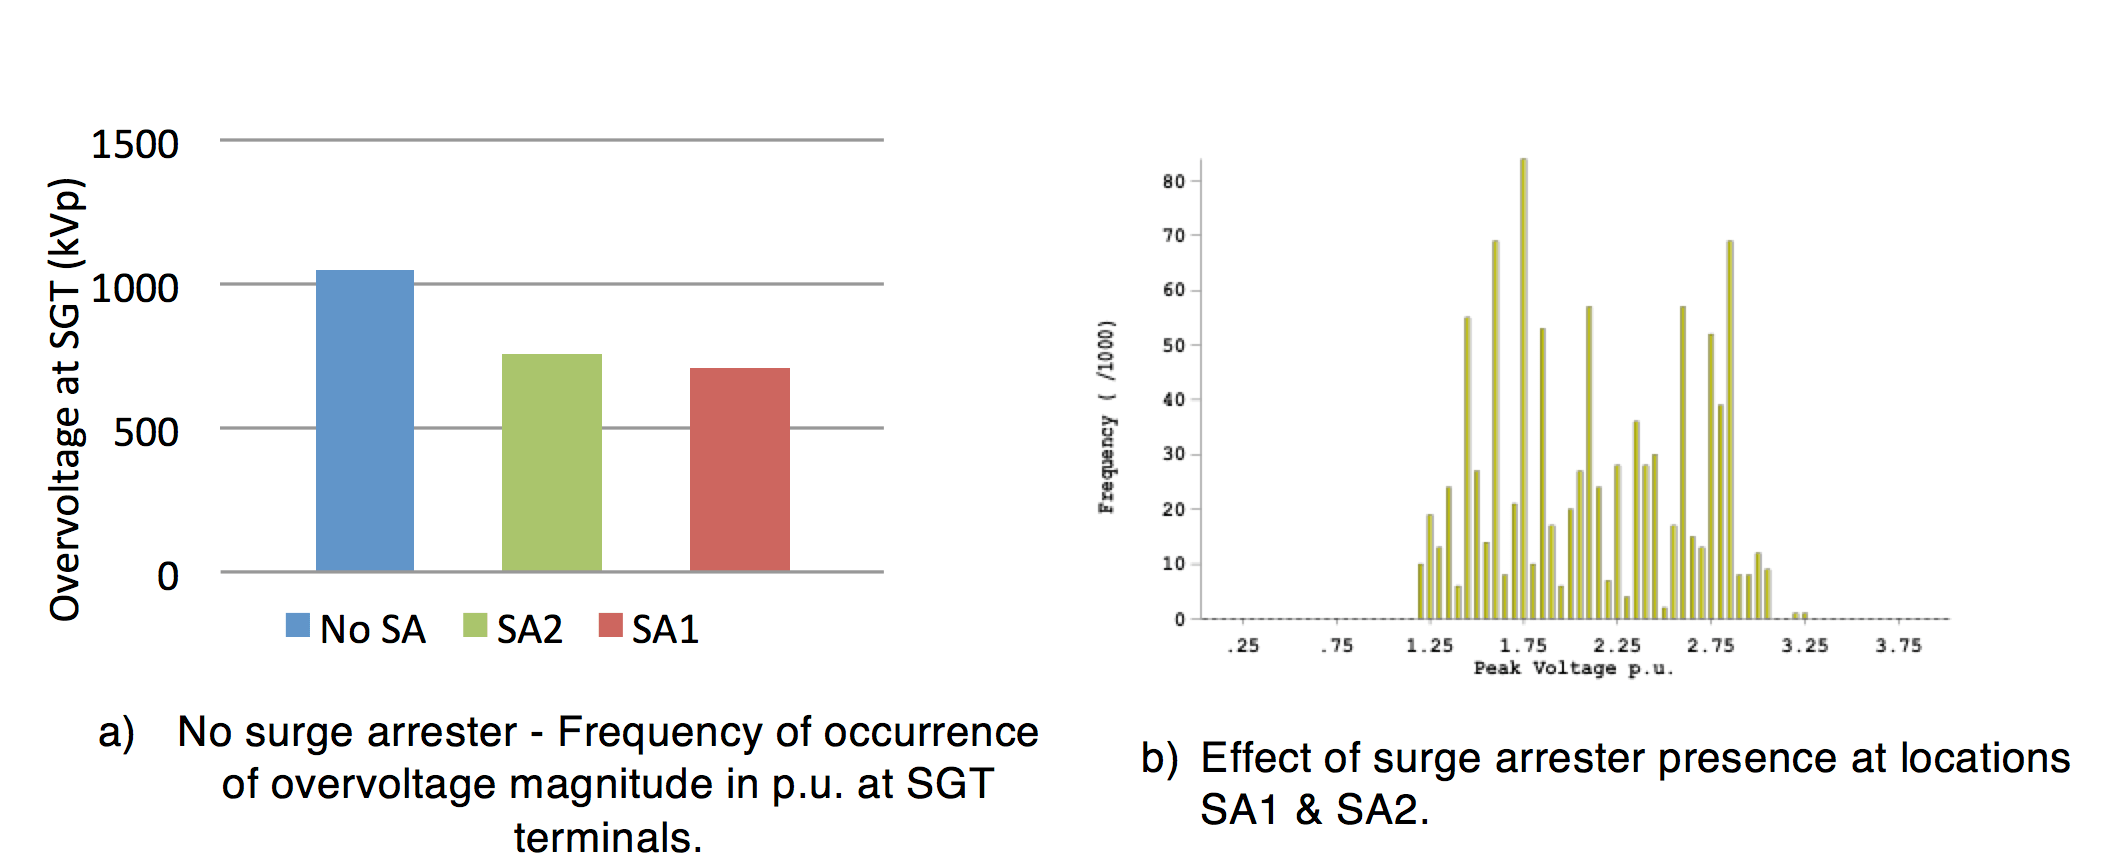
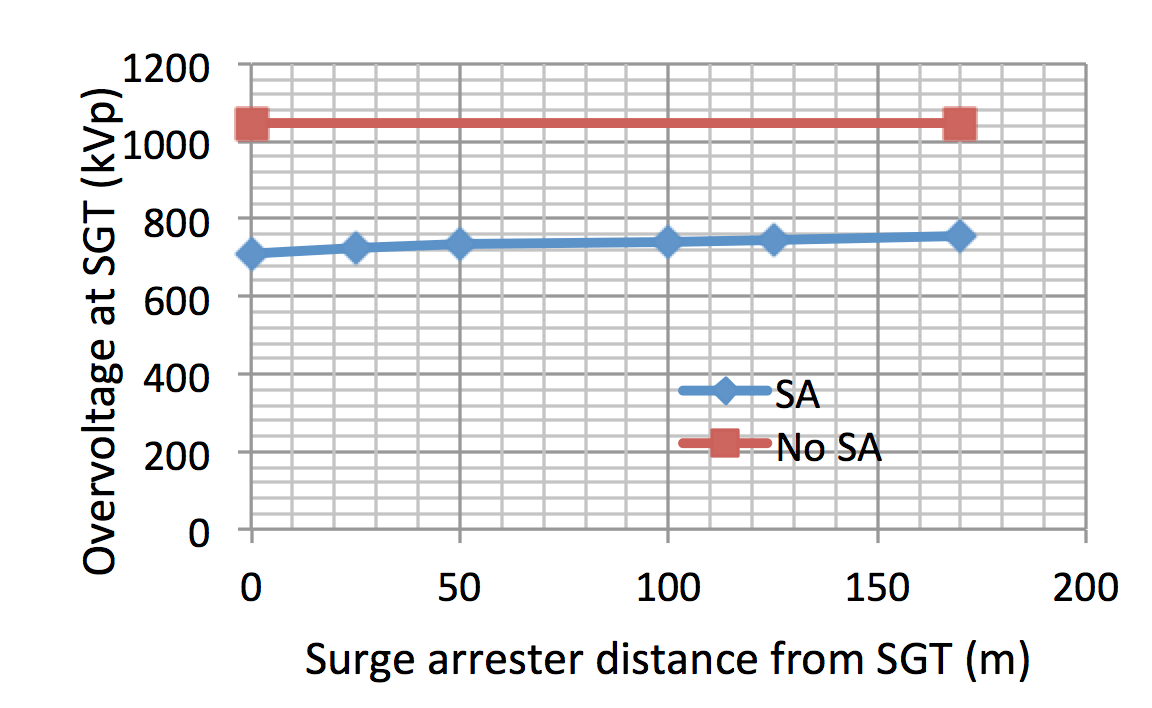
Switching simulations were performed including trapped charge (with voltage levels of -1, -1 and +1 p.u.). Maximum overvoltage values recorded at the SGT terminals are shown in Fig. 8a. Without arresters (blue bar), the computed peak voltages are close to the switching impulse withstand voltage level (SIWL 1050 kV); adoption of arresters at the line entrance (location SA2) or at the SGT terminals (location SA1) allows reducing overvoltages to levels well within the withstand limit. Frequency of occurrence of overvoltage magnitudes at the SGT terminals without arresters is shown in Fig. 8b (computed using an EMTP systematic study with 1000 switching operations over 1/3 of a cycle). The variations with arrester separation distance from equipment of the overvoltage magnitude, which is calculated at the SGT terminals, is shown in Figs. 9. It is clear that appropriate application of arresters allows effective protection of the SGT over a wide range of locations.
Conclusions
Shielding failure and backflashover lightning simulations as well as systematic switching with trapped charge taken into account were performed for two selected generic scenarios of substation – line configurations that include overhead lines, busbars, cables, transformers and arresters. Extensive EMTP simulations quantified the effect of the separation distance between arrester and equipment to protect (in this case the SGT). It was demonstrated that these distances vary with location of arrester installation or as a function of cable length and type of surge. Useful findings have been described for effective arrester location.