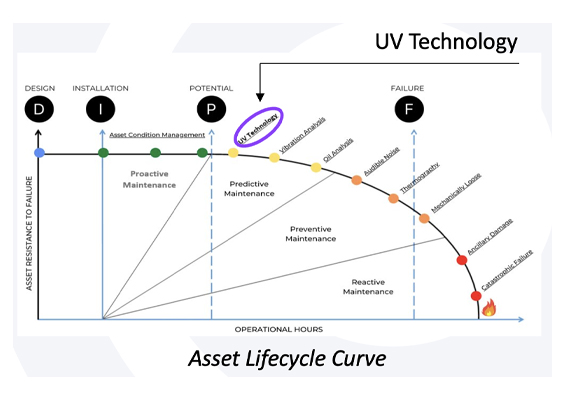
Among the technologies to assess the condition of power network assets are infrared and ultraviolet imaging. Both have been used for decades and both rely on specialized cameras that have evolved towards greater portability, improved data storage and sharing and greater ease in assessing the severity of whatever problems are identified. The continued existence of these two imaging technologies has made some wonder whether they are complementary and must be used together or whether they are alternatives that each can detect the same incipient problem.
The best answer is that each technology offers unique specific benefits when it comes to locating certain types of defect. In general, it can be said that infrared imaging records presence of internal heat due to elevated leakage current while ultraviolet imaging detects presence of corona due to high electric field near surfaces. The first phenomenon depends on an internally-generated heat source and the second on surface condition. Both situations represent a possible threat to continued safe operation of a line component or equipment at a substation and are reasons for closer scrutiny or immediate remedial maintenance.
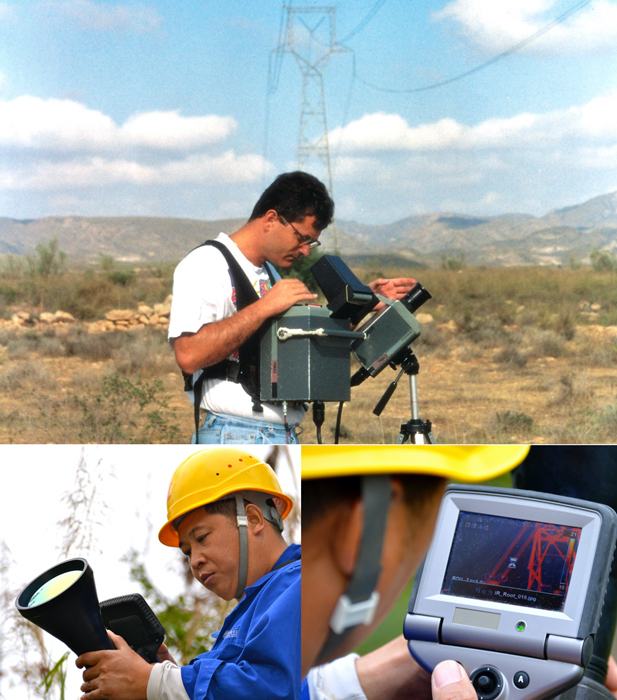
Not that long ago, infrared equipment used for inspection of power system assets was heavy and cumbersome. These days, however, an IR camera with several times the pixels of the bulkier versions it replaced is light and portable.
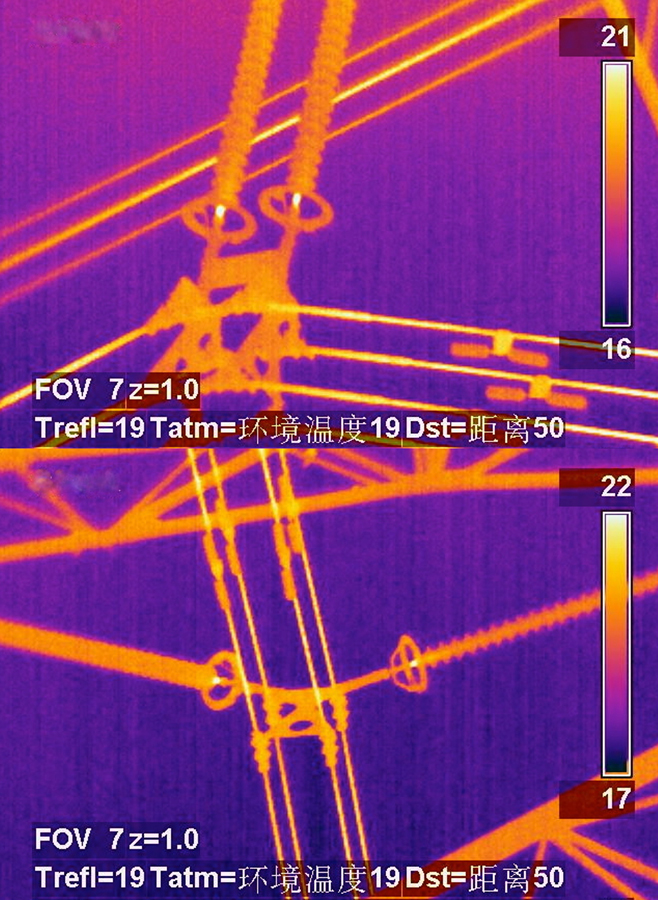
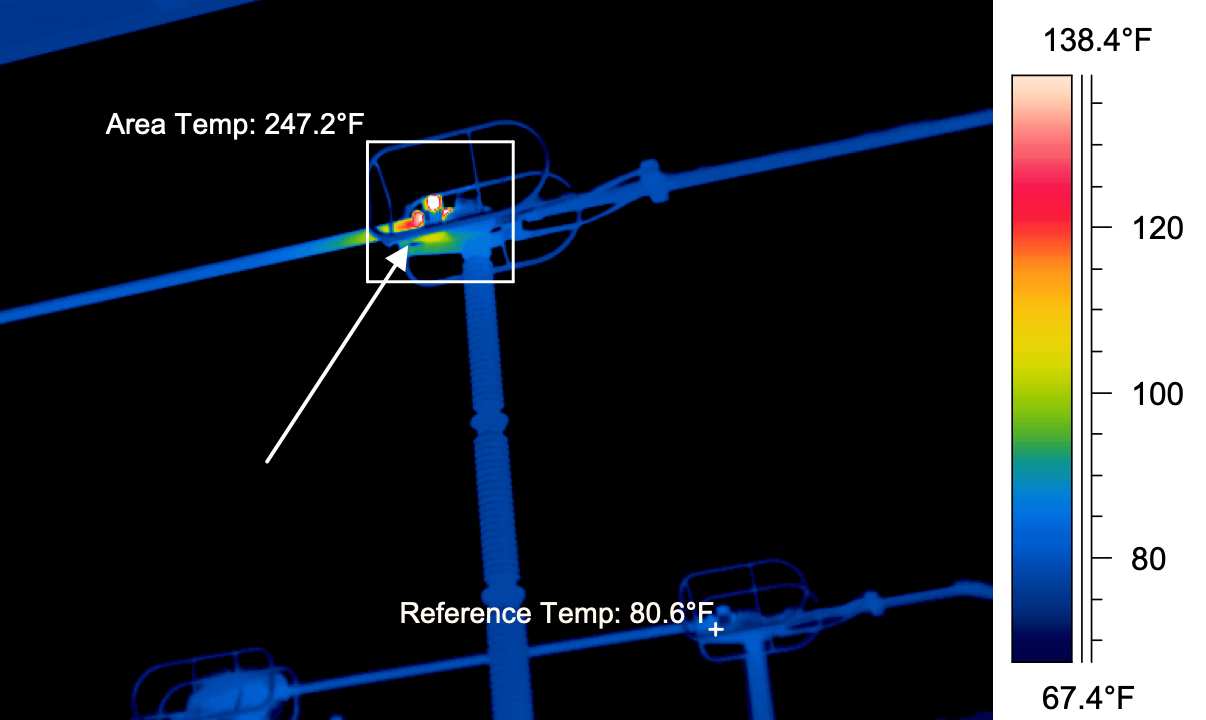
In IR inspection, the definitive factor in condition assessment is not absolute temperature but rather how temperature of the item being inspected compares to the reference temperature of similar nearby items. This is because what is crucial is not the temperature of any particular component being inspected but rather whether or not this temperature differs significantly from that of similar items located next to it.

IR imaging also requires the inspector to be aware of key meteorological parameters since it can be affected by humidity as well as wind conditions. For example, higher relative humidity makes any ‘hot spot’ appear cooler than it actually is. While there is no specific camera adjustment in the case of high wind, a trained operator has to be aware and take this into account when preparing an inspection report. One of the keys to all infrared imaging is emissivity since each item being inspected will emit at the same radiation as it absorbs. That means infrared imaging of each object has to be adjusted based on its known emissivity. ![]()
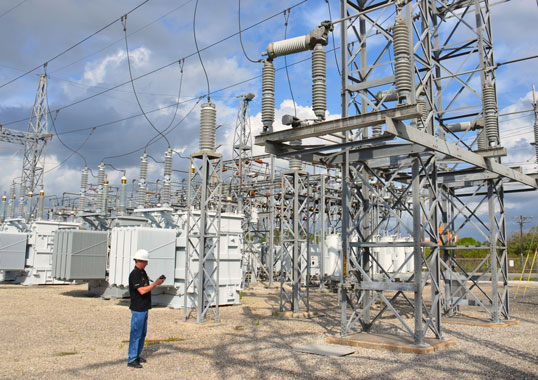
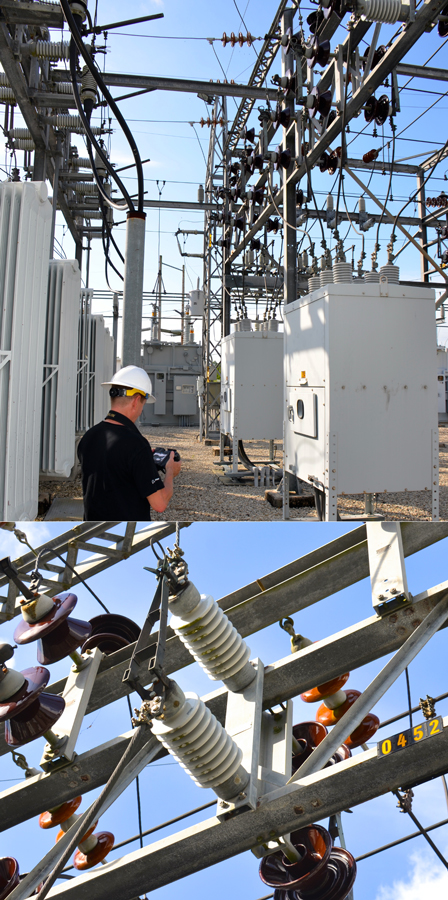
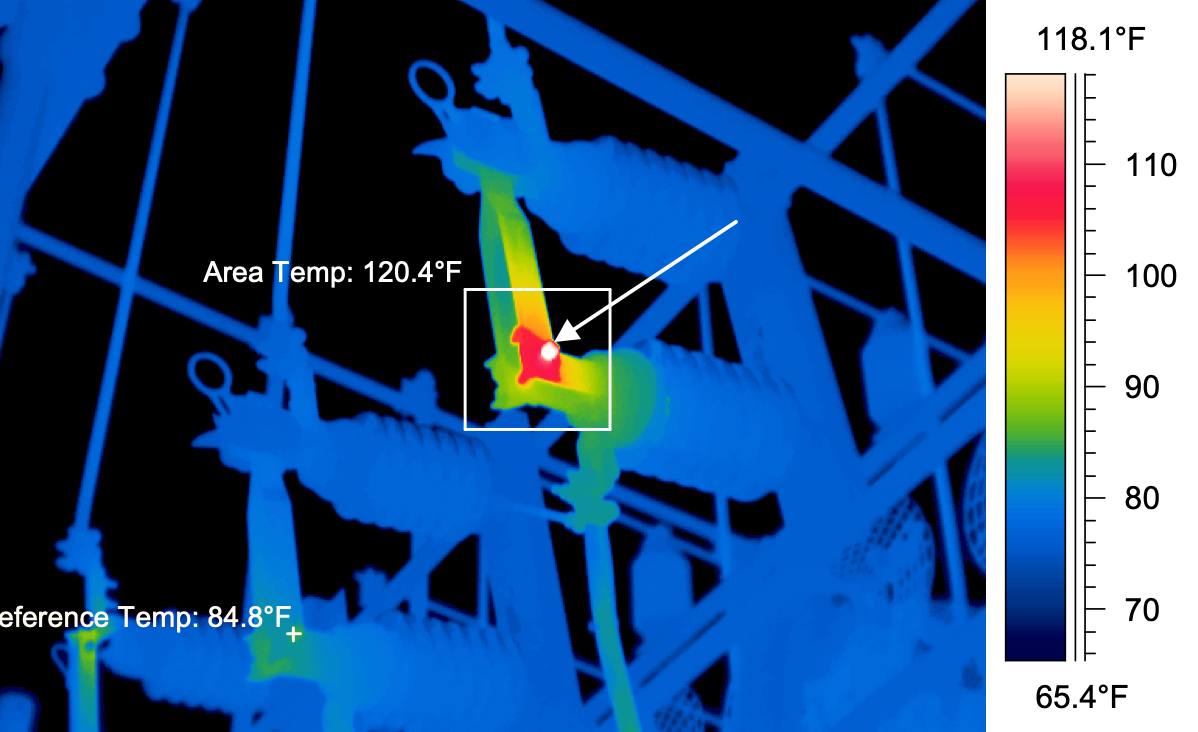
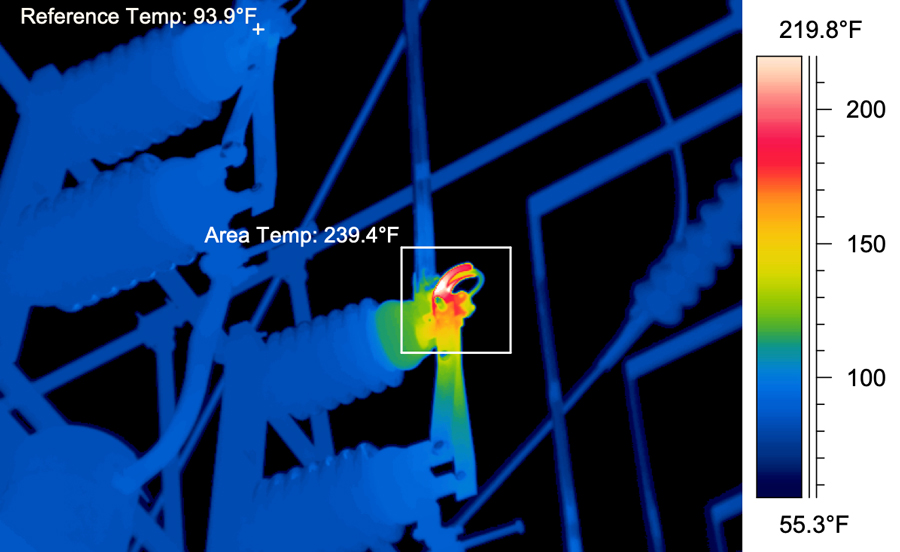
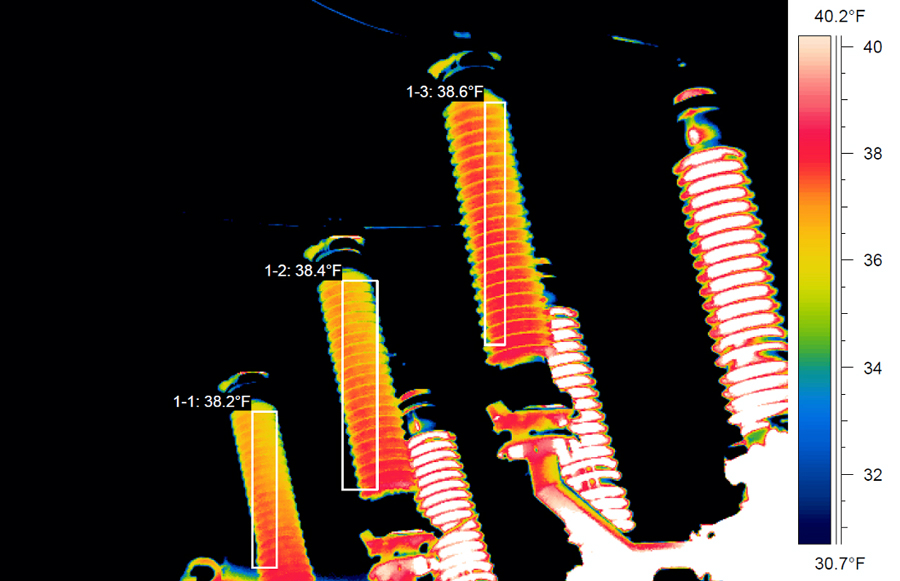
For example, during thermal inspection of a 138 kV Substation near Fort Myers, Florida, a hot spot was observed on the blade of a transmission switch. This is something that could have been caused by corrosion between the fingers and blade and probably only requires cleaning. A typical report by the inspector in such a case will pinpoint the location of such hot spots, indicating the device numbers and also the phase where these were detected. Moreover, findings of any inspection can have different consequences depending on system operator. Every utility has their own strategy on how to prioritize maintenance problems, whether urgent, serious or moderate. Sometimes it is a question of availability and what is happening elsewhere in the grid. Still, if a temperature differential of 150°F (66°C) is observed between the phases of the same load and at the same location, this is almost always regarded as ‘critical’. By contrast, localized temperature rises of up to about 20°F (6.7°C) can be due solely to increasing load or even just to changes in ambient conditions.

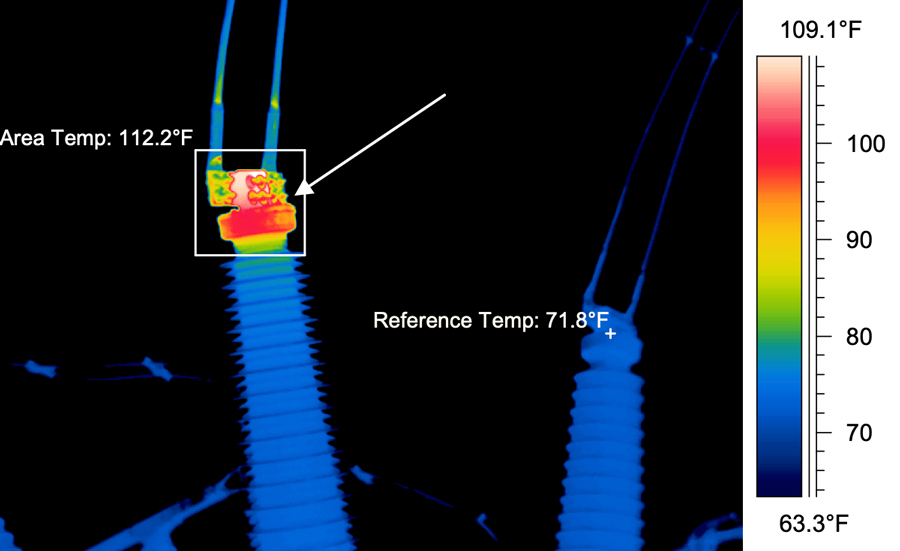
It is not unusual for inspectors to identify from 10 to 15 hot spots per inspection, with larger utilities often having 3 to 4 times this number. Typical locations of hot spots include distribution switches, which typically can account for about half of all registered during an inspection. Switches tend to have the most hot spots mainly because they are a moving part. Another common area for hot spots are bushings, generally due to loose or dirty connections.
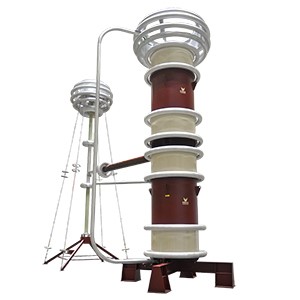
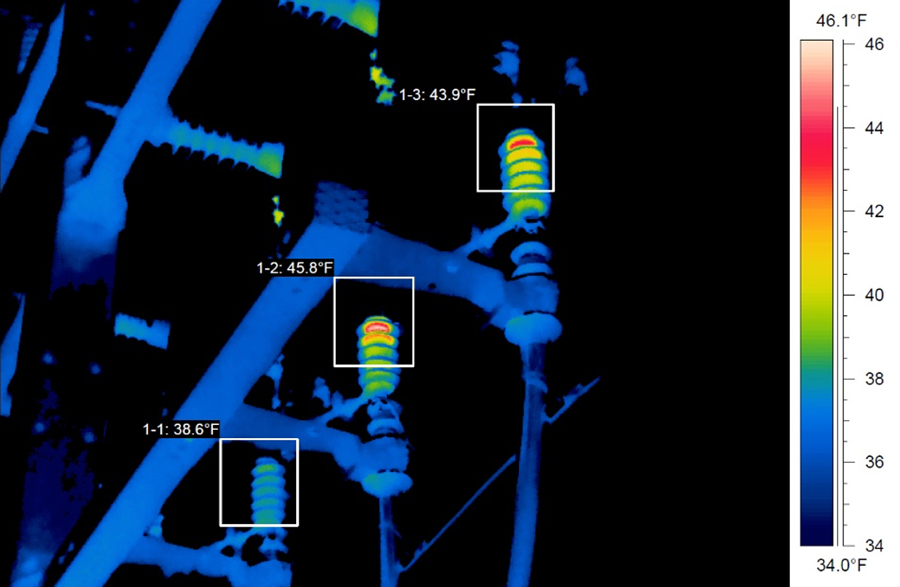
Thermal imaging can be particularly useful when it comes to assessing condition of surge arresters. This is because they normally dissipate only little energy during steady state operation and therefore seldom exhibit a temperature much above ambient. Even some of the largest MOV arresters (e.g. up to 4 or 5 m in height) dissipate less than 50 watts and therefore do not create any discernable rise in temperature. This makes the effort to measure temperature gradients that much more challenging.
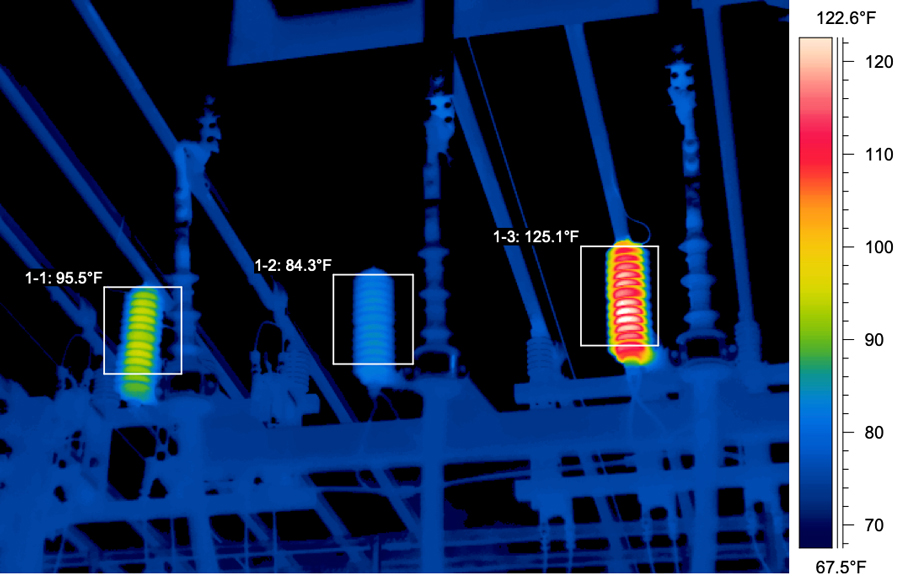
Experience has shown that better assessment of arrester temperature can be achieved in an environment without sunlight, allowing even less than a degree difference from ambient to be more easily observed. It is a step-by-step process such that, if an arrester displays even a slight difference from similar nearby units, it is placed on a watch list. If the arrester displays a difference of from 4 to 6°C, then it is marked to be re-checked in a few weeks. If the temperature gradient is greater than 7-10°C, the arrester is placed on an emergency change-out list.

This approach is common among many utilities. One point that is certain is that seldom does any surge arrester become 15°C hotter in comparison to nearby units. Once temperature starts to rise that much, leakage currents will also increase which in turn causes even faster heating. That means it will likely not survive much longer. Partial discharge does not itself generate enough of a heat signature to be detectable with thermal imaging.
There are several benefits to applying thermal imaging to arresters, starting with speed of data collection. Indeed, experts claim that there is no faster way to tell if an arrester is near end-of-life than a scan of its temperature. Accuracy from a distance is also excellent, especially with a long-range lens. The risk that an arrester is in the process of failing without also generating heat is low. At the same time, if an arrester has been damaged by lightning strike or switching surge only days after its last thermal scan, it may well fail before the next scheduled scan.
The potential for failure between successive scans is among the only drawbacks to thermal imaging of arresters. Another is that most IR devices currently used in the marketplace cannot transmit data remotely. As such, obtaining a thermal profile for an arrester typically requires someone to go on-site, often at night, and collect data. In spite of this, thermal imaging remains one of best options to monitor the health of an energized surge arrester.
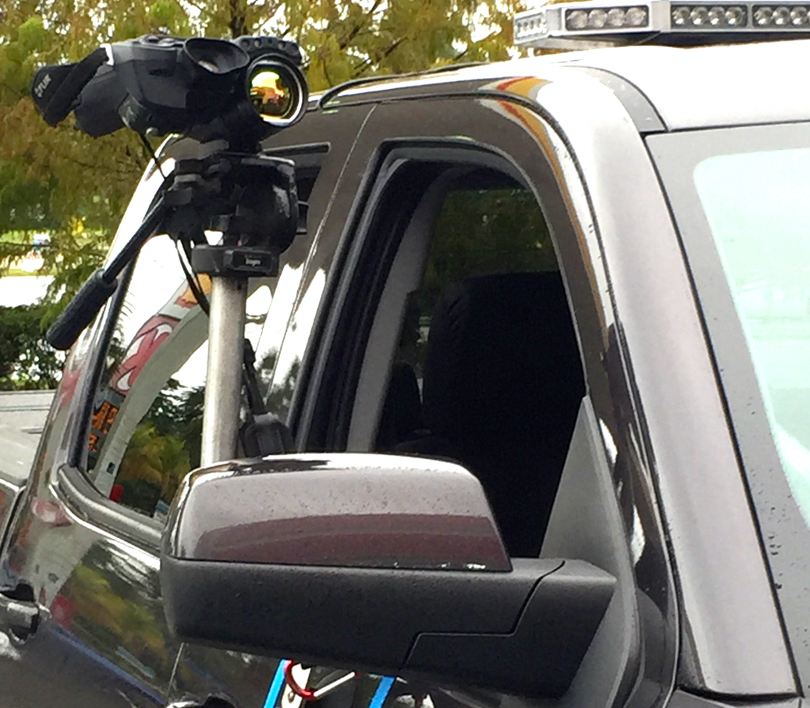
Apart from substations, thermal imaging can also be applied efficiently to overhead lines. While much of the power industry is looking to increased application of fly-by techniques to monitor lines, driving a line route at around 20 mph (30 km/h) is sometimes preferable where possible – especially in the case of distribution lines. One of the advantages is that accuracy of measurements tends to be greater from the ground. The sky is the perfect cool background compared to the alternative of looking down from a helicopter to what could be numerous other heat sources on the ground.
One example of a situation where thermal imaging has proven valuable in assessing maintenance requirements involved a 500 kV line in southern China that had experienced brittle fracture of one of its composite I-string insulators. There was concern that this failure might be a precursor of a broader problem relating to unsuitable corona ring design for these insulators. A program was therefore instituted to inspect the entire population of line insulators to determine if the problem was widespread or just isolated to one unit which may have been defective or improperly installed. A total of more than 600 strings were examined over the course of the following months as part of a systematic inspection using a hand held infrared camera. The process revealed that 85 strings were ‘running hot’, i.e. had abnormally high temperatures near their live ends versus ambient.

To gather more data on the extent of the problem, ‘hot’ insulators were removed and separated into five categories, based on their elevated temperature gradient: 1-3°C; 3-5°C; 5-7°C; 7-10°C; and greater than 10°C. Each insulator was tagged with detailed information, including specific tower, phase sequence, location either to right or left side, etc. A total of 20 insulators, i.e. 4 units from each of these 5 categories were then sent for testing to study possible causes of overheating.
On the advice of experts, a maintenance program was established to monitor temperature profiles of all the line’s insulators. According to these experts as well as the Technical Guide for infrared diagnostics of live high voltage equipment (DL/T 664-2008), any string whose maximum temperature was found to exceed ambient by at least 5°C would be replaced, in most but not all cases by a double string. In the end, several dozen strings were replaced with insulators from a different supplier having the same basic shed geometry and creepage but featuring a different design of corona ring. While the original insulators were equipped with rings having a concave lower surface, rings on replacement insulators had convex upper and lower surfaces.