More than 40% of transmission line outages in Japan (defined there as tripping of a breaker to eliminate flashover across insulator strings) are caused by lightning and referred to as lightning outages. As a result, the past 30 years have seen widespread application of transmission line surge arresters, mostly with no mechanical cutout.
This edited contribution to INMR by Toru Miki at the Central Research Institute of Electric Power Industry (CRIEPI) in cooperation with experts at Chubu Electric Power, reports on trends in lightning outages in Japan since 1980 and discusses the impact of applying EGLAs.


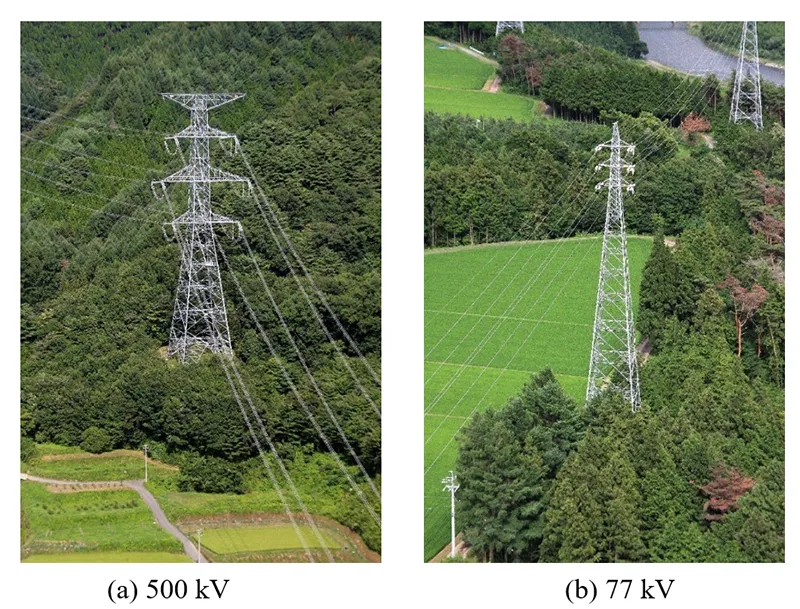
There are a range of voltage classes for the overhead lines in Japan: 1000 kV, 500 kV, 275 kV, 220 kV, 187 kV, 154 kV, 110 kV, 66 kV, 77 kV, 33 kV, and 22 kV. Fig. 1 depicts the lengths of lines for each, where voltage class represents operating voltage.

Transmission lines with voltages greater than or equal to 187 kV are used for bulk power transfer. These lines have a direct earth system and 90% are double circuit, having more than one ground wire. Transmission lines of less than 187 kV are used basically as subsystems. Many have a resistive earth system or non-earth system and most are equipped with ground wires, except for some with voltage less than 66 kV.

Outage Rate & Fault Rate
Lightning outage rate is defined here as number of lightning outages of transmission lines over a line length of 100 km during a year. A double circuit fault means the tripping of circuit breakers of both circuits on a double circuit transmission line. Double circuit fault rate is defined as number of trips of both transmission line circuits over a line length of 100 km per year.
Transmission Line Lightning Outages
Fig. 3 shows the yearly variation in lightning outage rate for all voltage classes over the period 1980 to 2020. Lightning outage rates for 66-77 kV lines are similar to those of lines less than 66 kV. As can be seen, annual variation in lightning outage rates falls and rises with a periodicity of 2 to 6 years. Moreover, the difference between maximum and minimum lightning outage rates is large.
In the case of voltage classes less than 187 kV, maximum difference in lightning outage rate over these years is more than 4 cases/year every 100 km. For voltage classes greater than or equal to 187 kV, maximum difference in lightning outage rate across the years is only about 1 case /year for every 100 km.

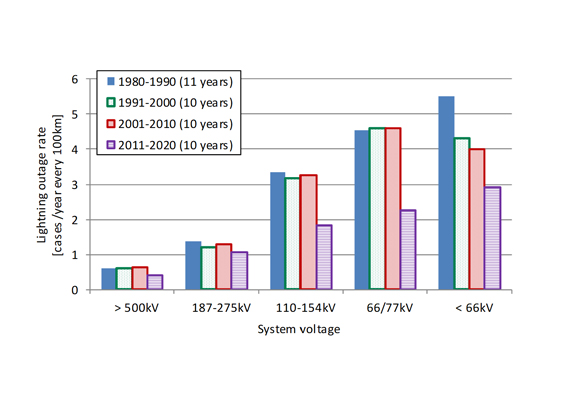
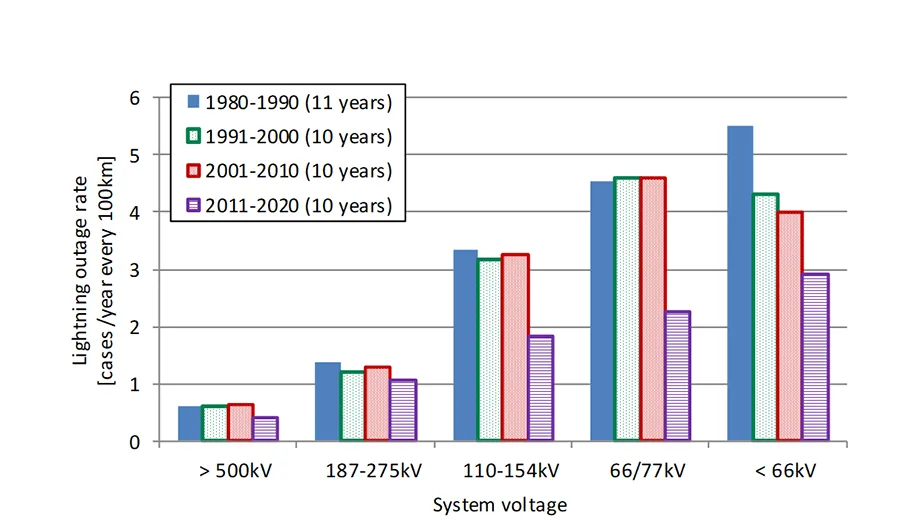
Fig. 4 shows periodic average lightning outage rate, i.e. average lightning outage rate over intervals of almost 10 years, and therefore indicates long-term trends. Variations of this average during the periods 1980-1990 (11 years), 1991-2000, 2001-2010 and 2001-2020 are less than about 1.1-1.4 cases/year every 100 km for lines greater than or equal to 187 kV. Variations are small compared with yearly variation in lightning outage rates. This suggests that there have been only minor long-term trends in lightning outage rate.
On the other hand, variation of the averages between the periods 1980-1990 (11 years), 1991-2000, 2001-2010 and 2001-2020 for voltage classes less than or equal to 154 kV varies about 2 to 5 cases/year every 100 km. This is significant compared against yearly variation in lightning outage rate and suggests that lightning outage rate for transmission lines less than or equal to 154 kV has decreased over the long term.

Circuit Faults Caused by Lightning Strikes: Features of Ground Faults
Fig. 5 shows the percentages of different numbers and positions of ground fault phases on transmission lines. On lines greater than or equal to 187 kV, 80% of ground faults caused by lightning strikes occurred on one phase. Moreover, the percentage that occurred at the middle phase is highest among the three phases. The proportion that occurred on the upper phase is slightly less than that for the middle phase. Upper and middle phases accounted for more than 80% of total ground faults.

Lightning Flashes & Lightning Outage Rate
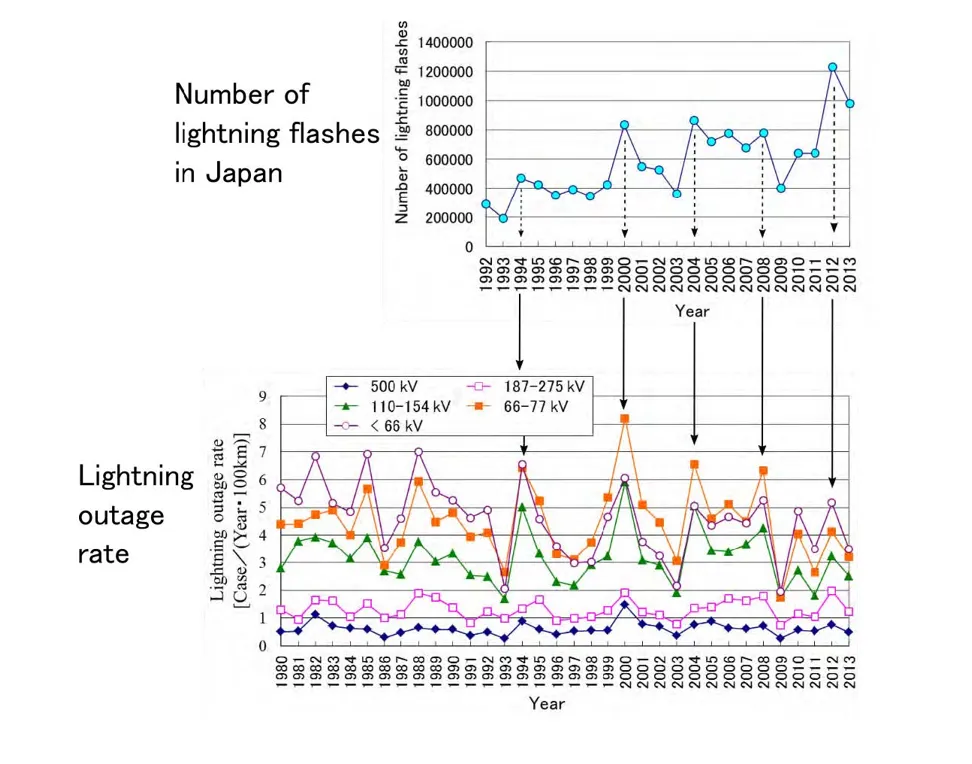
Fig. 6 provides the yearly variation in number of lightning flashes in Japan and shows that this varies with a periodicity of 2 to 6 years with a long-term trend of increase, likely due to improvements in instruments used to measure lightning flashes.
As also shown, periodicity of yearly variation of lightning outage rates is similar to that of number of lightning flashes. Years with peaks in the yearly variation of lightning outage rates coincide with those in the yearly variation of number of lightning flashes. This suggests that the periodicity of yearly variation in lightning outage rates is due to number of lightning flashes. The correlation coefficient between lightning outage rate and number of lightning flashes is about 0.3-0.6. The weak correlation is caused by the instruments used to measure number of the lightning flashes.
For transmission lines less than 187 kV, periodic variation in double circuit fault rates coincides with lightning outage rate and is likely caused by variation in number of lightning flashes.

Effect of Transmission Line Surge Arresters on Lightning Outage Rate
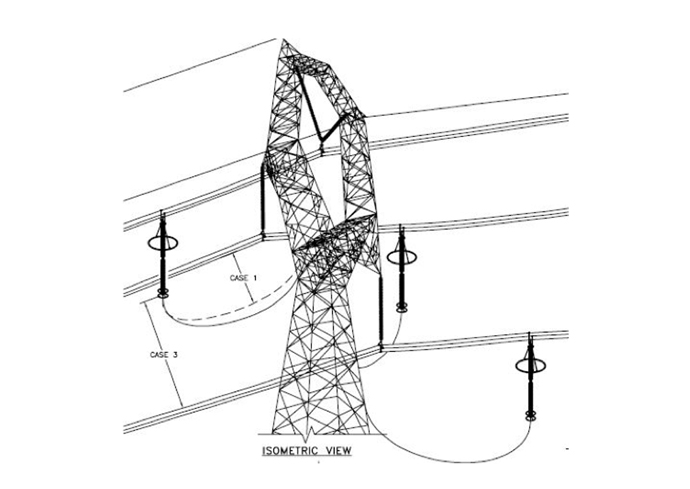
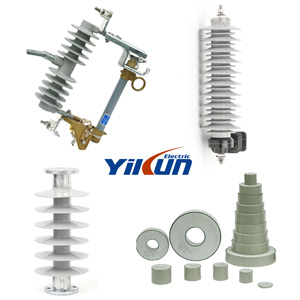
Fig. 7 shows the various LSAs typically applied in Japan, which use metal-oxide (MO) varistors and are referred to as metal-oxide surge arresters. These prevent tripping of circuit breakers owing to the non-linear resistance of their MO varistors.
Fig. 7a shows a unit with external gap while Fig. 7b is an arcing horn with metal-oxide surge arrester – a compact type design. Fig. 7c shows a fault current interrupting arcing horn (FCIAH) which, while not a surge arrester, interrupts fault current to prevent tripping of circuit breakers before system protection relays sense the earthing.

The aim of applying these devices is:
1. Installation LSAs on a single circuit side avoids double circuit faults on a double circuit transmission line and in the worst case allows only a single circuit fault.
2. Installation of LSAs on both circuits eliminates any lightning outage unless there is arrester failure due to excessively large current or large transfer charge from lightning.
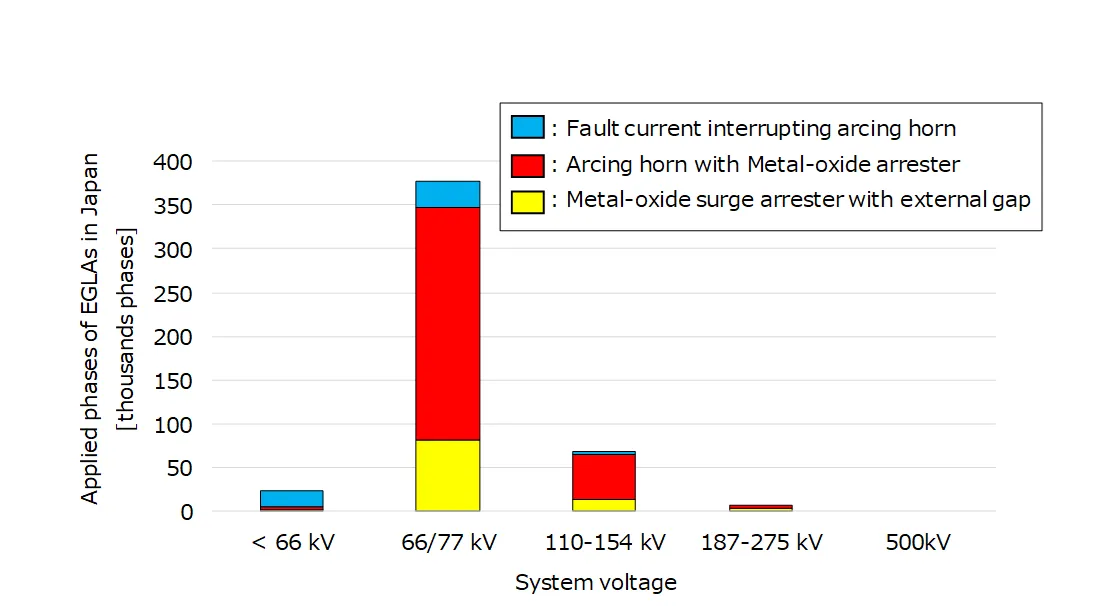
Fig. 8 shows yearly variation in the cumulative number of LSAs installed on Japanese transmission lines for all voltage classes. Fig. 9 depicts number of LSAs for each voltage class of line and shows that most are installed on 66-77 kV lines. Total number of metal-oxide surge arresters installed increased significantly from 2000 on.

Comparing cumulative number of LSAs with the long-term trend in double circuit fault rates for transmission lines less than 187 kV is difficult because of periodic variation in double circuit fault rates. Therefore, the moving average for 9-years (i.e. before/after 4 years) has been used to remove impact of periodic variations.
Fig. 10 illustrates the 9-year moving average for double circuit fault rates as well as cumulative number of LSAs, grouped by operating voltage class. As can be seen, the moving average of the double circuit fault rate on 66-77 kV transmission lines decreased with increasing cumulative number of MO surge arresters or fault current interrupting arcing horns. It is noteworthy that cumulative number of LSAs increased significantly after 2003 while double circuit fault rate on 66-77 kV transmission lines decreased rapidly from then on.
Fig. 10 also shows that double circuit fault rate for 110-154 kV transmission lines also decreased starting about 2005 while that for less than 66 kV transmission lines decreased relatively slightly (compared to on 66-77 kV and 110-154 kV transmission lines). Correlation between cumulative number of LSAs installed on transmission lines and double circuit fault rate was estimated for each voltage class: 110-154 kV; 66-77 kV; and less than 66 kV, respectively.
The correlation coefficients were -0.97 for 110-154 kV, -0.99 for 66-77 kV and -0.90 for lines less than 66 kV, which indicates strong correlation for each voltage class. The moving average of double circuit fault rate correlates with cumulative number of LSAs, and it can therefore be inferred that the long-term trends in double circuit fault rates on transmission lines of 110-154 kV, 66-77 kV and less than 66 kV are a direct result of installing LSAs.


Conclusions
Data was collected since 1980 on lightning outages affecting transmission lines from TSOs across Japan. The above discussion presented data on lightning outage rates and double circuit fault rates. Moreover, data on lightning flashes and LSAs was compared with data on lightning outages and double circuit faults on transmission lines. These comparisons showed the following:
1. Lightning outage rates vary with a periodicity of 2 to 6 years. The periodicity of double circuit fault rates on transmission lines of less than 187 kV coincides with that of lightning outage rate, likely due to periodic variation in number of lightning flashes. The double circuit fault rates on transmission lines of greater than or equal to 187 kV vary with a periodicity of 2 to 3 years.
2. Although there is no proof to confirm the long-term trend in double circuit fault rates for each line, there is a long-term negative trend in double circuit fault rate on transmission lines of 66-77 kV, 110-154 kV and less than 66 kV. It can be inferred that this is due to the effect of installing LSAs.
3. For transmission lines greater than or equal to 187 kV, 80% of ground faults occurred on one phase in the circuit and 80% of one-phase ground faults occurred at the upper or middle phases.

References
[1] Study committee on lightning risk, Subcommittee for transmission lines, “Guide to lightning protection design for transmission lines (revised in 2022)” (CRIEPI: Grid Innovation Research Laboratory Report No. GD21026, 2023). (in Japanese)
[2] Study committee on lightning risk, Subcommittee for transmission lines, “Application guide for transmission line surge arresters” (CRIEPI: Electric Power Engineering Research Laboratory Report No. H07, 2012). (in Japanese)
[3] T. Shindo, H. Motoyama, T. Miki, M. Saito, A. Matsueda, N. Honma, A. Matsumoto, K. Shinjo, K. Hayashi, H. Amazu, K. Makabe, M. Fujikawa, S. Kurihara, and M. Sato, “Lightning occurrence data observed with lightning location systems of electric power companies in Japan: 2009-2013” (Asia Electromagnetic Conference (ASIAEM 2015), No. 45, Jeju, 2015, 8).
[4] T. Chino, M. Iwata, S. Imoto, M. Nakayama, H. Sakamoto, and R. Matsushita, “Development of arcing horn device for interrupting ground fault current of 77 kV overhead lines” (IEEE Transactions on Power Delivery, Vol. 20, No. 4, 2005, pages 2570-2575).
[5] T. Ohtaka, M. Iwata, F. Minoura, N. Tsukiyama, K. Kamimura, “Development of arcing horns interrupting fault current for overhead transmission line”, (Proceedings on 4th IEEJ-EIT Joint symposium on advanced technology in power and energy system, 2009, pages 151-156).
[6] T. Ohtaka, M. Iwata, S. Tanaka, Y. Goda, “Development of an EMTP simulation model of arcing horns interrupting fault current”, (IEEE Transactions on Power Delivery, Vol.12, No.3, 2010, pages 2017-2024).
[7] T. Ohtaka, M. Iwata, H. Misaka, H. Awazu, E. Nishikawa, T. Nakanishi, K. Kamimura, M. Uehara, “Development of Low-Cost High-Strength Fault Current Interrupting Arcing Horns For 77 kV Overhead Transmission Lines (Part 2) – Development of Demonstration Device – “, (CRIEPI: Electric Power Engineering Research Laboratory Report No. H17001, 2018). (in Japanese)