This edited contribution to INMR by Massimo Marzinotto of Terna in Italy and T&D Expert, Alberto Pigini, reports on work currently underway by a joint WG of CIGRE A3, B2 and B4, managed by C4. Started in 2024 and comprised of 50 experts from more than 20 countries, the WG aims to complete its task by 2026-2027. Apart from a survey across the various countries represented, this work also relied on experience collected from other countries as well as a range of relevant published information.

Contamination is a dominant factor when it comes to dimensioning outdoor insulators, especially in medium/heavy polluted environments for AC and, in general, for all polluted environments in DC. Uncertainty on site contamination severity therefore hampers proper insulator selection and design.
Countries that face the need to create contamination maps are proceeding using different approaches. These include traditional methods of direct contamination measurements on insulators as well as indirect contamination measurements (e.g. directional dust deposit gauges), monitoring leakage current or modelling salt and dust movements in combination with meteorological and satellite data.
These methods, with special focus on new approaches using a combination of measurement and inference through specific numerical models, are now under consideration by CIGRE WG N° C4/A3/B2/B4.75 towards a ‘Guide to procedures for the creation of contamination maps required for outdoor insulation coordination’.
The main aims are:
• To review available methodology adopted to define pollution severity of each site, if possible, unequivocally, to arrive at national pollution mapping;
• To analyse how best to translate site pollution severity to insulators of different geometrical characteristics and materials;
• To offer general guidelines to allow pollution maps to be created across different countries.
Even as this work is proceeding, below is preliminary information on progress to date.
Generalizations Concerning Insulator Pollution
The way pollution collects on insulators is a complex process since there are three forces that determine deposition of airborne particles onto insulator surfaces:
• Aerodynamic forces due to air movement (wind action);
• Gravitational forces from the mass of particles;
• Forces due to electrical fields surrounding insulators.
The most prevalent of these forces will depend on specific environmental characteristic of the site as well as on type of energization (not energized, AC or DC energized). In addition, pollution accumulation will also depend on:
• Insulator geometric characteristics (e.g. line insulators of different type, station insulators of different type and diameter);
• Insulator material (e.g. ceramic versus polymeric);
• Insulator configuration (e.g. “I” position, “V” position, “H” horizontal position) as well as height.
It is not deemed feasible to create pollution maps for each different type of insulator, material, profile, height, type of energization (AC or DC), etc. As a result, the proposal is to:
• develop a pollution map that best describes Site Pollution Severity (SPS) with reference to the selected insulator (possibly only one insulator type and characteristic: in the following, non-energized standard cap & pin insulator);
• translate this site pollution map to expected pollution severity for different insulator conditions using suitable correction factors.
Site Pollution Severity (SPS) & Pollution Map Assessment
SPS is defined as the maximum pollution severity recorded over some appropriate period. Since pollution severity will depend on insulator type and condition, a clear definition of site assessment assumes the following reference conditions to define SPS:
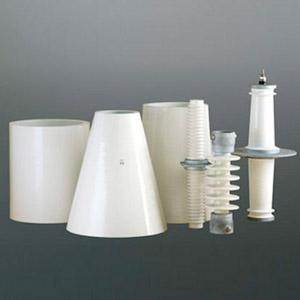
• Selected reference insulator. To obtain a consistent reference pollution map, it is assumed that pollution severity of a site corresponds to the contamination severity applicable to a standard cap and pin insulator U120B or U160B (according to IEC 60305);
• Non-energized insulators;
• Insulators in vertical position.

Estimating Maximum Pollution Severity of a Site
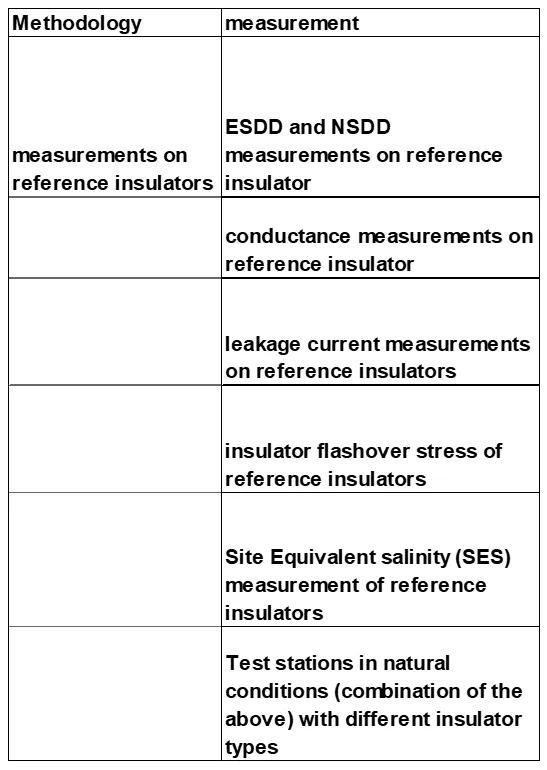
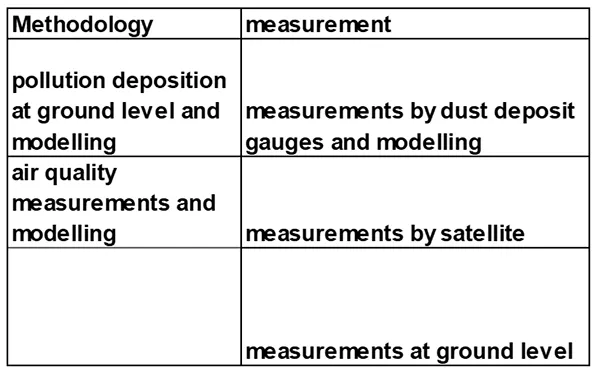
The methodologies to determine SPS can be subdivided into the following main categories:
• measurements on selected reference insulators;
• measurements of environmental pollution, by measuring pollution severity at ground level as well as air quality;
• review of field experience;
• qualitative assessment.
Tables 1, 2 and 3 offer a detailed summary of the methodologies available these days.

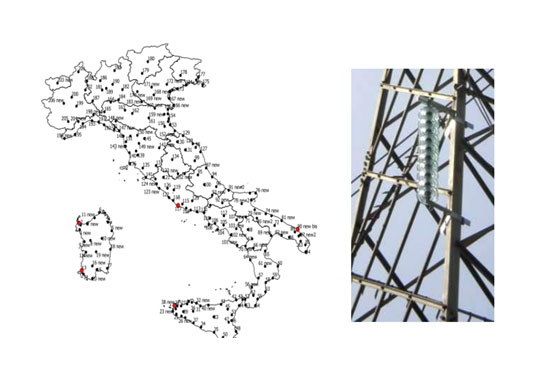
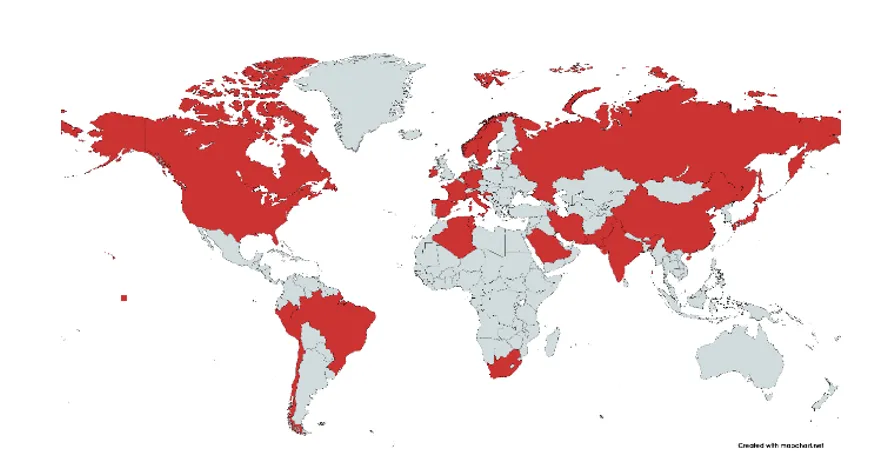
The advantages, disadvantages and limits of these approaches are under discussion within the WG. Fig. 2 reports on the methodologies adopted up to now based on reviewing the practices in the countries shown in Fig. 1.
According to Fig. 2, the most used methodologies to arrive at pollution mapping are presently based on qualitative mapping, jointly with reference to environmental data and service experience. Most countries represented improved their maps through systematic measurements of NSDD and ESDD.
New methodologies to assess site pollution severity through ground and air pollution data, followed by modelling are now being proposed. As an example, satellite measurement of air quality is being used to evaluate site pollution severity (as shown in Fig. 3). Nonetheless, these latest methodologies have to be refined and their applicability to the different environments, such as marine environments, needs to be verified.
The role and perspectives of new technologies are still being debated within the WG, considering their limitations (e.g. modelling still needs to be refined) and advantages. One example is modelling supported by artificial intelligence, which offers cost reduction versus traditional mapping based on measurements).
At the same time new technologies can support traditional mapping based on direct measurements, as for example in countries where specific measurements on insulators are not available everywhere. In such cases, numerical techniques can infer pollution severity in those areas not covered by measurements. Moreover, new technologies can help to infer expected changes in pollution severity over time due to evolution of environmental conditions linked to climate change.
As shown in Fig. 2, pollution maps generally cover only AC applications. Presently, DC maps are only available in 2 countries.

Estimate of Maximum Pollution Severity, SPS
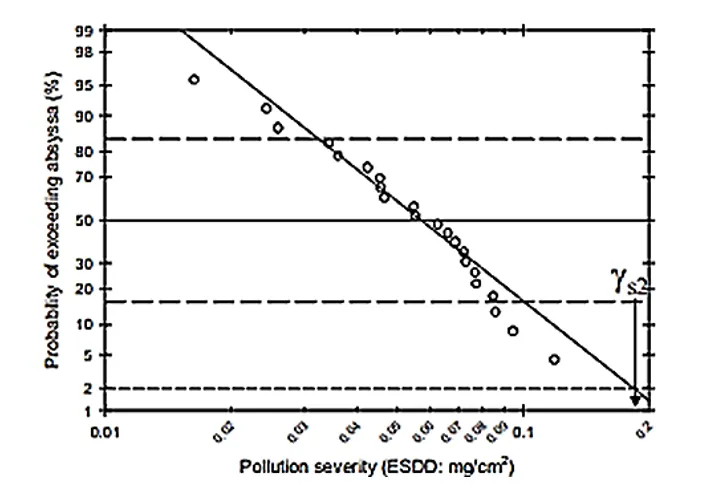
One aspect that needs to be pointed out is the need to develop statistical information on site severity to arrive at a correct estimate of maximum expected pollution severity (generally assumed to be the value having a probability of 2% to be exceeded). This is necessary to allow statistical evaluation of flashover probability. To reach this target, any measurement campaign must be long enough to collect sufficient data for a robust inference of the best fit statistical distribution.
As example, in desert environments campaign durations from 2 to 3 years may be necessary (see Fig. 4). In general, campaign duration depends on specific environment. In addition, to determine the SPS statistical distribution (see example in Fig. 5) measurements must be repeated at intervals frequent enough to find the maximum levels between periods of natural washing. If natural washing is infrequent (monthly or longer), sampling intervals may suffice to obtain information on accumulation as a function of time. On the other hand, if contamination builds up rapidly, a shorter sampling period should be adopted.
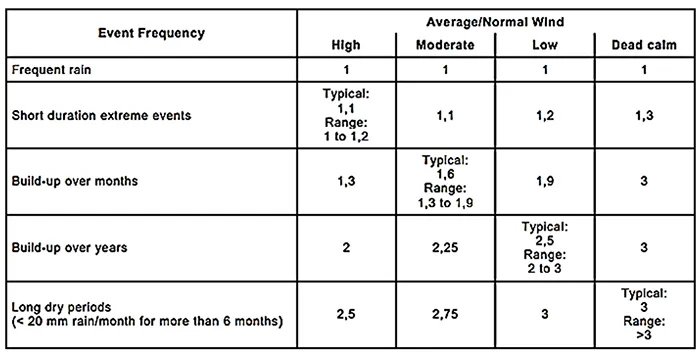
Actual Pollution Severity Should Consider Wetting Conditions
Pollution accumulation does not itself define pollution severity of an area in terms of risk of insulator flashover. There can be no flashover without some efficient humidification of the pollution layer, i.e. a critical amount of water is required on an insulator surface to produce the minimum flashover voltage.
The most severe condition requires sufficient quantity and time duration of wetting to dissolve most of the conductive contaminants without dripping. Larger amounts of water can wash the insulator while preventing formation of dry bands. Critical wetting conditions are therefore most common during fog or light, misty rain.
A severity classification could be made considering the total number of days in the year with:
• Rain;
• Fog;
• Snow;
• High relative humidity (above 80%);
• Dew formation, related to temperature change;
• Sudden wetting impingement brought by wind (as typical of marine environments).
Need to Renew Contamination Map Due to Environmental & Climatic Changes
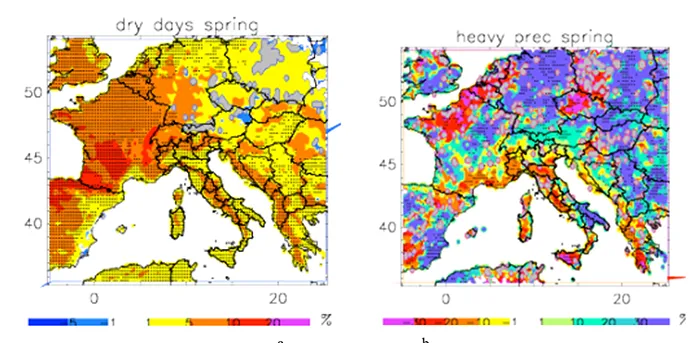
Seasonal 2050 projections forecast an increase in temperature. As an example (see Fig. 6), in the Mediterranean region the estimated increase across all seasons will be at least 1-1.5°C, with the largest increase in summer (about 2-2.5°C). Number of dry days (precipitation values less than 1mm/d) is also expected to increase, mostly during summer.
Heavy precipitation events (i.e., precipitation greater than 20 mm/day) are expected to increase by 30%. Intense localized storms, with strong winds, are also expected to increase. Thus, climate change will have a great impact on pollution accumulation if such projections are eventually confirmed.
Changes in how territory is developed as well as industrial changes will also influence insulator pollution severity. For example, the evolution of iron and steel plants around the city of Milan has been remarkable if reference is made to changes between 1980, 2000 and 2018.
Given the above, reviewing pollution mapping every 10 years may be necessary. In this respect, combining air pollution severity with numerical modelling of dust movements could offer help.

Translation of Site Pollution Severity SPS to Estimate Actual Pollution Severity of Different Insulator Types & Conditions
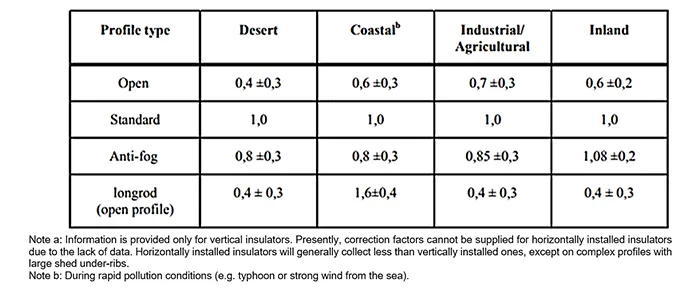
As stated, it is neither practical nor feasible to create pollution maps covering all possible insulator conditions. Site pollution severity, SPS, once unequivocally determined, has to be translated to insulators that are different from that used for pollution mapping to reflect energization condition, insulator type, material, profile, position and height of installation. This can be done by relying on suitable correction factors.
This aspect is still under development within the WG. However, some indications, still being developed, are given below:
1. Severity Dependence on Type of Energization: AC versus DC
SPS, as defined, is assessed by measurements conducted on non-energized insulators. The main difference between accumulation on energized and non- energized insulators results from the impact of electric field on the contamination deposition process. In windy areas, such as near the sea, wind forces dominate pollution deposition and pollution severity expected on non-energized and energized insulators is similar. On the other hand, in areas characterized by low wind conditions, electric forces can have a substantial contribution.
The influence of energization for AC insulators is in all cases quite limited, e.g. a ratio of 1.1 to 1.5 between ESDD of energized and non-energized insulators is proposed in the Chinese Standard. Energization has higher impact on the insulator contamination for DC, as reported in Table 4. This table considers only environmental conditions. Other factors are however to be considered as well, for example, influence of level of applied voltage, with higher accumulations expected with higher values of electric field and impact of local corona phenomena on accumulation rate.
2. Dependence of Insulator Pollution Severity on Insulator Type
SPS has been estimated based on measurements on standard cap and pin insulators. But actual pollution severity of line insulators under AC voltage can range from 40 to 160% of the site pollution severity estimated with reference to standard cap and pin insulators, depending on insulator characteristics and type of environment (see Table 5).
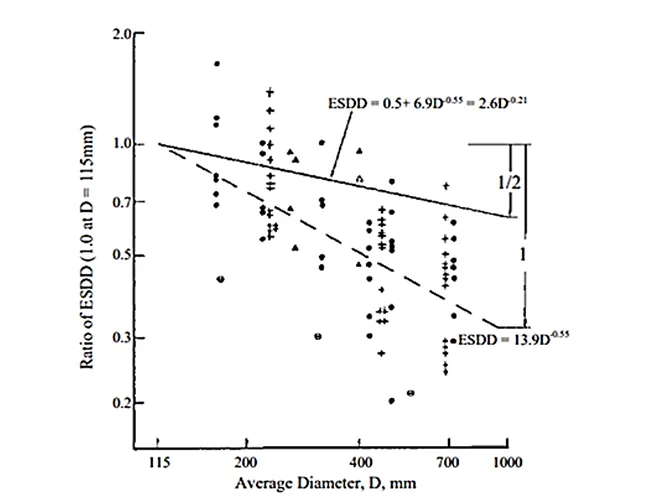
For station insulators, the main influencing variable is diameter. Fig. 7 shows results of measurements of ESDD on a series of cylindrical insulators having different diameters exposed under de-energized conditions to typical coastal contamination. Field experience indicates that – for cylindrical insulators – the larger the diameter of an insulator, the smaller the ESDD level it accumulates over a given time compared to that on the bottom surface of a 250 mm suspension insulator.

3. Dependence of Insulator Pollution Severity on Insulator Orientation & Height of Installation
The following effects of mounting arrangement on pollution accumulation is proposed for insulators exposed for long periods and subjected to both pollution accumulation and cleaning by rain:
• Tension insulators (horizontal configuration)
Tension insulators collect less contamination than vertical insulators from easier washing during rain events. Salt deposit densities measured on disc insulators in a strain string were found about 50% in value compared with insulators in an I suspension string in the same environment.
• V Strings
Salt deposit densities on suspension V insulators were found to be about 80% compared with values recorded on suspension I insulators in the same environment.
The above findings are considered valid for the environmental conditions typical of the sites where these measurements were performed. For other locations where contamination can accumulate rapidly, or where frequency of natural cleaning by rainfall is low, influence of orientation may prove significantly different.
Moreover, influence of installation height must also be analyzed. For example, different pollution severities can be expected for medium voltage lines versus transmission lines having by different heights.
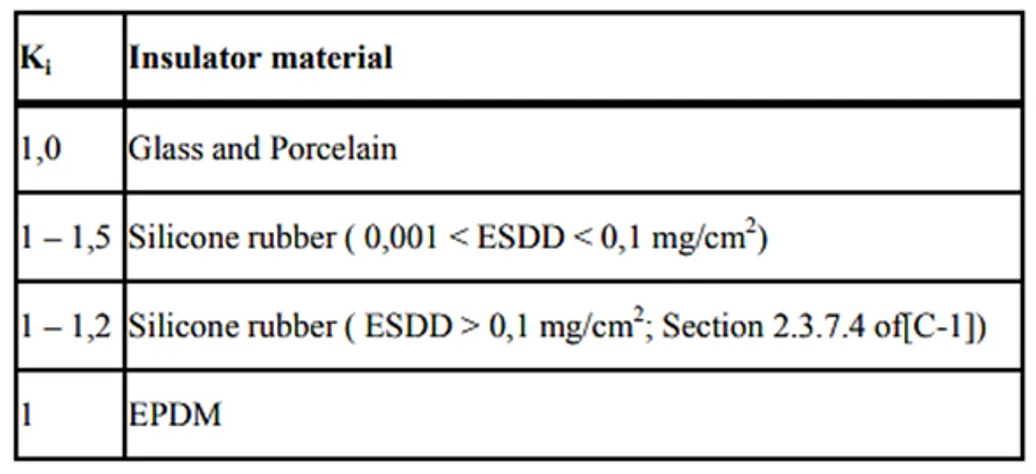
4. Dependence of Insulator Pollution Severity on Insulator Material
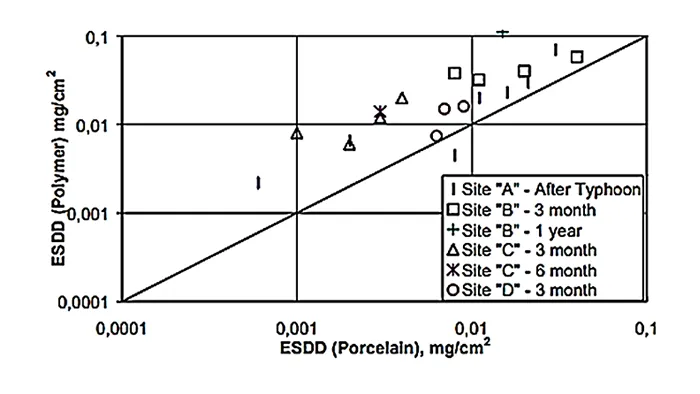
Pollution accumulation depends on insulator material, as indicated by measurements on polymeric and porcelain insulators at both inland and coastal sites, as reported in Fig. 10. Table 6 reports on the ratio between accumulation on a polymeric versus a porcelain insulator, with higher values for lower degrees of contamination.
Such results must be interpreted with caution since silicone rubber insulators encapsulate pollutants on their surface thanks to migration of hydrophobic silicone oils from the bulk to the surface. A portion of contaminants is therefore not available to dissolve when the insulator is naturally wetted. By contrast, when an ESDD measurement is performed, the hydrophobicity encapsulation is broken down, and all the salts are included in the measurement. This will lead to an overestimate of contamination severity on the insulator.
Guidelines for Nationwide Pollution Mapping
Based on the above, the final output of the WG will be Guidelines for pollution severity mapping.
Suggestions for Future Work
The scope of the present WG is to deal with assessment of pollution severity. This is one of the most important pieces of information needed to allow optimized insulator design. Once pollution severity is established, there remains the need to optimize evaluation of insulation strength at this pollution level. Thus, a new WG, or continuation of the present WG with an enlarged task, is recommended to analyze the following:
• Dependence of pollution performance on insulator geometrical characteristics (e.g. diameter, creepage factor, degree of hydrophobicity);
• Optimization of pollution class ranges for AC and definition of pollution classes for DC;
• Representativeness of available pollution test methods for non-HTM insulators and transfer of laboratory test results to insulator design under pollution, supported by a statistical approach. This would assist comparing test results to actual expected line and substation insulator performance.
• Limitations of short-term pollution tests for HTM insulators, with need to relate design mainly to service performance data, possibly supported by long term ageing tests.
Such additional work will be a useful input for future revisions of IEC 60815 and, in particular, for the next revision of Part 4, dedicated to DC.
References
[1] IEC TS 60815-1, “Selection and dimensioning of high-voltage insulators intended for use in polluted conditions – Part 1: Definitions, information and general principles,” 2008.
[2] W_A.Chisolm, C.Ahlholm e I.Gutman, «Dust & Sea Salt Pollution Mapping: Satellite versus Ground Truth Results,» INMR World Congress 2019.
[3] M.Akbar and F.Zedan, “Performance of hv transmission line insulators in desert conditions part iii. pollution measurements at a coastal site in the eastern region of Saudi Arabia,” IEEE Transactions on Power Delivery, Vol. 6, No. 1, January 1991.
[4] CIGRE WG C4.303, “Outdoor insulation in polluted conditions: guidelines for selection and dimensioning. Part 1: general priciples and the AC case,” CIGRE Brochure 361, 2008.
[5] M. de_Nigris, «Impact of Environmental Constraints on Electrical System Development & on Insulation Trends,» in INMR World Congress, 2021.
[6] M.de¬Nigri, A.Balzarini, E.Ciapessoni, G.Pirovano e G.Pirovano, «Impact of Insulator Pollution on Resilience of Power Networks: Experience in Italy,» in INMR Congress, 2022.
[7] Chinese Standard DL/T 374.1, «Drawing method of pollutant distribution map for electric power system-Part 1: a.c. systems,,» 2019.
[8] IEC TS 60815-4, “Selection and dimensioning of high-voltage insulators intended for use in polluted conditions.Part 4: Insulators for d.c. systems,” 2016.
[9] D. Wu e Z. Su, «The Correction Factor between DC and AC Pollution levels: Review and Proposal,» in |0th International Symposium on High Voltage Engineering August 25 – 28, 1997 MontrealL, Qebec, Canada.
[10] R. Matsuoka, S. Ito, S. Sakaishi and K. Naito, “Flashover on contaminated insulators with different diameters,,” IEEE Trans. on Electrical Insulation, Vols. EI-26, no. 6, 1991.
[11] I.Kimoto, K.Kito e T.Takatori, «Anti pollution design criteria for line and station insulators,» IEEE Transactions on Power Apparatus and Systems ( Volume: PAS-91, Issue: 1, January 1972).
[12] S. Zhiyi, L. Xidong, Yin.Yu, Z. Jun, L. Wufeng and L. Peng, “Outdoor Insulation Selection Method of HVDC Lines,” Proceeding of the 14th ISH, August 25-29, 2005, paper D-18.
[13] N. Hyltén-Cavallius, S. Annestrand, H. Witt e V. Madzarevic:, «Insulation Requirements, corona losses, and corona radio interference for high-voltage d-c lines”,» IEEE Trans. on Power Apparatus and Systems, Vol PAS-83, 1964, pp.500-508 .
[14] Imagawa, R.Matsuoka, K.Sakanishi, K. Kondo, N.Okada e T.Yonezawa, «Comparative Contamination Degrees on porcelain and silicone rubber insulator in fields,» in Cigré colloquium SC 33-97, Toronto Ontario, 1997.