Over the past 30 years, numerous devices with different technologies have been introduced for the purpose of assessing the condition of surge arresters in service. At present, monitoring leakage current is the prevalent method to verify condition of arresters and more important to estimate their remaining life expectancy. However, certain effects on arrester leakage current can lead to measurement errors, incorrect interpretation of data and possibly unnecessary replacement or even sudden breakdown. Utilizing leakage current for surge arrester monitoring can also create confusion since diverse leakage current behavior phenomena must first be understood.
This edited past contribution to INMR by Philipp Raschke of Tridelta Meidensha in Germany offered insight into the different effects on surge arrester leakage current. The goal was to help interpretation of measurements and improve decision-making when it comes to arrester maintenance. The information presented was based on direct experience with a state-of-the-art surge arrester monitoring system that had been evaluated in the laboratory as well as during extensive field tests across countries with different HV systems, climates and environmental conditions.

To build an adequate knowledge base for users of surge arrester monitoring devices, an investigation was conducted of different effects on arrester leakage current that might lead to misunderstanding the data being measured. Temperature and grid related influences such as harmonics in the system voltage play only a minor role since existing methods compensate roughly for these. By contrast, weather and pollution can influence arrester current by adding surface currents and hence introduce possible errors to the values being measured.
Humidity ingress and progressive degradation of MOV blocks are the most common reasons for surge arrester failure and ideally need to be detected early on. Proper understanding of measured leakage current values, preferably available as periodically logged long-term data, is the best way to allow early recognition of impending failure and therefore to make the decision to replace an arrester. Given this, below is an explanation of the most common examples of leakage current behavior and its relation to various practical operating scenarios. Side effects and their impact on measurements are also discussed and recommendations given for proper condition assessment of surge arresters.

Peak Current, Capacitive Current & Resistive Current: The ‘Agony’ of Choice
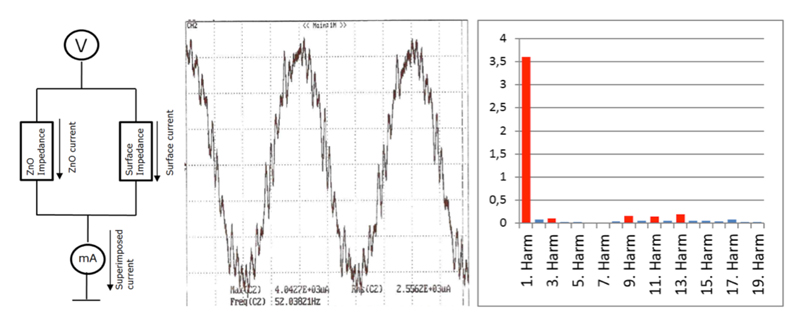
Due to the molecular structure of zinc oxide, MO surge arresters have a complex impedance that consists of a resistive as well as a capacitive component. Under AC voltage, this results in two superimposed currents: one is a sinusoidal capacitive current phase shifted -90° to the voltage signal; the other is a resistive current that is in phase with the voltage and not sinusoidal but rather shaped as a periodic pulse signal (see Fig. 1).
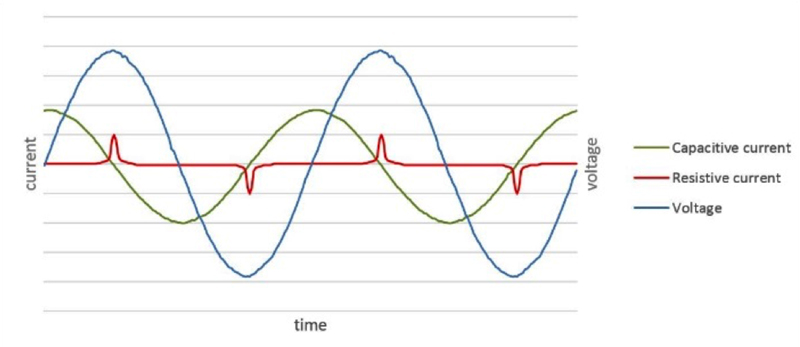
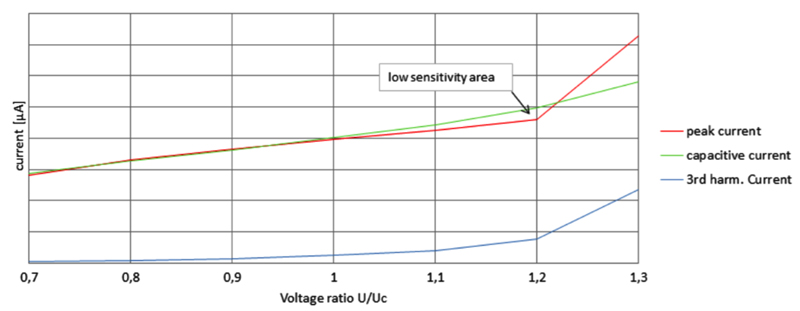
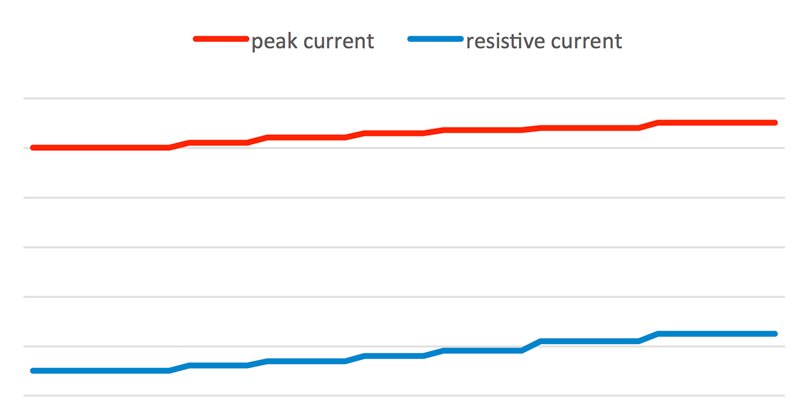
Capacitive and resistive currents are superimposed to a total leakage current in which two important values can be determined – peak current and 3rd harmonic current, e.g. at 150 Hz (see Fig. 2).
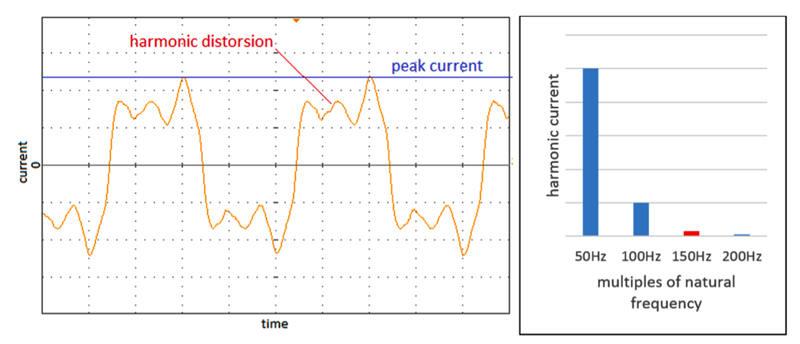
The peak value of arrester current is always orientated on the dominant component, i.e. whether capacitive or resistive current. At low voltages (e.g. about <Uc), peak current orients itself on the peak value of the capacitive component. At higher voltage stresses, primarily in a range above Ur (rated voltage), peak current orients itself on the peak value of the resistive compo-nent. Between these two ranges, peak current is influenced by harmonic distortion due to the growing resistive component and shows low sensitivity to changes in voltage or, more correctly, to changes in the arrester’s V-I characteristic (see Fig. 3). This qualifies peak current as a reliable indicator of pure capacitive or resistive currents but not for mixed current components.

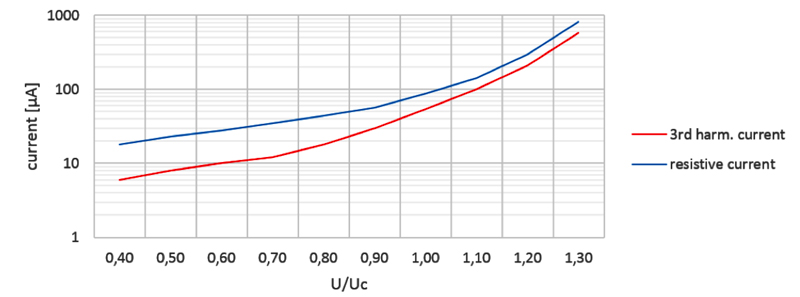
The capacitive current represents the current flowing through the arrester’s series capacitance. It behaves proportionally to changes in voltage and consequently does not show significant sensitivity in the non-linear area of the arrester’s V-I characteristic. Resistive current offers a better representative value of arrester condition due to its high sensitivity and logarithmic growth over the entire leakage current area of the V-I curve. Metrologically, resistive current is often based on the third harmonic content of the leakage current, which is extracted from the leakage current spectrum using a Fourier Transformation algorithm (see Fig. 4).
Surge Arrester Monitoring: Test Laboratory & Field Experience
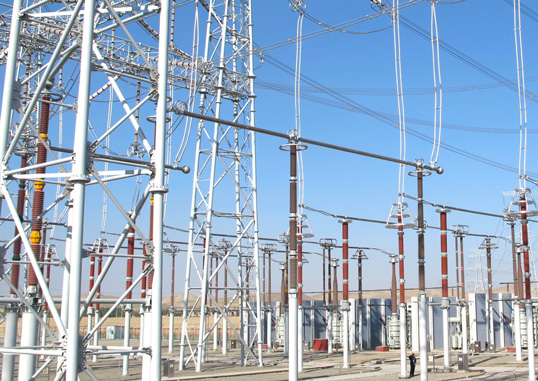
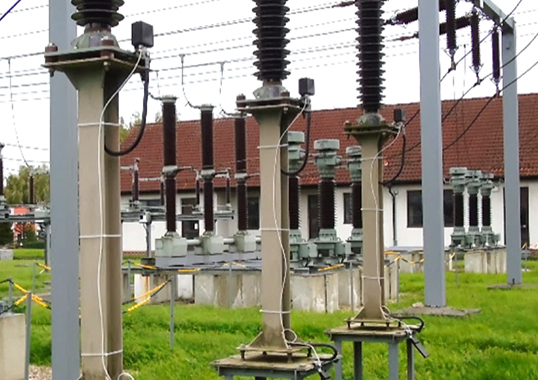
An extensive test program was carried out as part of the development of a new surge arrester monitoring system. An integral part of this program consisted of a field test of the behavior of the monitoring system under real conditions. Thirty devices were installed in countries across the globe to perform this test under a variety of harsh environmental conditions (see Fig. 5).
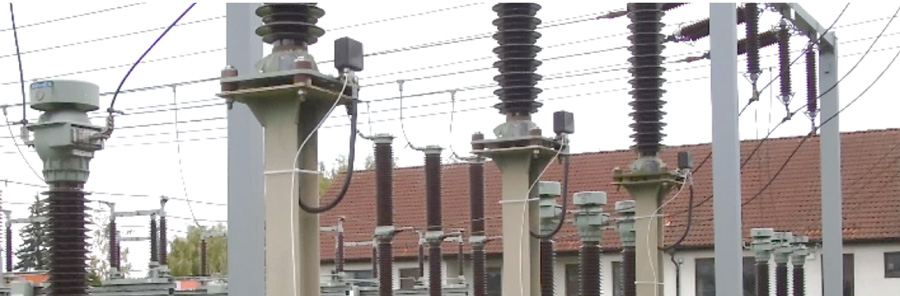
During that time, diverse effects on behavior of surge arrester leakage current in the field were observed and proper functioning of monitoring devices could be demonstrated. The findings presented below are based on experience with the new monitoring system from this field test as well as from Tridelta Meidesnha’s own HV test laboratory.
Temperature Influence & Compensation
Temperature is an important factor in leakage current measurement because ZnO varistors are semi-conductors and their resistance is highly temperature dependent. Consequently, ambient temperature influences resistive leakage current of an arrester (see Fig. 6). Since operators of substations are not interested in external effects on leakage current but rather only in effects that come from the arrester itself, influence of ambient temperature on resistive leakage current needs to be compensated for.
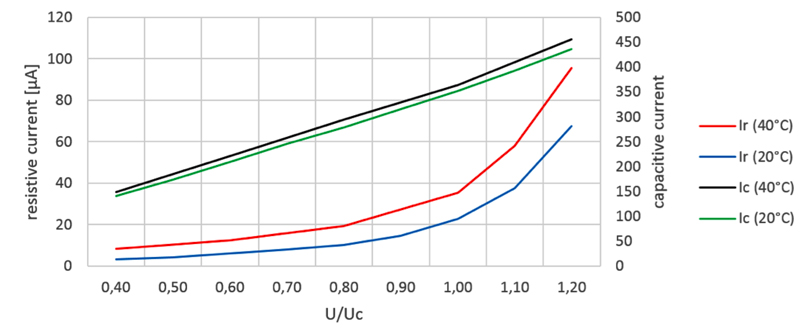
Fig. 6 shows the difference between the resistive and capacitive current characteristics of a ZnO varistor at 20°C and 40°C. From 20°C to 40°C, resistive current rises by a factor of 2.0 at a U/Uc ratio of 0.40 but only by 1.4 when U/Uc is 1.20. Capacitive current, by comparison, varies only slightly. In fact, influence of temperature on resistive current is non-linear depending on voltage ratio. It should be noted that this example is based on one specific varistor type. Other brands and diameters might yield different values.
Usually, impact on resistive leakage current from ambient temperature is compensated for by measuring ambient temperature and multiplying the measured raw value with a correction factor based on a temperature compensation model. While temperature models could also differ by specific varistor, this can be approximated for all varistor types or roughly linearized for one specific ratio, U/Uc, to simplify the compensation procedure.
However there is another influence on the temperature compensation algorithm that arises from the temperature measurement itself. Usually, the temperature sensor is built inside the monitoring device and the measured temperature differs from ambient temperature due to the temperature constant of the monitoring device and how long it takes until the ambient temperature has been conducted to the temperature sensor. The temperature constant of the monitoring device and surge arrester should be roughly the same in order to replicate the same temperature impact on both. Furthermore, the influence on the temperature sensor and on the varistor will be mismatched due to differences in the capability of the arrester housing and shell of the monitoring device to reflect sunlight. Varying sunlight radiation angles and partial shading will influence temperature calculations. These factors lead to an effect that has been observed on surge arresters in the field, called over-compensation, where a compensation value is subtracted that is larger than the nominal temperature deviation. Finally, with rising ambient temperature, the resistive leakage current neither rises nor stays stable. Rather, it drops. This leads to a ripple in resistive leakage current due to night and daytime temperature fluctuations, as outlined in Fig. 7.
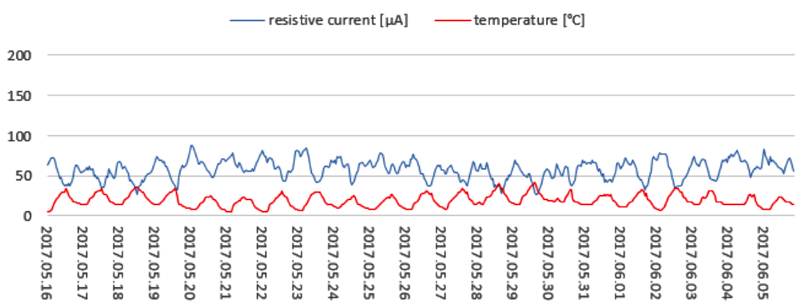
This problem can be handled by optimizing the temperature compensation model and, most effectively, by measuring at night, mainly to eliminate impact of sunlight.

Humidity & Rain Effects
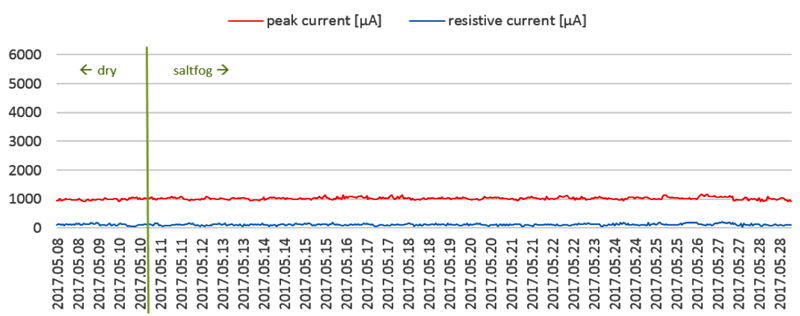
Since high voltage surge arresters are usually installed outdoors, they are affected by rain, humidity and fog. The long-term field test investigated differences in how moistening of an insulator takes place. Effects from light rain on leakage current were never recognized. High peak currents, e.g. on May 2nd and 19th, correlated directly with very heavy rain and a storm, which was confirmed by meteorological data. Unstable peak values over the period between May 2nd and 19th were determined to be related to continuous, steady rain, heavy fog and high humidity (see Fig. 8).
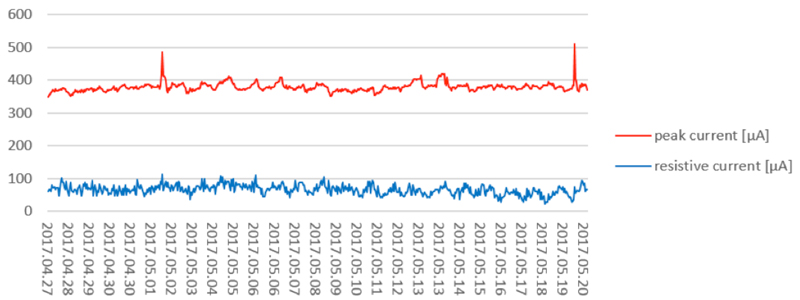
These high peak current values always fell back to their nominal value under dry conditions. Resistive current was only marginally influenced.
Polluted Arresters
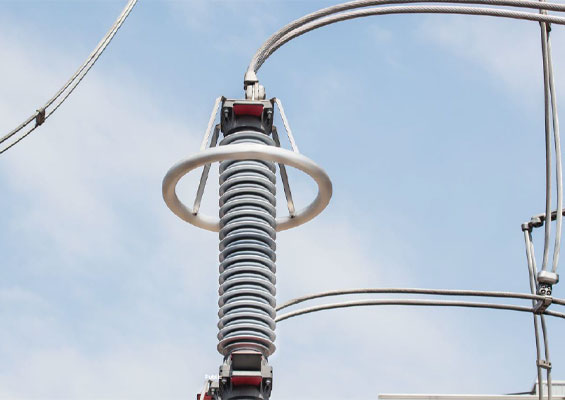
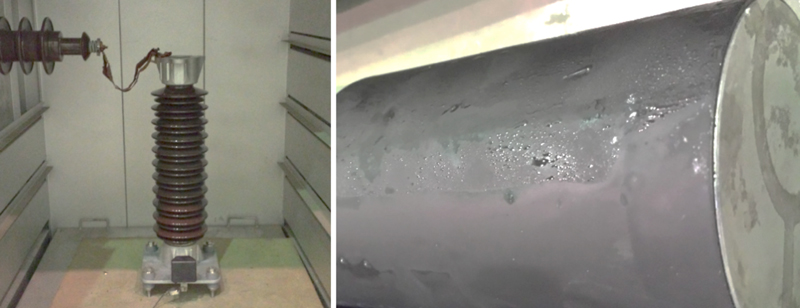
In heavily polluted areas such as deserts, industrial parks and coastal areas, exposed surge arresters often show deposits of conductive sediments on their housings after a certain time. A weather test was performed simulating growing pollution on an arrester housing to gain experience on the impact of surface current on measured leakage current values under these conditions. A porcelain-housed and a silicone housed arrester, both with identical electrical design and equal creepage distance, were used to assess differences between these two housing technologies (see Fig. 9).
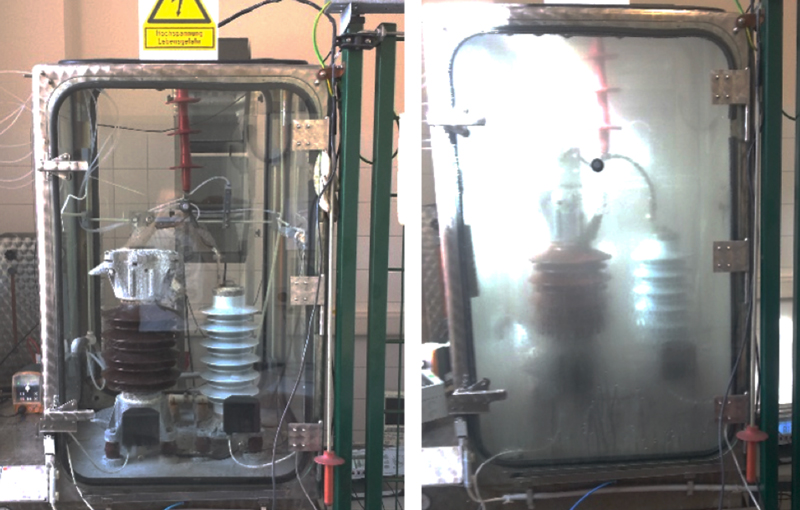
The test comprised a procedure, similar to ambient conditions in coastal desert climate with salt fog as well as humidity in the morning followed by hot and dry ambient conditions. The first stage of the test was carried out under voltage with dry air and no salt fog or heat. This was required to analyze arrester leakage current with no influence of surface current so as to create a benchmark for comparing results with surface pollution. Under these dry conditions, peak current was 1000 µA and resistive current was 130 µA for both porcelain and silicone-housed arresters in this set-up.
After switching on salt fog spray and heating in the climate chamber, peak current started to rise. After switching off the salt fog, peak current fell back to a level lower than the maximum value but still higher than the benchmark current. This same behavior was repeated on every daily cycle, with gradual rise in daily maximum value as well as in the subsequent nominal value to which the peak current fell when salt fog was switched off and the housing dried. Such behavior was due to continuous growth of a pollution layer with high salinity and humidity during exposure to salt fog (see Fig. 10).
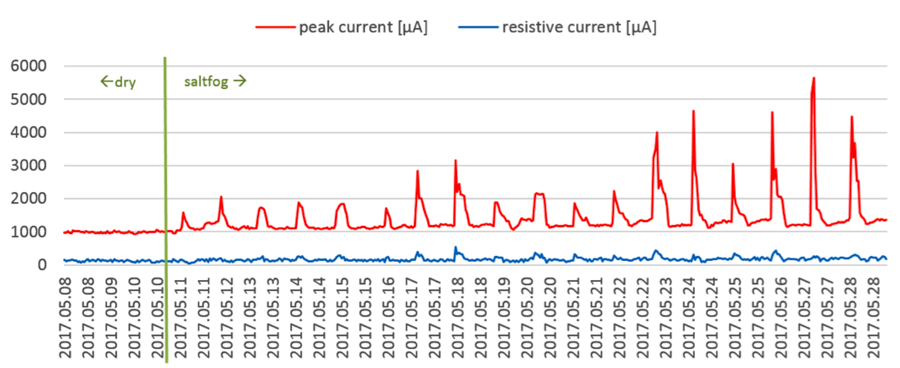
In particular, wetted salt layers have high conductivity and thus the prevailing capacitive current is superimposed by very high sinusoidal currents that are in phase with the voltage. The nominal value rises and the dried off surface pollution layer remains partially conductive. Conductivity of the pollution layer rises with the cross-section of the salt layer. Resistive current is only marginally affected since the total current is approximately sinusoidal and primarily contains a predominant 1st harmonic, a small 3rd harmonic from the ZnO current and high frequency distortion (see Fig. 11).
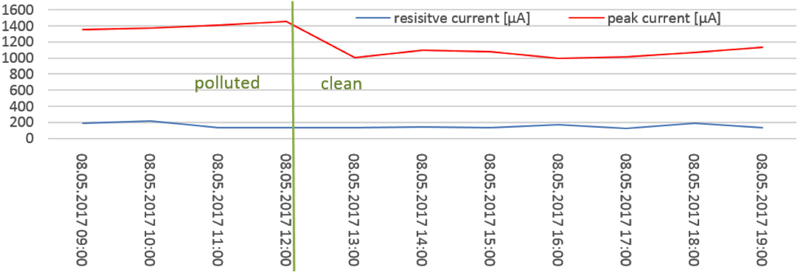
In contrast to these obvious effects of the pollution layer on current of a porcelain-housed arrester, the silicone-housed arrester did not show any changes in peak current or in resistive current (see Fig. 12).
This significant difference is due to the hydrophobic properties of silicone. Porcelain always shows a Hydrophobicity Class of 6 (i.e. 90% wetted areas) and therefore carries continuous surface currents. By contrast, a good quality silicone housing ranges between HC 1 (discrete droplets) and HC 3 (flat discrete droplets). Even in the latter case, there is still no interconnection between droplets and no formation of current across the arrester surface. Cleaning polluted arresters eliminates surface currents and brings the leakage current back to its normal value (see Fig. 13).
Detecting Humidity Ingress
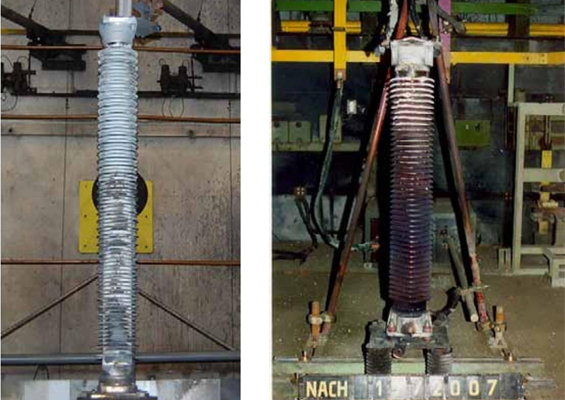
Humidity ingress is the main reason for arrester breakdown in the field and there is great benefit when a surge arrester monitoring system is able to detect it. A laboratory test was conducted to investigate the impact of moisture inside the surge arrester on the arrester leakage current. Four centiliters of water were intentionally poured inside an arrester. Voltage was then switched to the arrester and leakage current was recorded for several hours. In the next step, the surge arrester was installed inside an oven and kept under voltage and ambient temperature of 40°C to accelerate distribution of humidity in the arrester core (see Fig. 14).
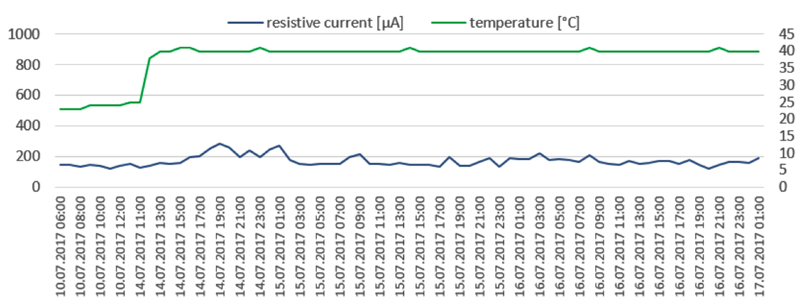
During the test at room temperature, peak current remained at its nominal value of circa 1000 µA while resistive current maintained a value of circa 140 µA. Heating the arrester to 40°C caused the water to evaporate. After 5 hours at 40°C, the entire arrester was at this temperature and water was distributed all along the varistor stack. Peak current rose to more than 14 mA and started fluctuating due to the repeated drying/re-moistening of the varistor stack (see Fig. 15). A lesser impact was observed on resistive current due to the low 3rd harmonic content of the surface current (as illustrated in Fig. 16).
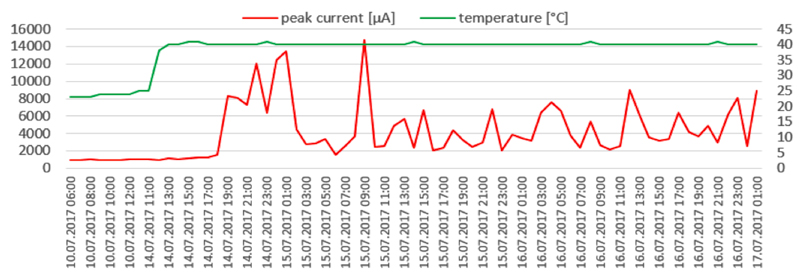
To summarize, humidity ingress can easily be determined since it results in extremely high and fluctuating peak currents yet only small changes in resistive current inside the arrester.

Identifying Degraded MOVs
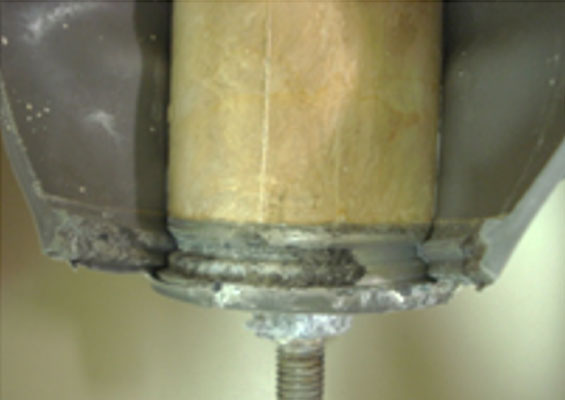
The second most common malfunction of surge arresters is due to damaged or degraded varistors. Defective MOV blocks generally show lower reference voltages, higher reactive-power losses and thus higher resistive and capacitive currents. The malfunction of only one MOV block inside a high voltage surge arrester results in only small changes in resistive and capacitive leakage current but increases the voltage stress to all other blocks. Subsequently, there is accelerated ageing of these other blocks which can then lead to increased leakage current. To simulate this behavior and to test how leakage current behaves in such cases, a test was performed on an arrester with defective MOV blocks (previously overloaded in charge transfer tests). To achieve this, sound MOV blocks in the arrester were exchanged for defective blocks in 4 stages and leakage current was recorded (see Table 1).
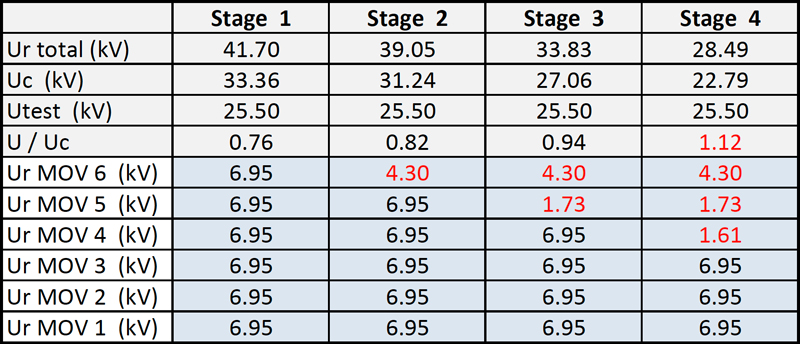
Stage 1 represents a healthy arrester with 6 MOV blocks. The peak current remained stable at 1000 µA and the resistive current at 30 µA. In stage 2 one block was exchanged for a slightly damaged block to simulate minor MOV damage. The peak current was still representative of capacitive current and proportional to the increase in voltage stress. Resistive current changed only slightly. Stage 3 consisted of an exchange of another sound MOV block for a heavily damaged one. This led to a significant drop in reference voltage and consequently a greater rise in peak current. In correlation to this, the power dissipation rose and the resistive current grew to over 500% of its nominal value. This was because the voltage ratio at this stage corresponded to the operation of a surge arrester near to Uc, where the current-voltage characteristic becomes highly non-linear. Current still remained roughly stable at these values.
Stage 4 was comprised of the exchange of another varistor to produce a situation in which the voltage stress of each varistor was higher than permitted by the arrester’s continuous operating voltage. The power dissipation in the arrester generated a large amount of heat, which the arrester housing was incapable of conducting to the ambient air. Resistive and peak current values continued rising steadily and the arrester was already undergoing thermal runaway. Resistive leakage current was now almost 900% of its nominal value and peak current at 500% (see Figs. 17 & 18).
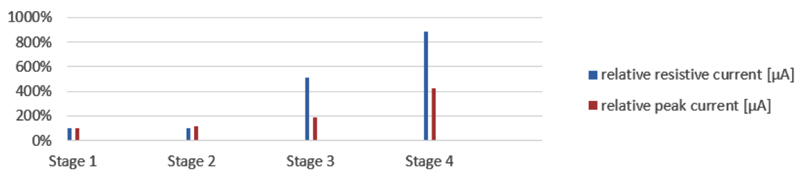
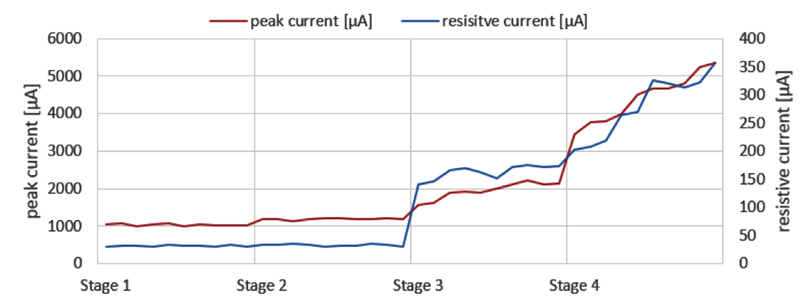
This scenario shows the behavior of a slowly degrading ZnO stack, eventually leading to thermal runaway, assuming that such damage is not detected in time. Resistive leakage current is highly sensitive to damage to the ZnO varistor and clearly represents power dissipation and, as such, arrester health. ZnO degradation is the only condition that significantly and permanently increases resistive current.

Recommendations for Correct Analysis of Arresters
Experience gained from the above research is summarized below as Guidelines for better interpreting leakage current measurements. Given case assumptions will probably look different in the field but the following recommendations and examples will assist decision-making in regard to arrester maintenance:
• Observing trends in leakage current is highly important in properly assessing arrester health and more useful than comparing absolute values with some suspected maximum current threshold;
• Maintenance decisions may prove incorrect if different symptoms of a problem occur at the same time;
• If re-occurring, transient or cyclic leakage current effects (such as from arrester pollution) should be monitored, ideally with a short data logging interval (<1 day);
• When measuring with a logging frequency of 1 day or more, it is recommended to measure at night so as to eliminate influence of sunlight;
• If the situation is still not clear, the arrester manufacturer should be contacted and/or the arrester inspected.
Case 1:
Sudden spike in peak current, later falling back to nominal value, with no influence on resistive current (see Fig. 19).
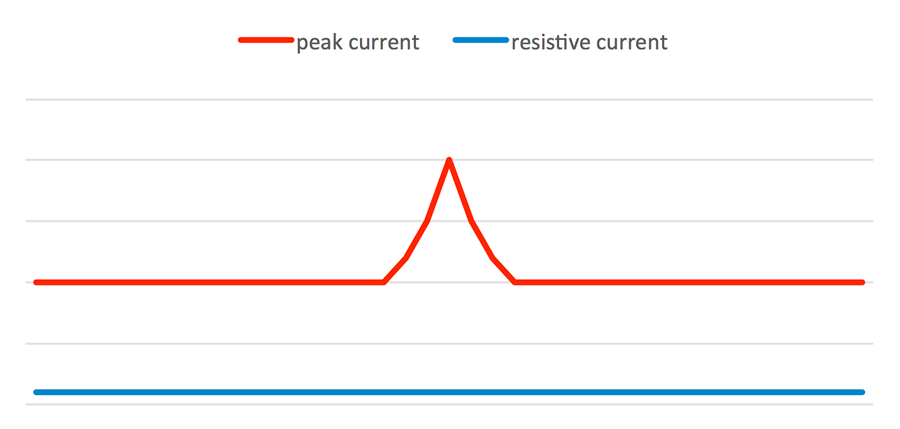
Arrester is OK! The surge arrester could be affected by rain. Check the past weather forecast for the area where the arrester is situated. If no rain was recorded, the arrester may be affected by humidity, fog, dew and/or pollution. Check the arrester housing for surface pollution, if the effect re-occurs.
Case 2:
Periodic spikes and fall backs to nominal value of peak current, continuous rise in nominal value, small influence on resistive current (see Fig. 20).
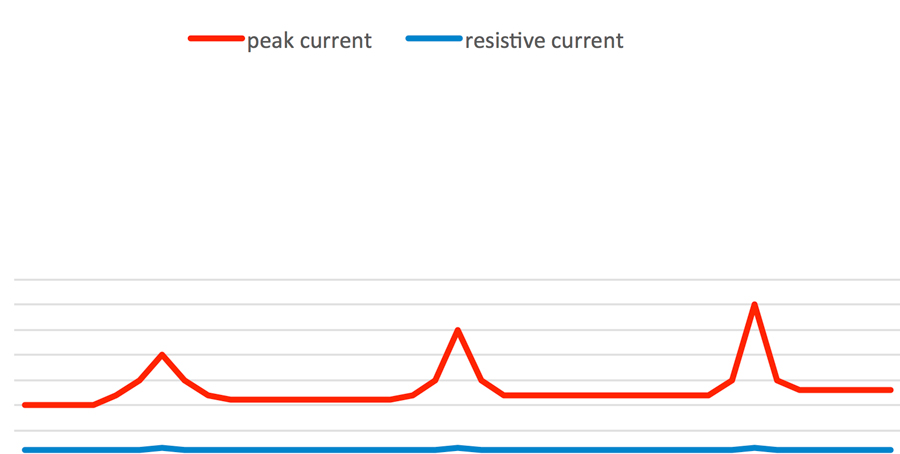
The surge arrester housing is probably polluted with salt, dirt, chemicals, etc. Check the housing for surface pollution and if necessary clean the arrester to prevent tracking and erosion or flashover. The leakage current then drops to nominal value after cleaning. Arrester is OK!
Case 3:
Very high fluctuating peak currents, low changes in resistive current, no pollution detected on arrester surface (see Fig. 21)
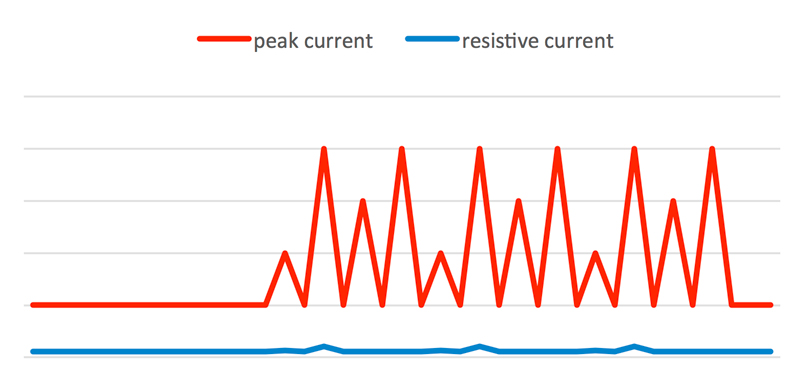
Arrester is not OK! The arrester might be compromised by humidity ingress. Check the arrester for surface pollution and clean it, if necessary. If the current still does not stop fluctuating after cleaning, replace the arrester immediately to prevent dangerous arrester breakdown.
Case 4:
Continuously rising values of resistive leakage current and capacitive leakage current, no pollution or humidity detected. (see Fig. 22)
Arrester is not OK! The arrester may contain degrading MOV blocks. Check the arrester more frequently. Consult the arrester manufacturer. Replace the arrester pre-emptively before resistive current reaches the given maximum threshold.

Literature
[1] IEC 60099-5. “Surge arresters – Part 5: Selection and application recommendations”, Annex D, VDE, 2013.
[2] V. Hinrichsen, „Monitoring of High Voltage Metal Oxide Surge Arresters“, in: VI Jornadas Internacionales de Auslamiento Eléctrico Bilbao, Paper 6.4, 1997.
[3] J. Lundquist, „New method for measurement of the resistive leakage currents of metal-oxide surge arresters in service” , IEEE, 1989.
[4] F. Tighilt, „Voltage Distribution on ZnO Polymeric Arrester Under Pollution Conditions” , UPEC, 2010.
[5] STRI, „Guide1, 92/1 Hydrophobicity Classification Guide“.
[6] Z. Abdul-Malek, „A review of Modeling Ageing Behavior and Condition Monitoring of Zinc Oxide Surge Arrester” , IEEE Studend Conference on Research and Development, 2015.