Composite insulator housings have become a standard solution implemented on power grids worldwide and indeed are the preferred choice for application in heavily polluted service environments. To ensure performance under such conditions, a variety of design tests are performed, including: IEC 60587 – Inclined plane test; IEC 61462 (§7.3.2) / IEC 62217 (§9.3.2) – Accelerated weathering test; IEC 61462 (§7.3.3) / IEC 62217 (§9.3.3) – Tracking and erosion test at different shed profiles and dimensions; and IEC 62217 (2005-10) First edition – 5000 hours multiple stress test.
This edited past contribution to INMR by experts at Reinhausen Power Composites and Siemens Energy in Germany discussed pollution testing on insulators, specifically artificial pollution tests under DC stress as well as long-term outdoor tests under AC stress.
Insulator design depends on pollution level as well as on diameter, shed profile, material and creepage distance. Other important considerations include avoiding rain bridging, preventing localized short circuit between sheds, promoting self-cleaning, avoiding pollution ‘traps’ and controlling local electric field stress. Recommendations for shed profile of AC composite insulators are summarized in IEC TS 60815-3 and in IEC TS 60815-4 for DC composite insulators in uncontrolled environments. Compared to porcelain, the hydrophobic properties of silicone housings result in superior pollution performance, meaning lower creepage distance required. Moreover, in the case of large dimensioned units, composite insulators can save up to 40% of total weight versus porcelain. Also, the manufacturing process for composite insulators allows for bigger dimensions with a single piece, whereas porcelain insulator sections are usually limited in size in order to fit into most high-temperature kilns. Indeed, in severe pollution areas and for many UHV applications, composite insulators may be the only practical solution with regard to extremely high creepage distance. In regard to AC, there are IEC standards for design and testing and practical experience with composite insulators covers decades. In regard to DC applications, pollution behaviour is generally a more significant issue because of polarization and charge accumulation, with resulting possible higher pollution accumulation. In addition, a missing voltage zero crossing leads to different discharge behaviour.
Standards for pollution testing of composite insulators under AC and especially for DC applications are still not available. This has lead to special customer tests with increased requirements that are not necessarily widely accepted but rather based on individual experience. Additional long-term ageing tests under severe service conditions are therefore needed to provide a more complete overview of pollution behaviour.
Laboratory Tests: Artificial Pollution Test with DC
Suitability of insulator design can be verified by using recommendations in IEC TS 60815, by relying on operating experience or through laboratory testing. Customers typically ask for artificial pollution tests, especially for DC conditions, and several such tests have been performed according to IEC TS 61245 with pollution type A, i.e. that associated with inland, desert or industrially polluted areas. The test has to verify expected behaviour of different insulator designs at different pollution levels. Results are compared with requirements of IEC TS 60815-4.
Test Procedure
Artificial pollution tests were performed in Germany on composite insulators using the solid layer method based on IEC TS 61245 for DC porcelain insulators. Additionally, pre-conditioning with kaolin according to CIGRE TB 555 was necessary to apply the pollution layer. The pollution suspension contained different quantities of salt and kaolin, described by ESDD (Equivalent Salt Deposit Density) and NSDD (Non Soluble Deposit Density). The following procedure was considered for these tests:
• Washing and drying insulator;
• Pre-conditioning by application of dry kaolin powder to suppress hydrophobicity;
• Application of uniform pollution layer (mixture of kaolin powder, sodium chloride and water);
• Measurement of ESDD and NSDD values according to IEC TS 61245 clause 6.5 and IEC TS 60815-1, Annex C to verify correct degree of pollution. If required, further adjustments done;
• Natural drying (around 24 h).
Insulators Tested
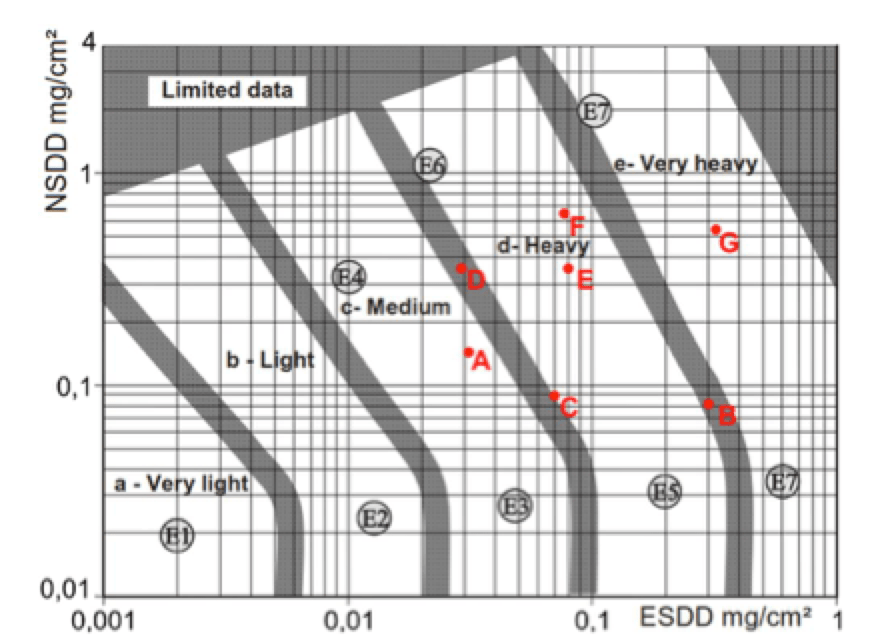
Fig. 1 shows the pollution layers tested with their respective ESDD and NSDD values. These correlate with site pollution severity classes according to IEC 60815-1. The 7 different pollution layers tested were labelled A to G.
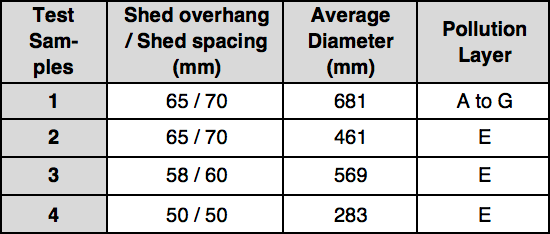
Test samples with different alternating shed profile, diameter and pollution layer were chosen for the artificial pollution test (see Table 1). All samples were designed with a creepage factor of 4, i.e. in line with IEC TS 60815-4.
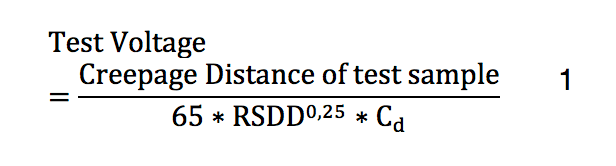
Verification of insulator pollution performance is usually done according to IEC TS 61245 as a withstand test and there are three individual test periods of 100 min each. The specified characteristics of the insulator being tested are confirmed, according to the standard, if no flashover occurs. To gather more information about limit values, modified up & down tests were also used. A starting test voltage was applied for the first 15 minutes. This voltage was calculated using equation 1, based on IEC TS 60815-4, where RSDD (reference DC site severity) and Cd (diameter correction) are introduced in equations 5 and 6. Then, voltage was increased every minute until the first flashover occurred. After flashover, the test voltage was raised as fast as possible to 90% of flashover voltage. Subsequently, voltage was increased again, as fast as possible, by 5% every 3 minutes until flashover. The procedure was continued for a minimum duration of 100 minutes, if no decrease in flashover voltage was observed at the last three flashovers.
Normalizing Test Results
To compare test results on insulators of different dimension, minimum flashover voltages are converted into specified creepage distances (SCD0, FO) according to equation 2 of IEC TS 60815-4. This also considers that, for average diameters Da > 250 mm, a correction has to be performed. Consequently, index ‘0’ for diameter correction and index ‘FO’ for normalized flashover values are given:
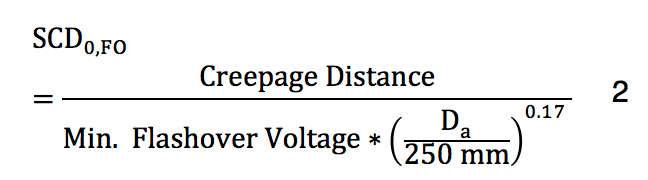
Decreasing flashover voltages result in increased values of SCD0, FO.
Up & Down Test vs. Withstand Test
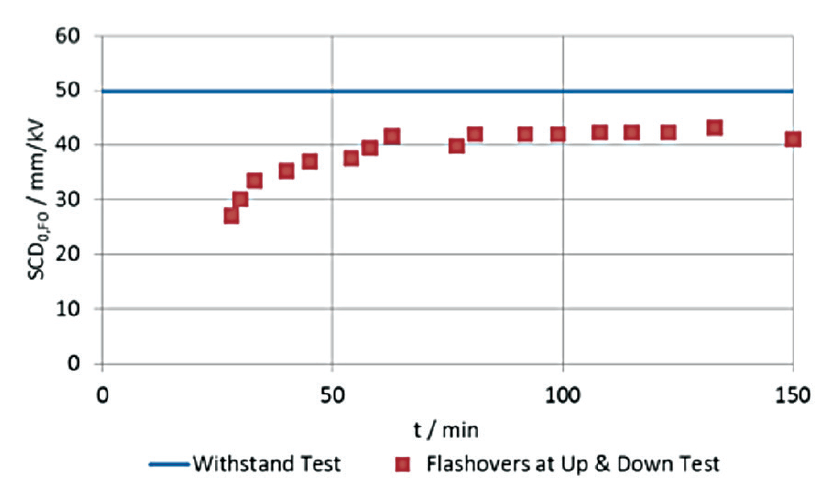
For comparison, both an ‘up & down’ test and a withstand test were per-formed using the same pollution suspension on two insulators of same de-sign. The withstand voltage was chosen as 15% lower than the minimum flashover voltage obtained during the up & down test. The withstand test was successful.
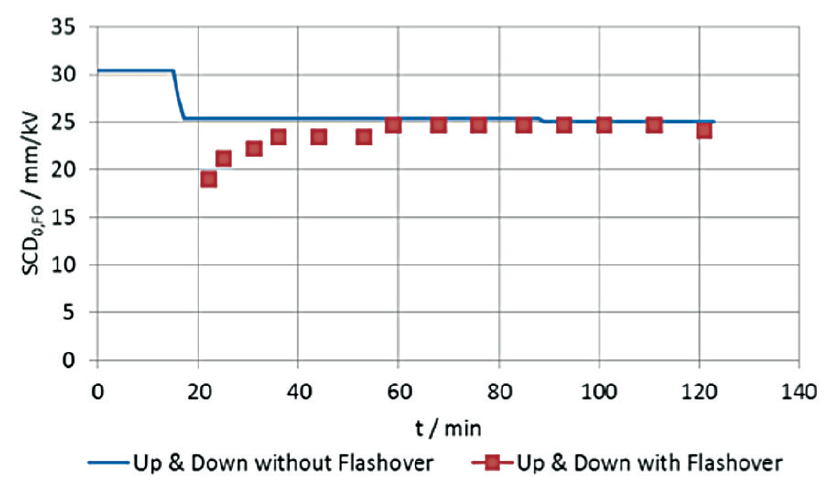
Furthermore, one up & down test was performed twice on the same insulator design and with the same pollution suspension. This was because test voltage was limited by the test circuit and no flashover could be obtained during the first test. After adapting the test circuit, the minimum flashover voltage was only 2% lower than the withstand voltage (see Fig. 3). Considering other uncertainties e.g. pollution layer preparation, this deviation is considered quite low.
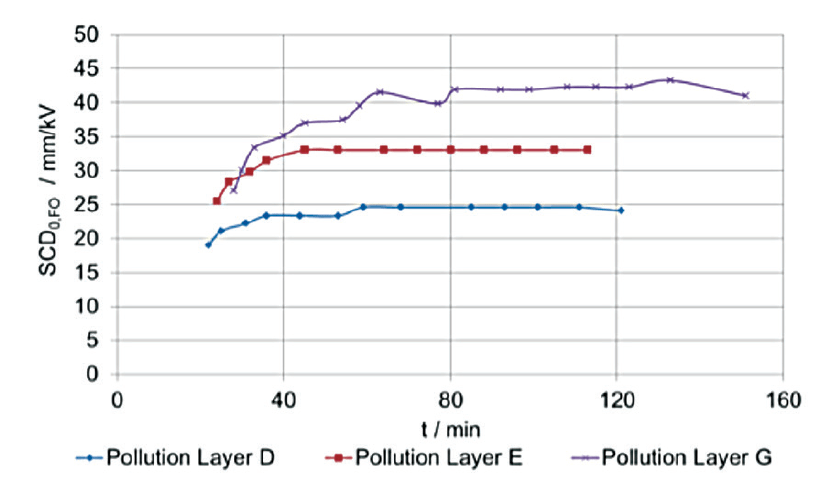
Thus, maximum withstand voltage and minimum flashover voltage are very close and a reason for this could be that flashover voltage is highly stable over a long period. More than 20 tests were performed on composite insulators, which showed similar flashover behaviour during artificial pollution tests (e.g. some results are shown in Fig. 4). Minimum flashover voltages for the vertical test position were reached after 40 to 70 minutes, depending on fog distribution and a constant flashover voltage occurred for at least 30 minutes. This implies a long critical time range, which might be caused by a slow wash-off process of the pollution. Thus, several flashovers can be realized during the critical time range using artificial pollution tests on composite insulators.

Influence of ESDD & NSDD
Specific creepage distances shall be chosen according to environmental conditions. Therefore, IEC TS 60815-3 applying for AC composite insulator design, defines fixed specific creepage distances (SCD) for the five site pollution severities classes (i.e. from very light to very heavy). IEC TS 60815-4 introduces the following equations for calculation of required SCD for HTM (a hydrophobicity transfer material) and for non-HTM.
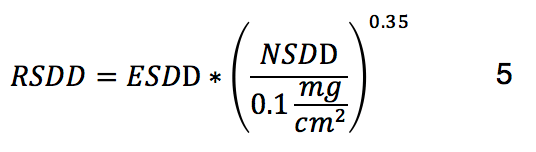
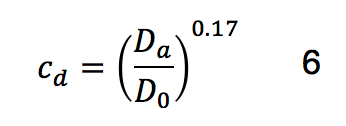
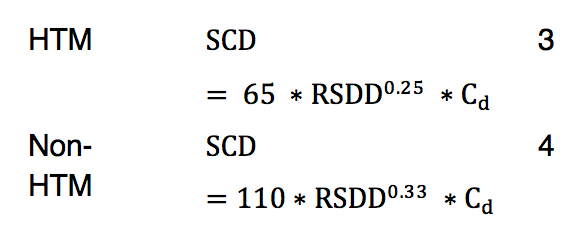 Equations 3 and 4 consider pollution amount with reference DC site severity RSDD, as defined in equation 5 and also known as ESDDDC in IEC TS 60815-4. This is calculated from ESDD and NSDD values and the diameter correction Cd, introduced in equation 6.
Flashover voltage decreases or, more precisely, SCD0, FO increases with amount of pollution. For further evaluation, expected specific creepage distance for HTM and non-HTM materials according to equation 3 and 4 are also shown for insulators with average diameters Da ≤ 250 mm (Cd=1) in Fig. 5. Despite the suppressed hydrophobicity, results clearly show that the insulators performed as HTM and not as non-HTM. Measured normalized SCD0, FO deviated in a range of -1.5% to +40%. Moreover, the deviation was smaller for lower than for higher pollution. The reason could be that discharge processes seem to dominate at lower pollution levels while stronger drying processes dominate at higher pollution levels, which results in higher voltage demand across dry zones.
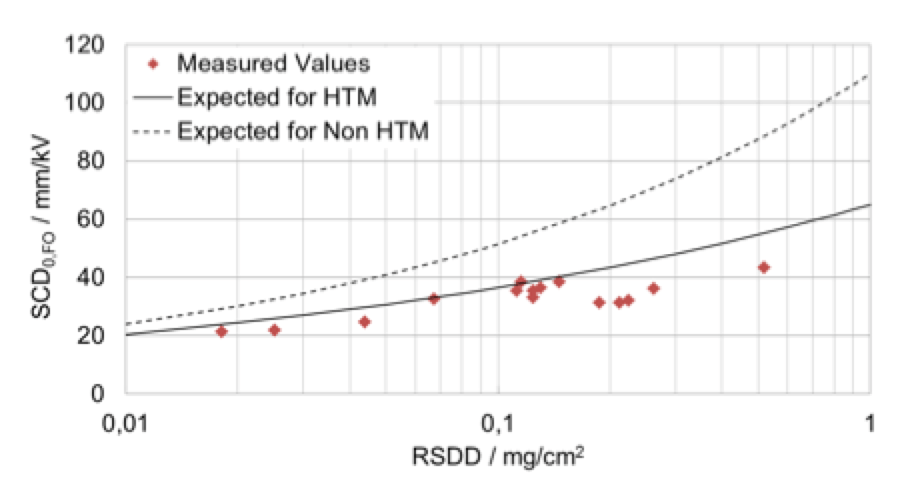
Using this calculation rule leads mostly to more creepage distance than necessary, so the rule is sufficient.
Influence of Shed Profile & Diameter
Shed profile has an influence on insulator performance under pollution. Therefore, the following parameters have to be considered during design:
shed overhang; shed spacing; ratio between shed overhang & shed spacing; diameter. IEC TS 60815-4 recommends a minimum distance between sheds of c ≥ 45 mm and c ≥ 55 mm for Da ≥ 250 mm for composite insulators in uncontrolled environments. Furthermore, shed spacing(s) versus shed overhang (p) shall be s/p ≥ 0.8. Profiles of the insulators tested already consider these recommendations. Also, flashover voltages decrease with larger diameters because of higher likelihood for start of discharges as well as flashover. IEC TS 60815-4 considers this effect with a diameter correction, shown in equation 6.
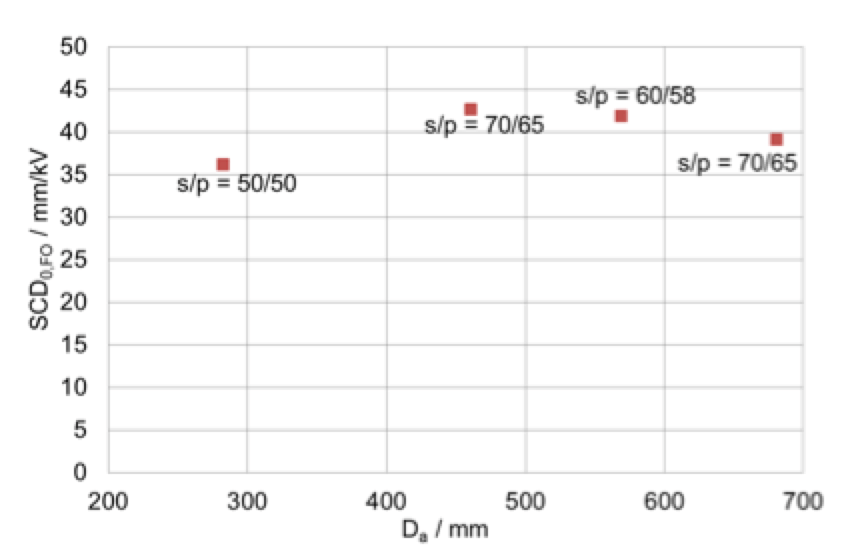
Investigations show that the SCD normalized to Da < 250 mm varies only by 8% between the different shed profiles and diameters. Only one test was performed for each diameter with one pollution layer and as such results are not verified. Nonetheless, the shed profiles examined seem to be suitable for DC application.

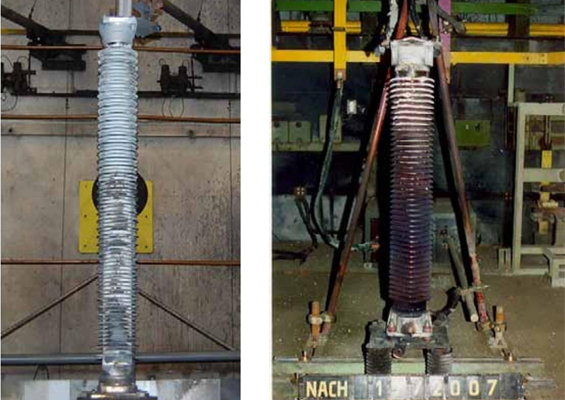
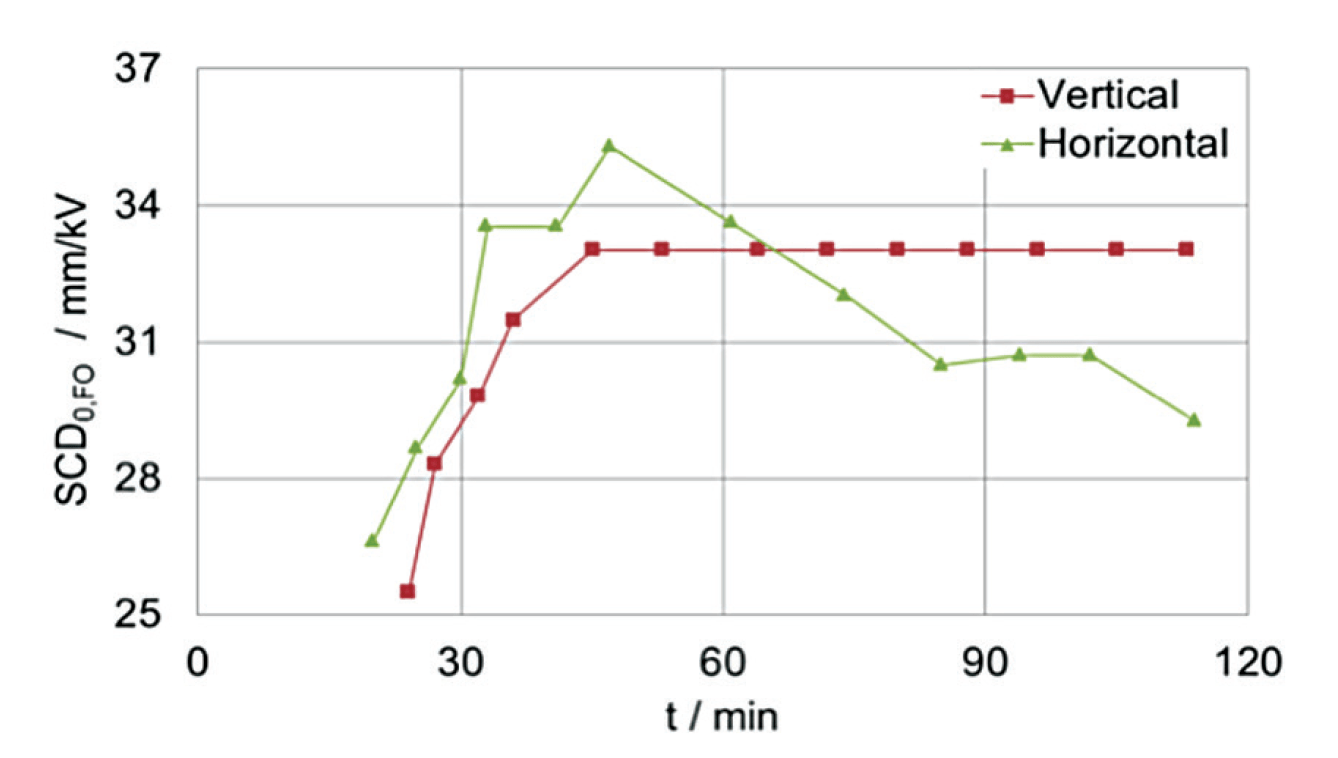
Influence of Mounting Position
Two tests with same pollution layer were performed to investigate influence of mounting position. Fig. 7 shows that flashover values were slightly lower (i.e. SCD0, FO is higher) at vertical insulators. However, recovery is faster for horizontal insulators because this position is more efficient for the washing process.
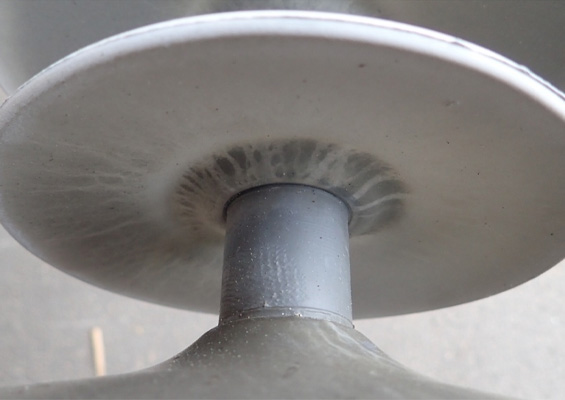
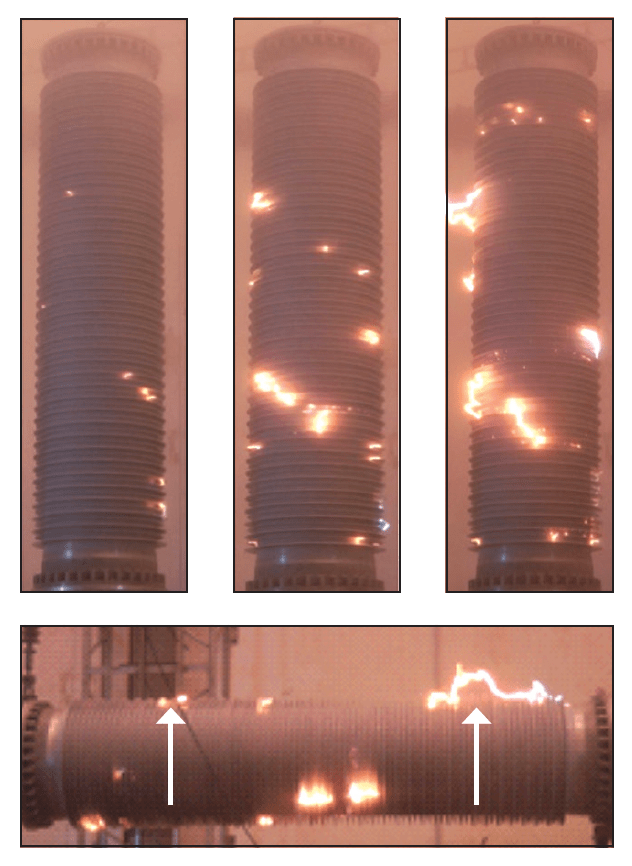
Generally, observations of discharges were similar during these tests:
• First 15 minutes, no visible discharges;
• Between 15 and 30 minutes – saturation of steam in test room;
• Discharges with small expansion starts with low light intensity;
• Increasing discharge frequency & first shed bridging occurs;
• Decrease of discharge frequency & various sheds bridged;
• Discharges occurred mostly at bottom of vertical insulators;
• Discharges began at lower side of horizontally positioned insulator and migrated to higher side. One reason may be thermal up thrust forces (see Fig. 8).

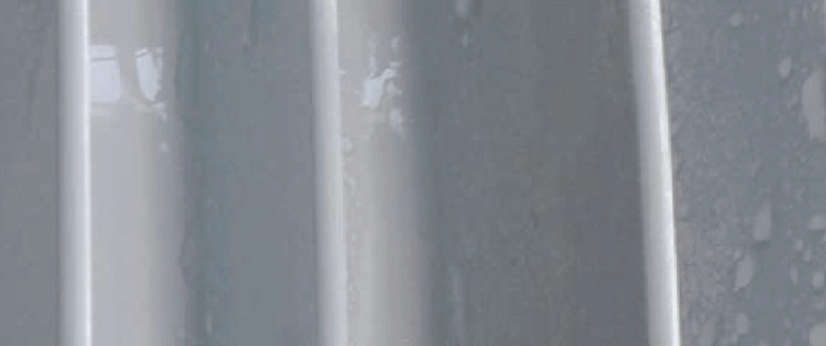
Hydrophobic Capability
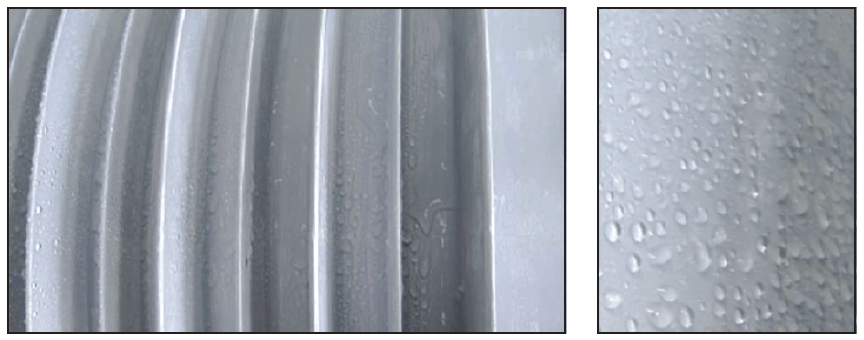
The waiting time was approx. 24 h between application of pollution suspension and the test. After 24 h drying, the insulator showed a hydrophilic condition by measurement of wetting properties using the spray method according to IEC TS 62073. Immediately afterwards, the tested insulators showed mainly hydrophilic condition (i.e. wettability class WC 7). But one hour later, there was already improvement in hydrophobicity and, after 24 to 48 hours, hydrophobicity recovered. Generally, hydrophobicity level is slightly better at the insulator trunk and on small sheds (WC 4-6) compared to larger sheds and also the earth and high voltage terminals. Hydrophobicity is better on the earth side due to less washing at the top and fewer discharges during the test.
Long-Term Outdoor Tests
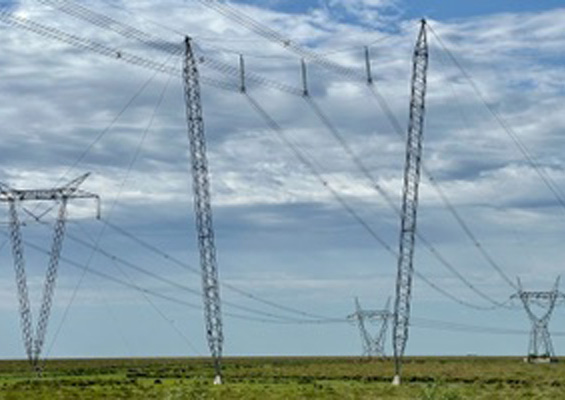
An insulator energized with AC voltage has been installed for more than 2 years at EDF’s outdoor test facility in Martigues, France. This facility is located directly on the coast and subject to heavy pollution, comprising both marine (salt fog) and industrial (oil refineries and power plants) pollution.
Leakage current is continuously monitored and monthly visual inspections are performed, which include measurements of pollution severity class and hydrophobicity level.

This test showed good results, e.g.:
• Hydrophobicity tests (WC2 to WC3);
• According to IEC 60815-1, Annex E, SPS (site pollution severity) class “d” (heavy) confirmed by ESDD/NSDD measurements;
• Low leakage current (peak <10 mA);
• No electrical activity.
It was decided to shorten the insulator from USCD (unified specific creep-age distance) = 62 mm/kV to 43.3 mm/kV (correlating with SPS class “d”) in order to increase stress.

Conclusions
Laboratory and outdoor tests on composite insulators under AC and DC stresses, according IEC standards as well as customer specifications, have shown good results. Some laboratory tests consisted of artificial pollution tests under DC stress on hollow core insulators of different lengths and diameters. Test procedure was based on the solid layer method described in IEC TS 61245. Artificial pollution tests showed the following results:
• Comparing effort with benefit, the up & down test is adequate for qualification of DC composite insulators compared to a withstand test because critical time range to get minimum flashover voltages is more than 30 minutes;
• Recommendations of IEC TS 60815-4 are applicable to calculate required specific creepage distance. It should be noted that the margin is higher for high and very high pollution than for lower pollution levels;
• Vertical and horizontal positions of insulators lead to slightly different pollution performance. Flashover voltage is higher in the vertical position but wash-off process is better for horizontally installed insulators;
• Hydrophobicity recovered within 24 to 48 hours after the pollution test on the insulators tested;
• Further investigation is proposed concerning impact on behaviour of diameter and shed profile.
To gain long-term experience and to verify laboratory testing, a support insulator assembly was placed at an outdoor EDF test facility close to the coastline and characterized by severe marine and industrial pollution. Despite this high pollution level, good long-term behaviour is confirmed.
References
[1] 6th Conference on Silicone Insulation – Burghausen – June 27 – 28, 2017
Experience on Composite Hollow Core Insulators Regarding Pollution Performance
Eric Moal – Reinhausen Power Composites
[2] IEC 60587:2007
Electrical insulating materials used under severe ambient conditions – Test methods for evaluating resistance to tracking and erosion
[3] IEC 61462:2007
Composite hollow insulators – Pressurized and unpressurized insulators for use in electrical equipment with rated voltage greater than 1000 V – Definitions, test methods, acceptance criteria and design recommendations
[4] IEC 62217:2012
Polymeric HV insulators for indoor and outdoor use – General definitions, test methods and acceptance criteria
[5] IEC 62217 (2005-10) First edition
Polymeric HV insulators for indoor and outdoor use – General definitions, test methods and acceptance criteria
Annex B- Test at multiple stresses
[6] IEC TS 61245:2015
Artificial pollution tests on high-voltage ceramic and glass insulators to be used on d.c. systems
[7] IEC TS 60815-1:2008
Selection and dimensioning of high-voltage insulators intended for use in polluted conditions – Part 1: Definitions, information and general principles
[8] IEC TS 60815-3:2008
Selection and dimensioning of high-voltage insulators intended for use in polluted conditions – Part 3: Polymer insulators for a.c. systems
[9] IEC TS 60815-4:2016
Selection and dimensioning of high-voltage insulators intended for use in polluted conditions – Part 4: Insulators for d.c. systems
[10] IEC TS 62073:2016
Guidance on the measurement of hydrophobicity of insulator surfaces
[11] CIGRE TB 555
Artificial pollution test for polymer insulators: results of round robin test