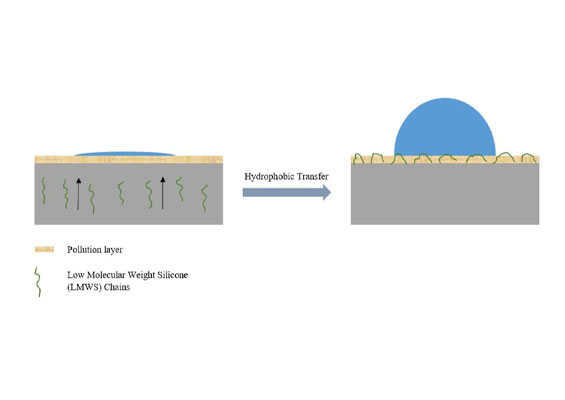
Applying a silicone coating to glass and porcelain insulators is an established technology to improve wet insulation behaviour under pollution. The main advantage comes from the added hydrophobicity, which is also transferred to the pollution layer. Upon wetting, a droplet layer forms and resistive leakage current is suppressed. As such, the pollution flashover process differs significantly compared to hydrophilic surfaces and the result is increased pollution flashover voltage versus dry flashover voltage value. Typically, silicone coating is applied to the entire surface of a glass or porcelain insulator.
This edited past contribution to INMR by Dr. S. Kühnel, Prof. Stefan Kornhuber of the University of Applied Science Zittau/Görlitz as well as experts at Wacker Chemie in Germany studied pollution flashover performance of partially coated glass cap & pin insulators. Such insulators were also investigated under salt fog conditions to evaluate stability of their hydrophobic properties.
Insulator String & Coating
Dimensioning Insulator String
Pollution flashover of different cap & pin type insulators has already been investigated and it has been determined that even partial coating can lead to significant increase in flashover voltage compared to an uncoated insulator. For example, a systematic investigation of the pollution flashover of partially coated insulators was performed in 2017 using cylindrical model insulators to better understand the flashover process (e.g. extension of pre-arcs) and to estimate resulting flashover voltage.
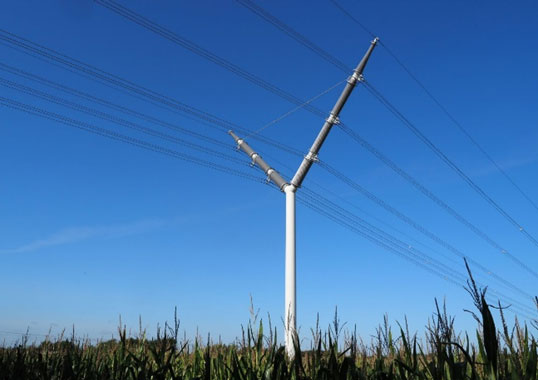
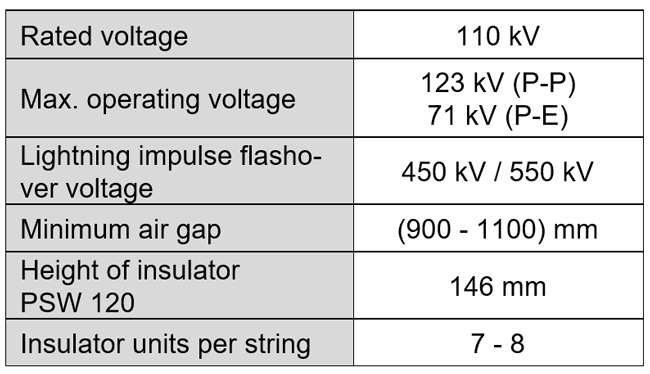
Several parameters must be defined in order to apply this same model to glass cap & pin insulators, including maximum voltage drop and level of pollution. In this investigation, a 110 kV insulator string consisting of PSW 120 cap & pin insulators was chosen (see Fig. 1).
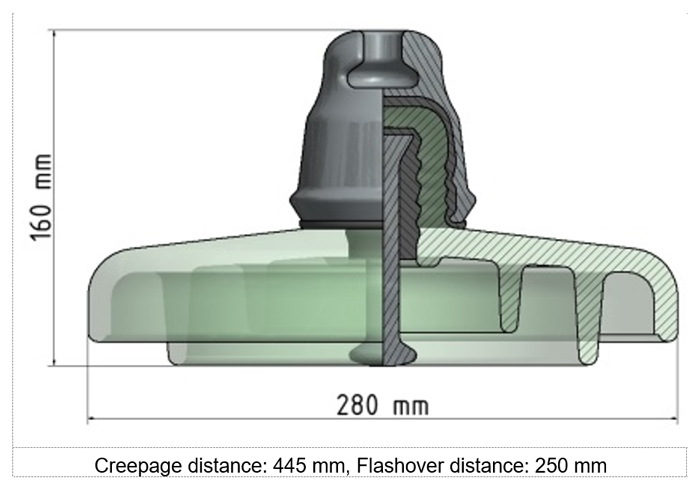
Taking the dimensions of the insulator disc into consideration, a string consists of 7 to 8 units with respect to minimum required air gap (see Table 1).
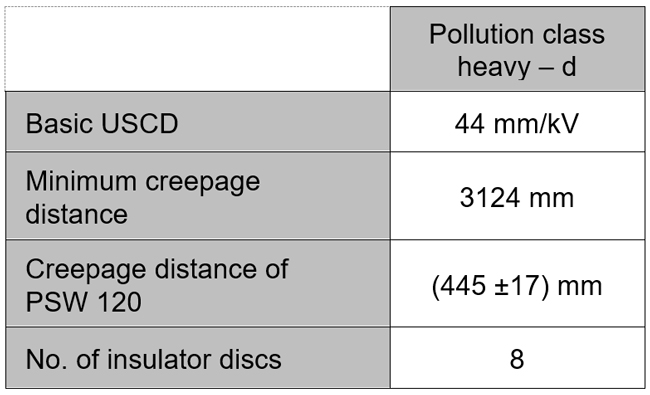
Proper dimensioning of a glass & pin insulator string requires consideration of their insulation capability under polluted conditions. In this regard, an insulator string for heavy pollution (according to IEC 60815) usually consists of 8 discs (see Table 2).
Recommendations in IEC 60815 and IEC 60507 were chosen for dimensioning the silicone coating. In this way, an SDD level up to 0.7 mg cm-2 and a volume conductivity of the pollution liquid greater than 42 mS cm-1 are assumed. Maximum volume conductivity is defined based on volume conductivity of seawater, i.e. 50 mS cm-1.
Dimensioning Coating Length & Position
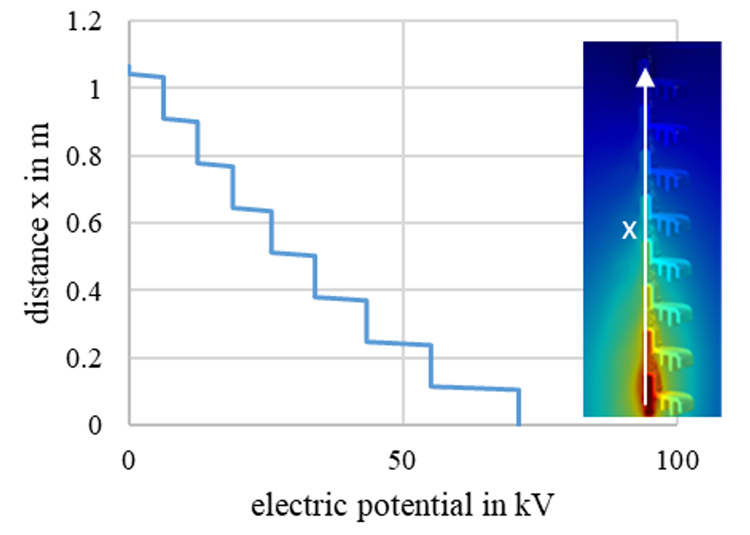
Calculation of coating length (namely the creepage distance of the insulator that is covered by the coating) requires information on the maximum stress (i.e. maximum voltage drop) of a single glass insulator disc. As a first step, distribution of the electric potential (electrostatic field) of a dry insulator string, consisting of 8 PSW 120 glass insulator discs was numerically calculated using COMSOL Multiphysics. The top end of the string is grounded and the bottom end exposed to high potential (i.e. 71 kV). Since the insulator string is mounted on the cross-arm of a tower, this typically leads to non-uniformity of potential distribution. Highest electric potential drop across one glass insulator disc is calculated to be nearly 18 kV (see Fig. 2), which is in line with most published values.
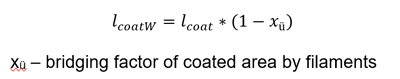
Required length of coating is then calculated using this maximum voltage drop as well as the empirically determined specific flashover voltage of a silicone coating with droplets, based on the formula below:
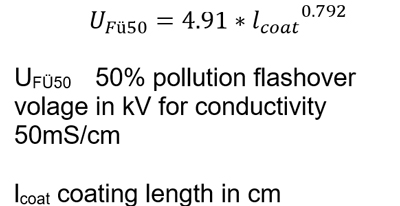
Applying this formula, coating length needs to be 5.2 cm so as to achieve a flashover voltage of 18 kV at 50 mS cm-1.

Defining Coating Position
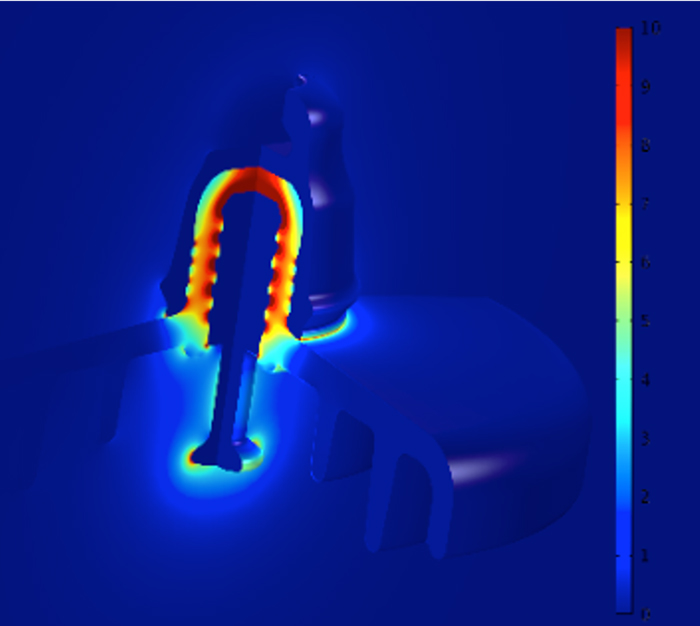
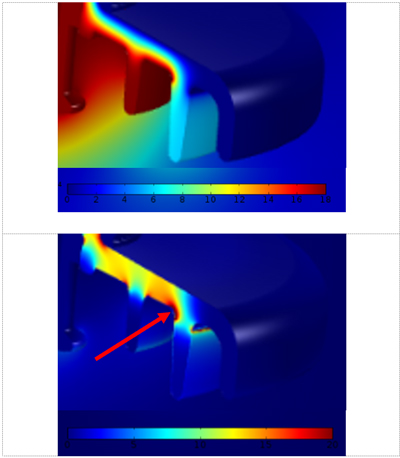
The upper side of the glass insulator disc is excluded from consideration because of lower hydrophobicity retention. Similarly, the surface area close to the fittings is also excluded since it shows high electric field stresses (>5 kV cm-1) under dry conditions (see Fig. 3). Therefore, partial discharges can occur and reduce the coating’s hydrophobicity.
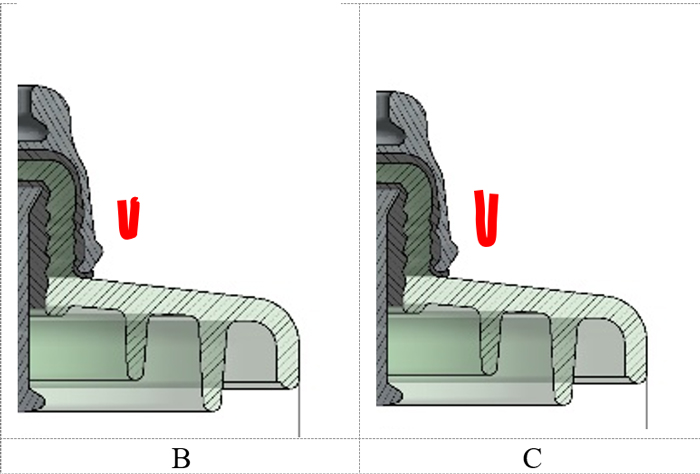
Respecting these considerations, two coating patterns were evaluated in detail (see Fig. 4).
When calculating electric field of the insulator string under wet conditions, all uncoated areas are assumed to show a film layer of the electrolyte and thus defined to be a resistive layer at floating potential. Coated areas are assumed to show a hydrophobic droplet layer and thus the insulating capabilities of air.
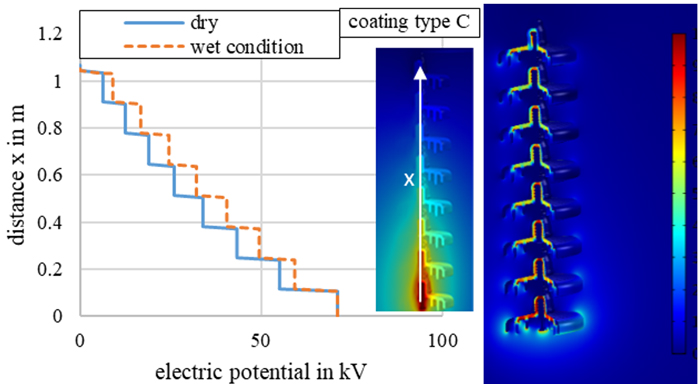
Both coating types (Types B and C above) were investigated with lengths of coated sectors of 5.2 cm and 9 cm respectively, resulting in theoretical pollution flashover voltages of 18 kV and 28 kV. Calculations were performed assuming radially and axially uniform pollution on each insulator disc. The potential calculated along the insulator string under wet conditions showed more uniform distribution in the middle axis of the string compared to under dry conditions (see Fig. 5). Maximum voltage drop over one insulator disc decreased to about 12 kV.
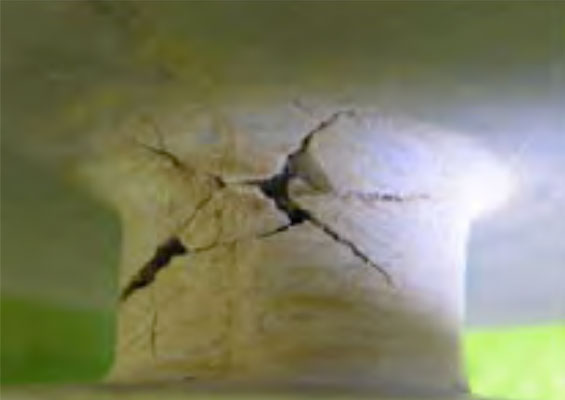
When considering a single insulator disc under wet conditions, the voltage drops over the coated area. Therefore, the highest electrical field stress is at the transition between the silicone coating and the conductive film layer (as shown by the red arrow in Fig. 6 for coating Type C). This transition point could become challenging for long-term stability of hydrophobicity in service since any partial discharges that occur can reduce this desired property.

Experimental Verification
Pollution Flashover Voltage
Test Procedure & Set-up
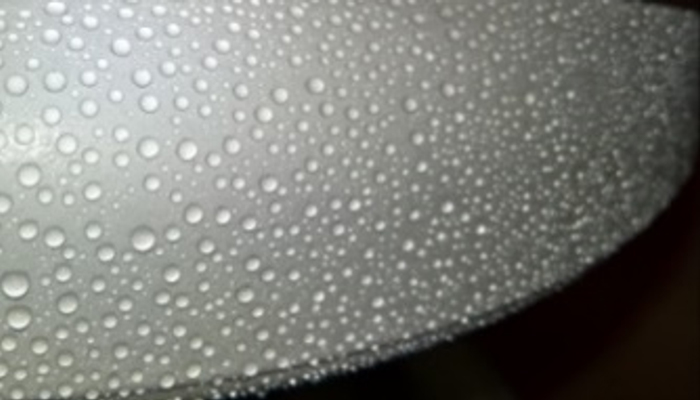
Single PSW 120 type cap & pin insulators with Types B and C coatings were evaluated with respect to pollution flashover voltage. Artificial pollution of the insulators was achieved using two different methods: glass surfaces were polluted by dipping the insulator into a slurry made of water, 20g pyrogenic silica (Wacker HDK® N20) per litre and sodium chloride. A pressure sprayer was used to spray a solution of water and sodium chloride onto those areas with silicone coating, resulting in a uniform layer of droplets on the surface (see Fig. 7). All tests were carried out in the suspension orientation.
The 50% pollution flashover voltage was determined by the up-and-down test method and set-up. After each electrification, insulators were cleaned thoroughly with water to remove all residues of the pollution layer. To ensure maintaining Hydrophobicity Class 1 in the silicone coated areas of the insulator, a recovery period of at least 48h was allowed after each flashover. A high speed camera evaluated the flashover process. Every test series consisted of at least 10 tests to ensure statistical confidence and all values were reported as arithmetic means with 95% confidence intervals.
Test Results
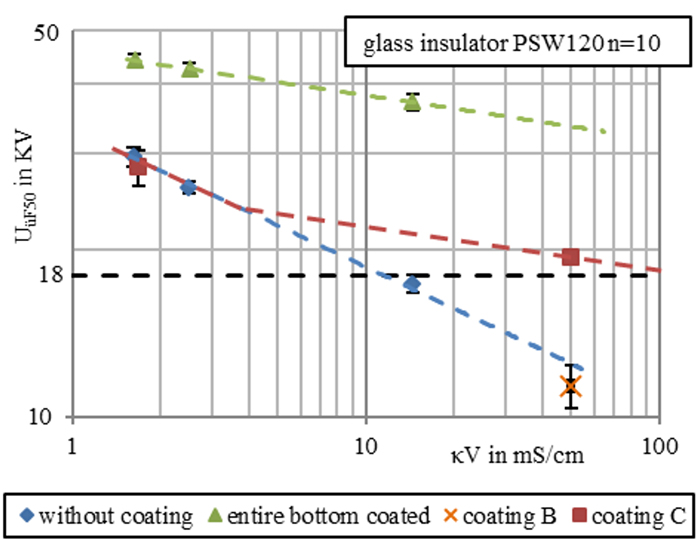
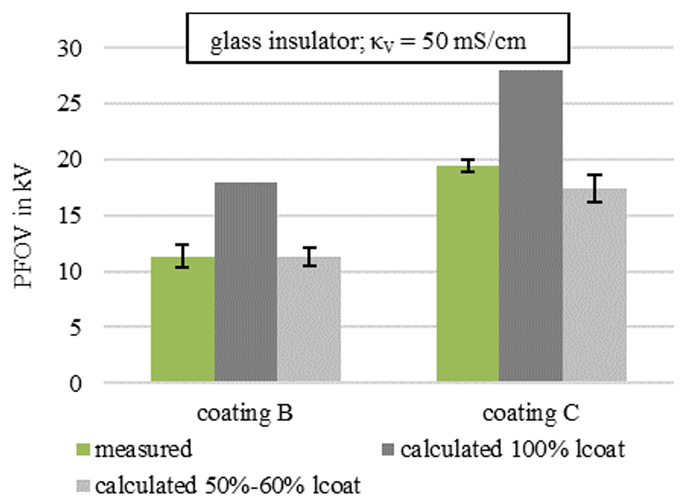
Fig. 8 shows the pollution flashover voltages for partially coated, fully coated and uncoated insulators. Against expectations, insulators with Type B coating showed about the same pollution flashover performance as uncoated insulators in those tests where liquid conductivity was 50 mS cm-1. A flashover voltage of 18 kV was calculated and a voltage of about 11.5 kV measured. Pre-arcing activity could be observed before the start of flashovers. In the case of the Type C coating, a significantly lower pollution flashover voltage than calculated was also measured for liquid conductivity of 50 mS cm-1. Results for conductivity of 1.7 mS cm-1 were in the range predicted by the model.
Both coating types showed pollution flashover voltages at high pollution conductivity that were much lower than had been predicted. Observations of the flashover process were then performed to investigate the reasons (see Fig. 9).
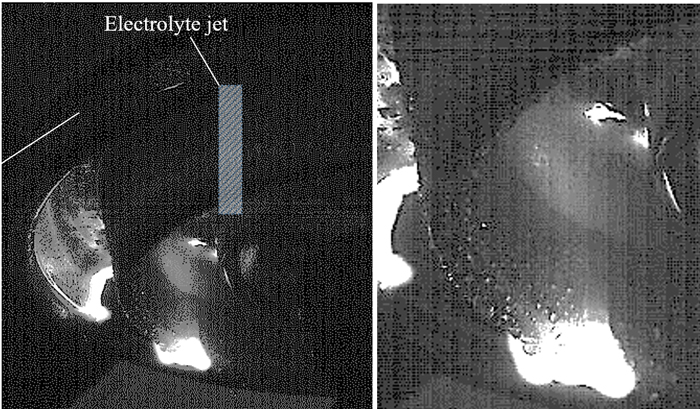
It was seen that, in cases of flashover, a relatively long filament bridges a large portion of the coated area (i.e. 40 to 50%) and this leads to reduction in effective coating length as well as flashover voltage. This effect had not been observed in past studies using slim cylindrical insulators, likely caused by insufficient supply of current necessary for flashover on these slim insulators.
To compensate for this effect, an effective coating length was introduced according to the following:
Recalculating pollution flashover voltages for both coating types, this time using effective coating lengths, showed good accordance of measured and calculated values (see Fig. 10).
As conclusion, the pollution flashover calculation model has to be modified by including reduction in effective coating length by a geometric factor.

Hydrophobicity Status Under Salt Fog Conditions
Test Procedure & Set-up
Salt fog tests were carried out according to IEC 62217 to evaluate stability of the coating layers on the glass cap & pin insulator under investigation. During these tests, fully coated insulators as well as a Type B coating were placed in a salt fog chamber of 4.5 m³ volume (see Fig. 11).
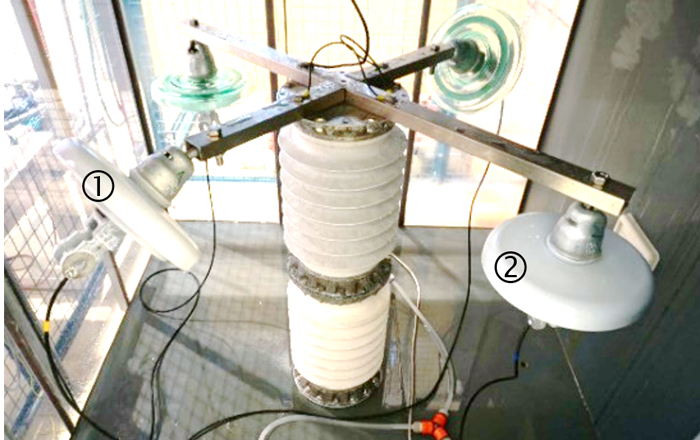
Salt fog was generated using turbo sprayers and deionized water with sodium chloride content of 8 kg m-3 (i.e. conductivity at 20°C of 13 mS cm-1). Amount of precipitation was on average 0.02 ml h-1 cm-². Test voltage was set to 12.8 kV (50 Hz AC), according to specifications as per IEC 62217.
Leakage current was measured and hydrophobicity status evaluated once the test was completed after 1000h. In addition, leakage current (as an indirect measure of hydrophobicity) was also measured during the test.

Test Results
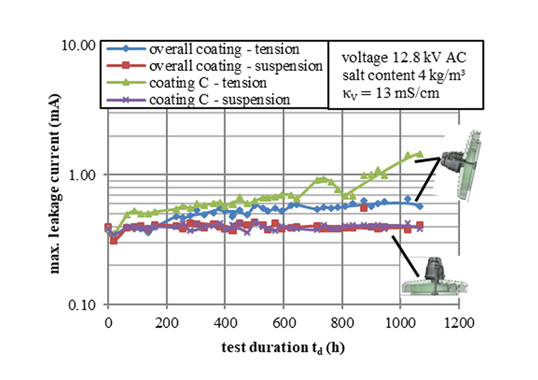
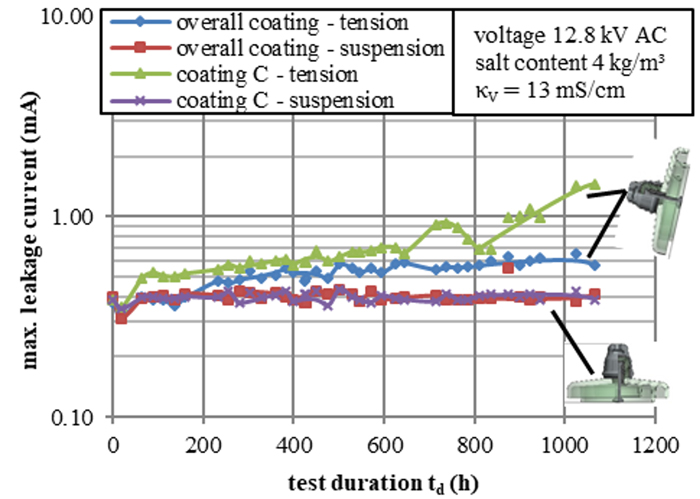
Fig. 12 shows the leakage current over the entire 1000h test duration.
Immediately after the test, hydrophobicity was evaluated by the spray method, according to IEC/TS 62073. Table 3 summarizes the findings.
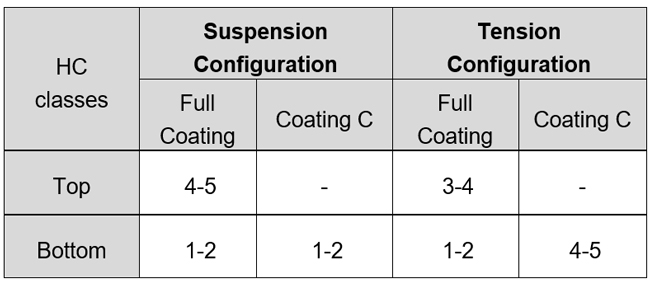
Leakage current of insulators in the suspension configuration remained stable at the low level at 0.04 mA over the entire test time, which shows that at least a portion of the coating remained hydrophobic, even after the 1000 h test duration. This was confirmed by the hydrophobicity status at the end of the test.
For both partially and fully coated insulators in the suspension configuration, the bottom side showed a good hydrophobicity (HC 1-2). The topside of the fully coated insulator showed reduction in hydrophobicity to HC 4-5. Given the selected test conditions and for the type of insulator chosen, the bottom coating area appeared to be more important than the topside with respect to hydrophobicity.
The leakage current trend was different for insulators in the tension configuration. After about 50h and 200h respectively, leakage current for both types of coating began to increase. It is assumed that this was caused by more intense precipitation in the glass cap ribs and hence more intense wetting and electric field stress. Higher leakage current of insulators in the tension configuration, due to greater reduction in hydrophobicity, has also been determined for composite insulators during salt fog testing. Leakage current of the partially coated insulator started to further increase after about 700h. This can be interpreted as due to partial loss of hydrophobicity, as confirmed by its Hydrophobicity Classification. While the bottom of the fully coated insulator showed HC 1-2, the partially coated insulator had only HC 4-5.
Summary
This research dealt with dimensioning of partial silicone coating for a 110 kV glass cap & pin insulator string. Required string length was dimensioned with respect to insulation length for the pollution class ‘heavy’. The pollution flashover model based on slim cylindrical insulators was adapted and required coating length calculated based on empirical data from these model insulators. Coating position was chosen by using numerical calculations of the electrical potential and field. These calculations were carried out for insulator strings consisting of partially coated glass cap & pin insulators.
Calculated pollution flashover voltage for two types of coating arrangements was verified using an artificial pollution test. While in the case of low liquid conductivities, calculated values fell in the range of those being measured, for high liquid conductivities measured flashover voltages were significantly lower than calculated values. For the applied artificial pollution test, a high speed camera revealed ‘electrolyte jet bridging’ of portions of the coating, just before flashover. Thus, effective coating length was reduced and a lower flashover voltage measured under this type of pollution. A correction factor for the model was therefore introduced.
Finally, stability of hydrophobicity on partially coated glass cap & pin insulators was evaluated under salt fog conditions and findings compared to fully coated insulator discs. Overall performance of hydrophobicity stability was found to be sufficient to achieve efficient leakage current suppression, even after 1000h salt fog testing.
As a general conclusion, a partial coating of less than one-third of the creepage distance of glass cap & pin insulators can improve pollution flashover performance and also show satisfactory long-term performance with respect to hydrophobic behaviour. The approach used in this research has demonstrated the performance of a minimal partial coating, optimized in both coating length and position.
For dimensioning in service, a proper safety margin needs to be considered, i.e. coating only the lower surface of a glass cap & pin insulator can be seen as a practical solution. From the perspective of application, any minor defects or damage to the coated layer on glass cap & pin insulators can still offer effective leakage current suppression and high pollution flashover voltage, so long as the coated area on the lower insulator surface remains intact.
References
[1] G. Lange, R. Bärsch, J. Lambrecht, H. Liebermann and u.a., “Erste Betriebserfahrungen mit einem Siliconcoating auf Porzellanstützern unter natürlichen Fremdschichtbedingungen,” Elektrizitätswirtschaft 97, pp. 34-41, 1998.
[2] Z. Jia, S. Fang, H. Gao, Z. Guan and u.a., “Develepment of RTV Silicone Coatings in China: Overview and Bibliography,” IEEE Electrical Insulation Magazine Vol. 24 , pp. 28-41, März 2008.
[3] S. Kim, E. Cherney and R. Hackam, “Suppression Mechanism of Leakage Current on RTV Coated Porcellain and Silicone Rubber Insulators,” IEEE Transactions on Power Delivery, Vol 6, No. 4, pp. 1549-1556, 1991.
[4] G. Karady, M. Shah and R. Brown, “Flashover Mechanism of Silicon Rubber Insulators used for Outdoor Insulation – Part I; Part II,” IEEE Transactions on Power Delivery, Vol. 10, No. 4, October 1995.
[5] J. Liebermann, “New effective ways toward solving the problem of contamination of porcelain insulators,” Refractories and Industrial Ceramics, vol. Vol 43, pp. 55-64, 2002.
[6] R. Bärsch, “Polymere Isolier- und Funktionswerkstoffe für Hochspannungs-isolatoren und Kabelgarnituren – Beanspru-chungen, anwendungsspezifische Eigenschaften und Prüfverfahren,” in RCC-Fachtagung, Tagungsband, Berlin, 06.-07. Mai 2009.
[7] S. Kühnel, S. Kornhuber, R. Bärsch, J. Lambrecht, “Evaluation of the Pollution Flashover Voltage of Glass-Cap-Insulators with defined uneven Silicon Coating,” VDE-Fachtagung Hochspannungstechnik, 14.-16. Nov. 2016.
[8] S. Kühnel, S. Kornhuber, R. Bärsch and J. Lambrecht, “On the Pollution-Flashover-Behaviour of partially Silicone Coated Insulators,” 20th International Symposium on High Voltage Engineering, 2017.
[9] “DIN EN 60071-1 – Isolationskoordination Teil 1: Begriffe, Grundsätze und Anforderungen,” 2006.
[10] “DIN IEC/TS 60815-2 – Auswahl und Bemessung von Hochspannungsisolatoren für verschmutzte Umgebungen,” VDE Verlag GmbH, 2008.
[11] “IEC 60507 – Artificial pollution tests on high-voltage ceramic and glass insulators to be used on a.c. systems,” 2013.
[12] H.-D. Held, “Kühlwasser: Verfahren und Systeme der Aufbereitung, Behandlung und Kühlung von Süsswasser, Brackwasser, Meerwasser in der Industrie,” Vulkan-Verlag GmbH, 2000.
[13] R. Fischer and F. Kießling, Freileitungen: Planung, Berechnung, Ausführung, Berlin: Springer-Verlag, ISBN 978-3-642-56738-4, 2013.
[14] “IEC TS 62073 – Guidance on the measurement of hydrophobicity of insulator surfaces,” 2016.
[15] IEC 62217 – Polymeric HV insulators for indoor and outdoor use – General definitions, test methods and acceptance criteria, 2012-09.
[16] J. Seifert, R. Bärsch, “Bewertung des Kriechstreckendesigns von Silikonverbundisolatoren unter dem Aspekt von Fremdschicht-Bauartprüfungen und langjährigen Betriebserfahrungen,” in ETG-Fachbericht 99, VDE-Verlag, 2005, pp. 47-54.