It was what could justifiably be called “an electric utility’s worst nightmare”.
Early in January, three consecutive masses of warm moist air coming off from the Gulf of Mexico moved ominously northward over an area extending from the southern U.S. State of Alabama to the Canadian maritime Province of Nova Scotia. In the South, this system brought with it torrential rains resulting in severe flooding. However, as the masses continued inexorably to the north their effect became even more insidious.
By January 5, the meeting of these huge masses of moisture with a stationary system of cold winter air from Labrador resulted in sustained freezing rain and ice pellets falling over a large area covering south-eastern Ontario, south-western Québec and the north-east U.S.
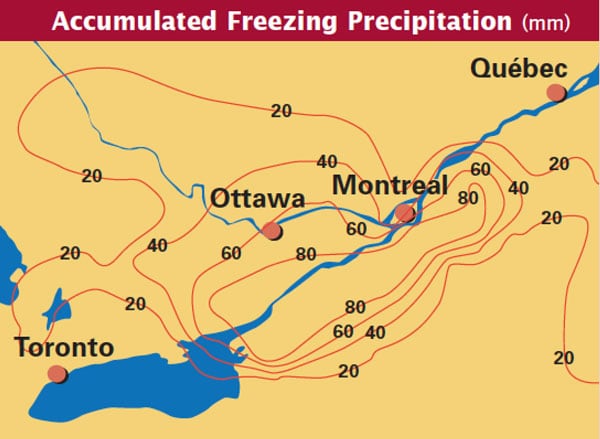
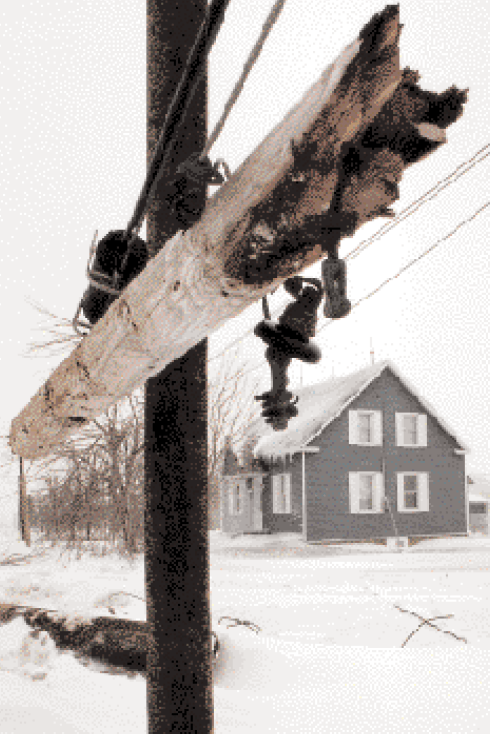
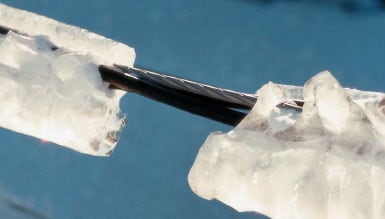
The onslaught lasted nearly five full days producing an accumulation of up to 80 mm (more than 3 inches) of freezing rain in some places and directly leading to what has become the largest power disruption ever recorded in North America. It affected literally millions of people, some of them for periods of up to several weeks. Equally significant, this outage occurred in the midst of the harsh regional winter and in areas where up to 80 per cent of the inhabitants rely on electricity for heating.
To gain a proper perspective and an appreciation that this ice storm was not simply a cause of power disruptions but rather a cataclysmic event in its own right, initial estimates by some experts are that it has directly destroyed the equivalent of 7000 square kilometers of forest. By this measure, it also ranks as among the greatest natural disasters to hit North America during the last few centuries.
Canadian government meteorologists studying the behaviour of this bizarre winter storm maintain that there is no direct evidence to support the notion that it was a product of what has been referred to as global warming. Indeed, the area around southern Québec has seen periodic major ice storms in 1942, 1961 and 1983 – although none with quite this level of severity. Rather, these specialists attribute this latest storm to the now infamous El Niño – the recurring phenomenon of weather change associated with masses of warm air flowing over the tropical oceans. However, many of these same scientists also speculate: what might be causing this unusual El Niño?
In spite of the fact that meteorologists are reluctant to blame the storm on global warming, there is increasing evidence that it was not entirely an isolated freak occurrence. Rather, it appears to be yet another element in a gradual pattern of weather change in Canada and elsewhere which has also brought unprecedented flooding to regions of Québec and Manitoba. Moreover, a similar although far less widespread ice storm wreaked havoc in Labrador only last year, also resulting in extensive damage to the electricity infrastructure.
This evidence is prompting some utility industry observers to insist that current standards for line construction must evolve to deal with greater perceived risks brought about by continuing climatic change.
Hardest hit in terms of the extent of damage to its grid and the numbers of customers affected was Hydro-Québec, one of the largest utilities in the world and operating perhaps the most extensive power network in North America. At the height of the crisis, nearly 1.5 million of its customers or close to one in every two people in Québec was without electricity.
However, the Great Ice Storm of ‘98, as it has now become known, also affected Ontario Hydro, New Brunswick Power (N.B. Power) as well as utilities across the States of New York, Vermont and Maine. Some of these utilities such as N.B. Power were spared the worst of the storm as it unexpectedly veered north toward Québec rather than following the more usual path north-eastward toward the sea. Says Malcolm (Mac) Campbell, an engineer with the utility’s Transmission Department, “we were fortunate in terms of the survival of our high voltage transmission system since we did not have the ice loading of elsewhere. In fact, we lost no structures or pylons at all. Rather most of the damage was in the form of broken jumpers or crossarms caused by the heavy loads.”
According to Campbell, N.B. Power designs for an ice loading of up to 0.5 inches (12.5 mm). While the area served by the utility actually received 1.5 in. (38 mm) of ice, the safety factor built into the structures apparently prevented their collapse. “We build a safety factor of 4 into wooden structures for straight horizontal weight of the conductor” he explains “and 3 for transverse loading. In the case of steel structures, the safety factor is 3 for vertical loading and 1.5 for transverse loading.” Observes Campbell “for us this was more or less just another bad winter storm and the biggest problem was on our 12 kV network due to falling branches and toppled trees. Even with this, in one week we were more or less back to normal.”
CLICK TO ENLARGE
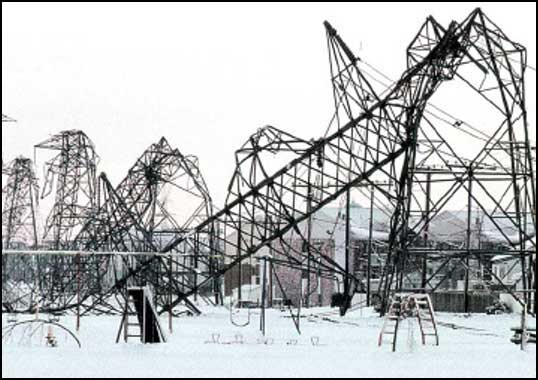
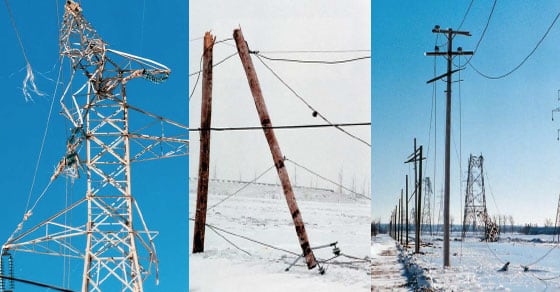
In Eastern Ontario, the sustained freezing rain and resultant ice loading caused the collapse of over 100 steel pylons on an old 115 kV line. However, another more recently-built line running about parallel to the affected 115 kV line sustained only minor damage due to different structures and design being employed. There were also some failures of shield wires and cross-arms on 230 kV towers.
Anand Goel, Supervising Design Engineer with Ontario Hydro, indicates that it is still too early to draw any conclusions from this ice storm since there has not yet been sufficient time to collect detailed data. However, he expects that an internal study will likely be conducted bringing together various disciplines within the utility to determine how this storm may affect design practices in the future. “Basically,” says Goel, “much will depend on the type of system reliability we want in the future as well as the estimated frequency of these types of storm. My hope is that there will be some lessons learned from this event.”
Without question, the area most severely affected – in terms of the combined impact of the storm’s intensity and the extent of damage it caused to the power grid – was Québec. Tragically, the catastrophic effect on the population was exacerbated by the fact that electricity accounts for a comparatively high proportion of the Province’s total energy consumption. Indeed, the longstanding provincial government policy of encouraging energy self-sufficiency utilizing electricity while at the same time making Hydro-Québec the engine of local economic development has made Québec’s dependence on electricity (at over 40 per cent of total energy consumption) the highest in Canada (where the average for all Provinces is below 24 per cent).
Montréal, the largest metropolitan area directly affected by the ice storm (with a population of over 2 million and normal power consumption of about 12,000 megawatts at this time of year) came perilously close to being ‘blacked out’ entirely. The island is surrounded by a ring of high voltage transmission lines which bring in power from several sources, including hydroelectric generating stations at James Bay, Manicouagan and Churchill Falls. However, the damage from the storm severed all but one link in this ring resulting in a situation where the city’s electricity supply relied on only one remaining high voltage line. As one observer put it: “the Island of Montréal is basically hanging by a thread from James Bay.”
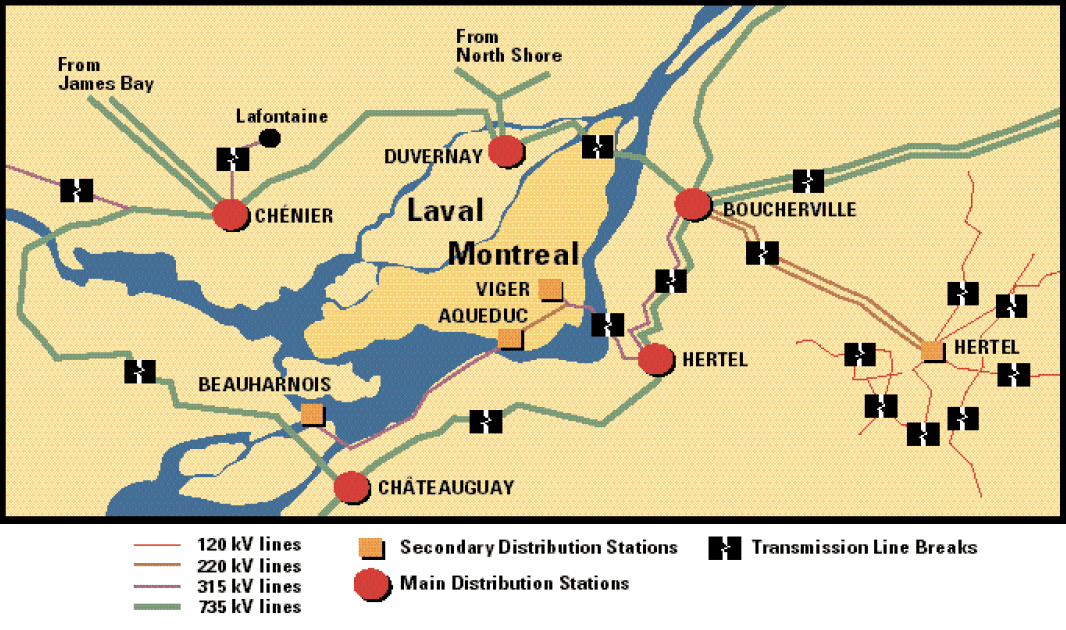
CLICK TO ENLARGE
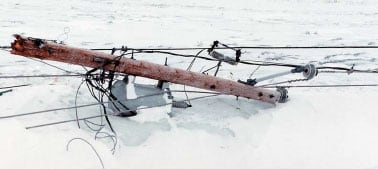
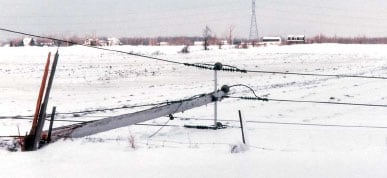
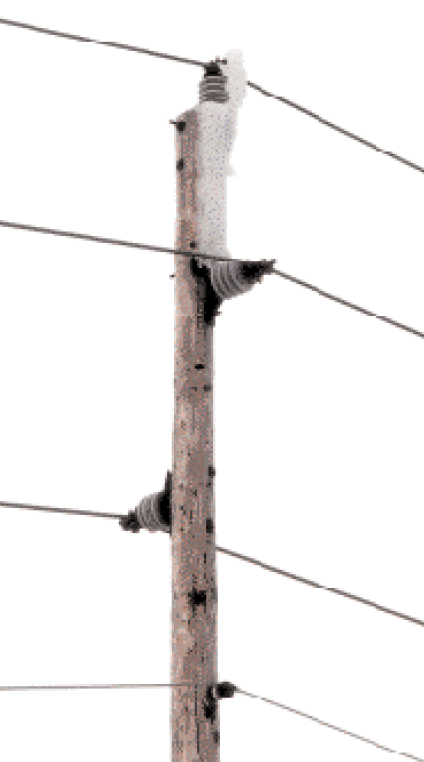
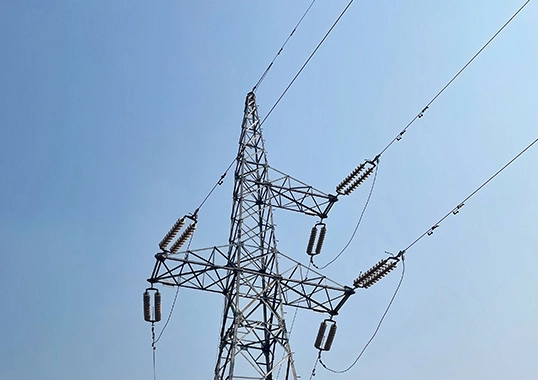
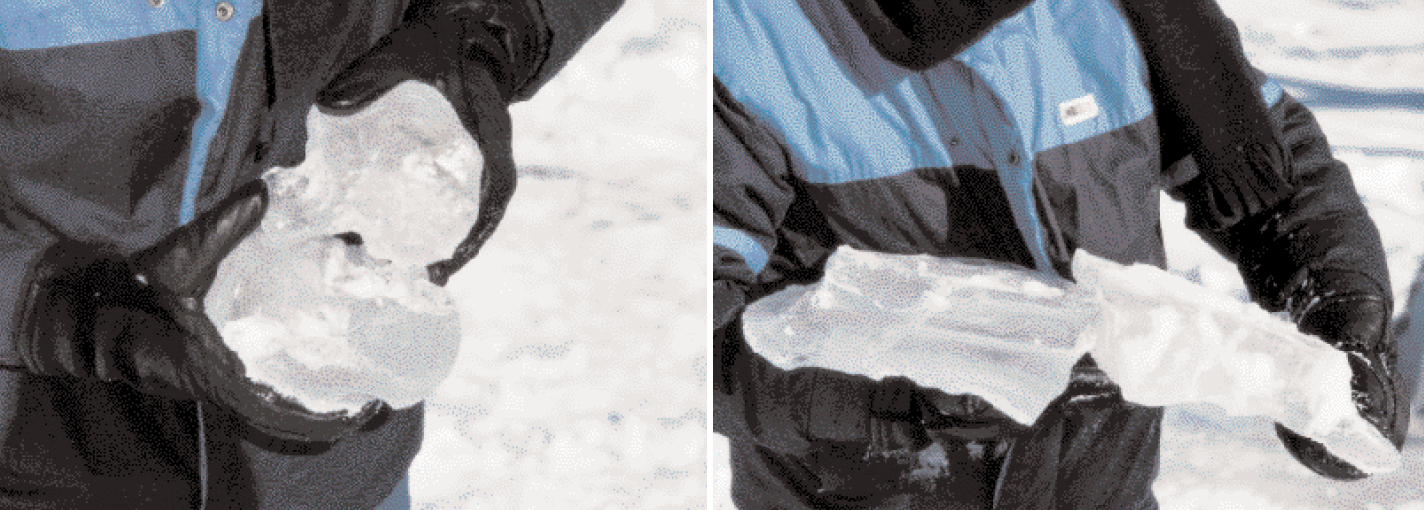
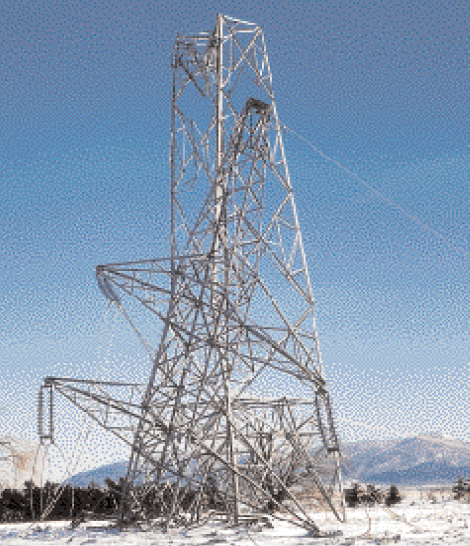
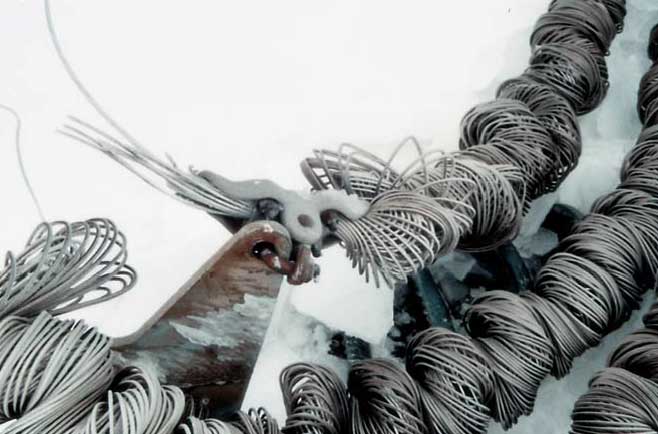
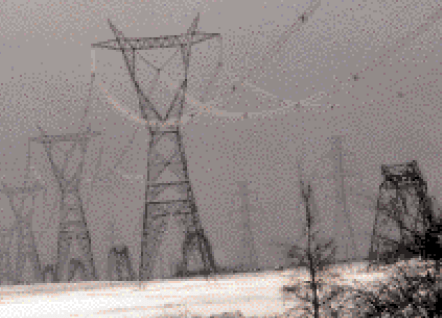
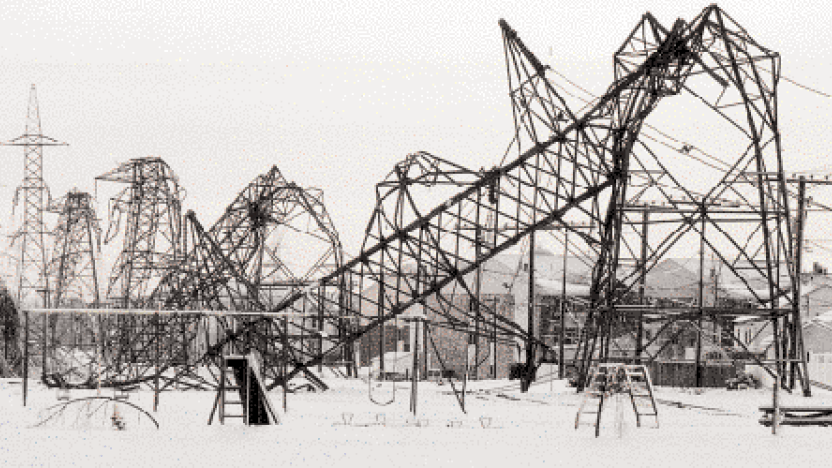
Generally-speaking, the transmission towers used in Québec are designed to bear up to 45 mm (2 inches) of radial ice – a load which is considered sufficiently conservative in as much as meteorologists claim that a situation of excess freezing rain may occur only once in every 50 to 150 years. However, the combination of ice loading from the storm on the structures themselves, which in some cases tripled their weight, and the ice-laden conductors brought down many hundreds of transmission towers and tens of thousands of wooden poles.
Elias Ghannoum, Transmission Specialist with Hydro-Québec, indicates that the huge storm (which actually occurred as three separate consecutive storms) dumped 100 mm (nearly 4 inches) of water equivalent in the St. Lawrence River Valley over a wide area extending from Kingston, Ontario to Québec City. This water was deposited as various combinations of freezing rain, freezing drizzle, snow and rain. “However”, he notes “if looking at freezing precipitation alone (i.e. the type that sticks to lines), we had between 40 mm and 100 mm.”
Ghannoum goes on to explain that before 1973 Hydro-Québec utilized the Canadian Standards Association requirement of 0.5 in. (some 13 mm) radial ice combined with 8 lbs/sq. ft. of wind in the design of its transmission lines. “Then,” he says, “on top of this, we had our safety factors.” In this respect, Ghannoum goes on to elaborate that even though the lines were designed for a minimum withstand of 13 mm, their actual withstand was somewhere between 30 and 50 mm depending on the use factor of particular towers. For example, if towers were designed for 1000 meter spans but were actually used at only 500 meter intervals, then the towers had a reserve strength.
There were other design philosophy changes at Hydro- Québec during this time as well, including the incorporation of anti-cascading towers into the lines. “Basically” observes Ghannoum “it represented a completely different philosophy in that we now had a more consistent design and one which was better balanced throughout the line rather than having some stronger and some weaker components.”
Ghannoum explains that the first day of the ice storm brought less than 40 mm of freezing precipitation and only one line was damaged due most likely to defects in hardware. Nine towers on a 735 kV line toppled. “So” concludes Ghannoum, “our system was able to withstand this first wave. However, from then on it started accumulating.”
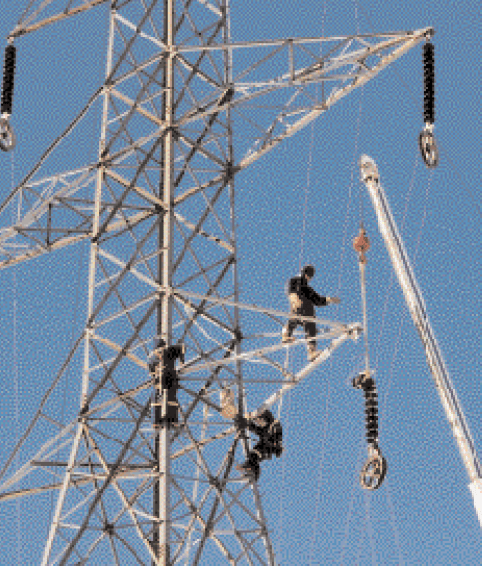
The extent of current activity at Hydro- Québec to restore the transmission grid in the affected areas can only be described as extraordinary. To put this activity into proper perspective, Ghannoum remarks “during the past three weeks, we have purchased materials such as conductors, insulators and towers which exceed our normal purchases for a whole year.”
CLICK TO ENLARGE

According to Stephen Kennedy, a Professor of Structural Engineering at Ottawa’s Carleton University, the fact that so many towers collapsed is not at all surprising, given the severity of the storm. He calculates that with as much as 70 mm of radial ice build-up on conductors, the additional weight to be borne by towers was nearly 1400 kilograms per 100 meters of conductor. Says Kennedy, “in general, any structures are built based on the probability that some will fail under extreme loads. What design engineers try to do is to minimize the probability of such failure based on cost. In this respect, engineers accept a level of risk and they know the cost of that risk.”
CLICK TO ENLARGE
Kennedy goes on to point out that the design of structures is very much a dynamic field with significant improvements realized over the years. He notes for instance that many of the 115 kV transmission structures which collapsed in eastern Ontario were built during the 1930s and were designed for 25 mm of radial ice. By contrast, only one tower built after 1985 failed. “Clearly, our understanding of loads and of how structures behave has improved.”
“Just as the big earthquake in Mexico City resulted in fundamental changes to building codes”, observes Kennedy “so, based on this event, engineers will add the information from this latest ice storm to the database and this may well change design practices for transmission towers in the future. But the fundamental question in this regard will be ‘has the risk level changed?’ In other words, has what used to be seen as an e.g. once in every 150 years event now become a once in every 50 years event?”
Kennedy concludes that one possible solution to avoid damaged structures in such circumstances is to design what he refers to as ‘break-away lines’, whereby rather than building stronger towers, the link of the conductor to the tower is designed to release the line before structural damage occurs to the tower.
CLICK TO ENLARGE
CLICK TO ENLARGE
However, Hydro-Québec’s Ghannoum sees that development of any type of mechanical fuses which release conductors in such circumstances would be complicated by the load transferred to adjacent towers. He also notes that the strength of a tower is not necessarily a constant. “The insulator string transfers load to the tower” he explains, “but this string moves according to the result of loads. If there is a vertical load, then you have different withstand than for some combination of vertical and longitudinal load. So, when putting in a weak link the critical question is what should be the strength of that weak link? “
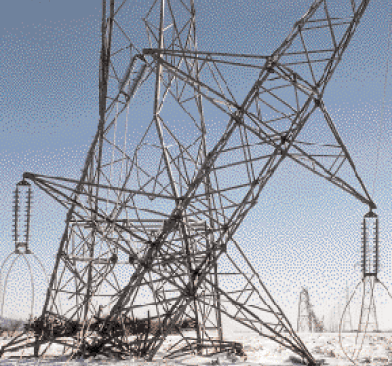
Ghannoum looks at the results of this ice storm as vindicating to some extent many of the design concepts incorporated in 1973. “Since that time” he points out “we have been designing not only on a line basis but, more important, on a service area basis. And, in designing for a minimum 50 year return period, we were sometimes called too conservative. But, now we have proof that the design concepts which we adopted worked very well under the extreme circumstances.” For example, he points to one particular 735 kV line built after 1973 and which runs adjacent to another, this time pre-1973 735 kV line which was completely toppled during the ice storm. Says Ghannoum, “the vertical capacity of the newer towers is probably less than for the older towers. It is only the balancing between components combined with anti-cascading structures which kept the newer line intact.”
Most analysts of this Great Ice Storm of ‘98 have so far agreed that utilities must draw from this experience in order to better prepare for such calamities in the future. For example, at Hydro- Québec officials acknowledged that the utility did not have any computer simulation on how to respond to such a catastrophic power failure. So, while the severe freezing rain which lashed the region for several consecutive days may be without precedent in its duration and intensity, some now believe that these types of events may well become more common as the Earth experiences greater and greater climatic change associated with global warming.
In terms of potential damage to those towers which survived the extreme ice-loading caused by the storm, the general opinion is that these will likely suffer little over the long-term since such an event is a discrete one-time experience rather than presenting a problem of continuous, repetitive heavy loads. Says structural engineering expert Kennedy, “as long as the (truss) members are still straight, I do not see a big problem.”

