Modern technology in signal acquisition and analysis techniques has provided new tools for transformer diagnostics. Of particular interest are dielectric response measurements where insulation properties of oil/paper systems can be investigated. Dielectric frequency response or DFR, (also known as Frequency Domain Spectroscopy or FDS), was introduced over 25 years ago and has been evaluated in research projects and field tests, usually with good results. DFR data, in combination with mathematical modeling of the oil/paper insulation, has proven to be an excellent tool for moisture assessment. Since the modeling theory contains influence of temperature, DFR and modeling can also be used to calculate temperature dependence of the insulation system.
This edited past contribution to INMR by experts at Megger in Sweden, provided a background on DFR as well as on insulation modeling. It also explained how these can improve understanding of insulation properties and be used for assessing condition of insulation on bushings and instrument transformers.
The condition of insulation is essential to ensuring operational reliability of transformers, generators, cables and other high voltage equipment. Transformers with high moisture content cannot sustain high loads without elevated risk. Moreover, bushings and cables with high dissipation factor at high temperature can explode due to ‘thermal runaway’. On the other hand, it’s also important to identify ‘good’ units in the ageing population of equipment. Adding just a few more years to the expected end-of-life of a transformer or bushing can yield substantial savings.

50/60 Hz Dissipation Factor Measurements
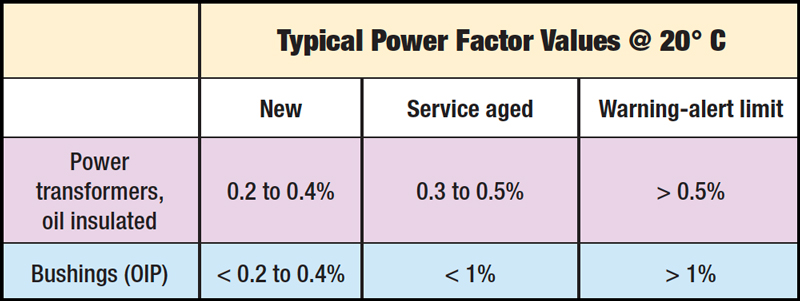
A common insulation diagnostic test is measurement of capacitance and dissipation factor (DF) at 50/60 Hz. This is the standard test performed whenever there is a need to investigate insulation properties. DF tests are typically done at ‘any’ temperature using a test voltage from about 30 V up to about 10 kV for field tests and up to nominal voltage in factory measurements. There are also tests with variable voltage (tip-up/step-up testing) as well as tests where tan delta over temperature is measured. Analysis is based on standards, historical data and comparison against factory values. Since insulation properties are temperature dependent, temperature correction is commonly used for measurements not performed at 20°C. This is normally achieved using temperature correction table values for certain classes of devices. In e.g. IEEE C57.152, IEEE C57.12.90 and CIGRE TB 445, typical tan delta (power factor) values for transformers and bushings are categorized.
Typical temperature correction values are shown in Fig 1.
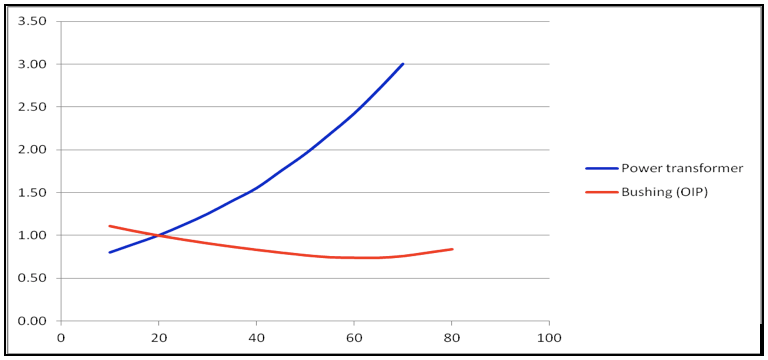
It’s obvious that given values are only approximate guidelines. IEEE C57.152, for example, states; “While the power factors for older transformers will also be <0.5% (20°C), power factors between 0.5% and 1.0% (20°C) may be acceptable; however, power factors >1.0% (20°C) should be investigated.” Moreover, in IEEE C57.12.90-2006 it is stated; “Experience has shown that the variation in power factor with temperature is substantial and erratic so that no single correction curve will fit all cases.”
Dielectric Frequency Response Measurements
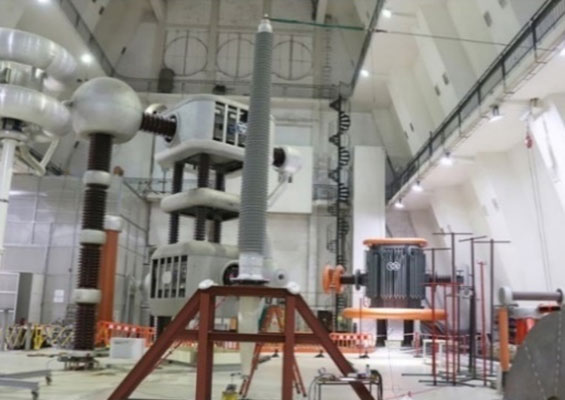
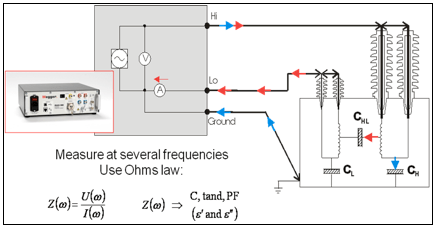
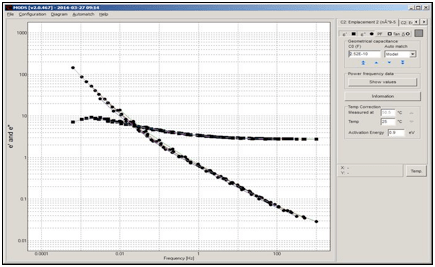
The first field instrument for DFR/FDS measurements of transformers, bushings and cables was introduced in 1995. Since then, thorough evaluation of the technology has been performed. In fact, several international projects/reports define dielectric response measurements together with insulation modeling as the preferred method for measuring moisture content of the cellulose insulation in power transformers. In DFR tests, capacitance and dissipation/power factor is measured. The measurement principle and set-up is similar to traditional 50/60 Hz DF testing but with the difference that lower measurement voltage is often used (140 to 1400 V) and, instead of measuring at line frequency 50/60 Hz, insulation properties are measured over a frequency range – typically from 1 mHz to 1 kHz. The results are presented as capacitance and/or tan delta/power factor versus frequency. Measurement set-up is shown in Fig. 2.
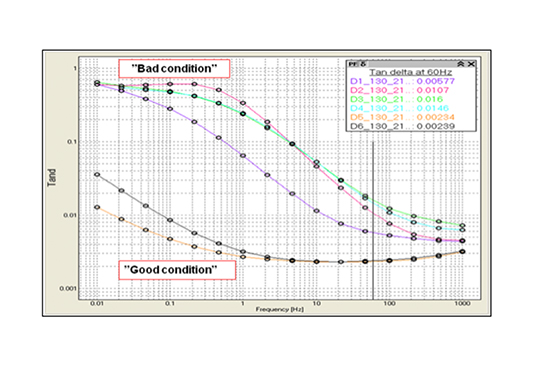
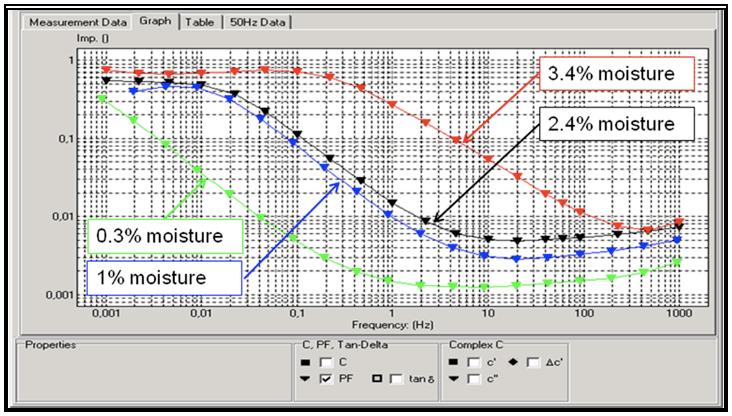
Typical DFR results from measurement on transformers with different moisture conditions are presented in Fig 3.
Moisture Assessment
The capability of DFR to measure dissipation factor as a function of frequency gives the user a powerful tool for diagnostic testing. Moisture assessment is a good example. High moisture levels in transformers are a serious issue since these limit maximum loading capacity and the ageing process is accelerated. Accurate knowledge about the actual moisture content in the transformer is necessary to decide on corrective actions, replacement/scrapping or re-location to a different site in the network with reduced loading. The method of using DFR to determine moisture content in the oil-paper insulation inside an oil-immersed power transformer has been described in detail in several papers and articles, and is therefore only briefly summarized here.
The dissipation factor for an oil/paper insulation plotted against frequency shows a typical inverted S-shaped curve. With increasing temperature, the curve shifts towards higher frequencies. Moisture influences mainly the low and high frequency areas. The middle section of the curve, with the steep gradient, reflects oil conductivity. Fig. 4 describes influence of these parameters on the reference curve.
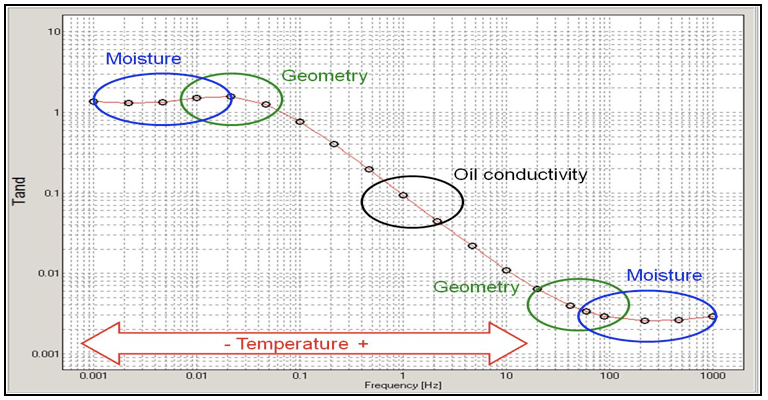
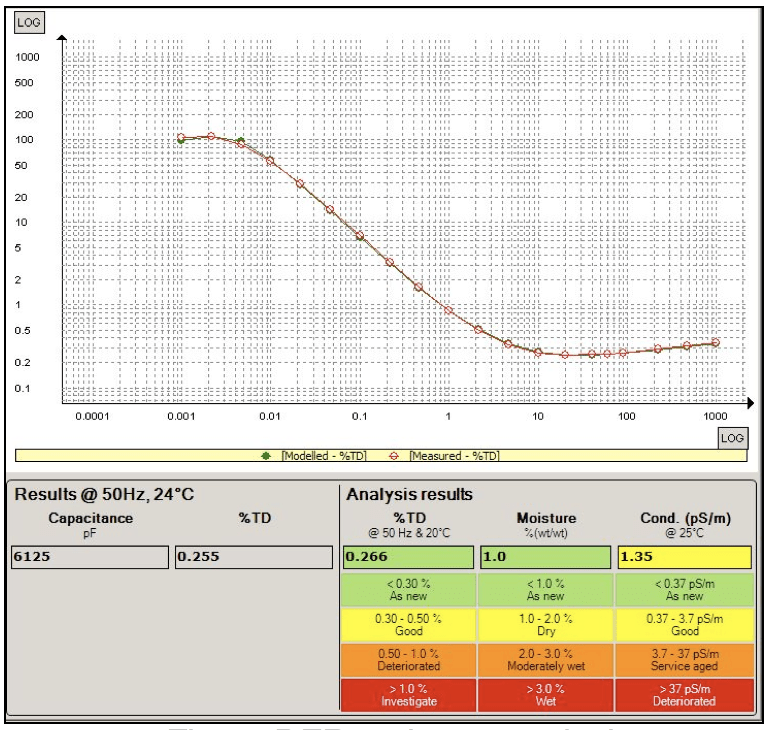
Using DFR for moisture determination is based on comparison of the transformer’s dielectric response to a modeled dielectric response (reference curve). A matching algorithm re-arranges the modeled dielectric response and delivers a new response curve that reflects the measured transformer. The moisture content, along with the oil conductivity for the reference curve, is presented as a result of the test. Only the insulation temperature (top oil temperature and/or winding temperature) needs to be entered as a fixed parameter.
Three different transformers are shown in Fig. 6. The units have the same 0.5%, 50 Hz DF value, typically characterized as ‘warning/alert’ limit status calling for ‘investigation’. Such investigation is done as a DFR analysis.
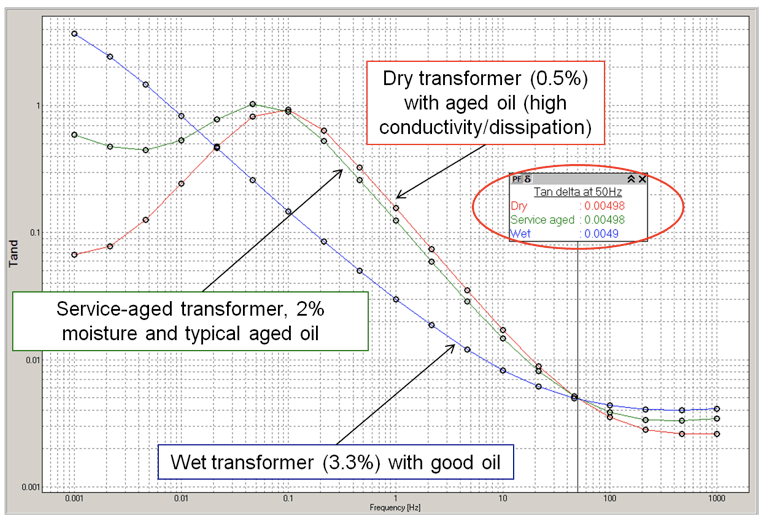
The three transformers are very different and maintenance measures for them would also be different. Transformer 1 has good oil but needs drying. Transformer 3 has low moisture but needs oil change or regeneration. Transformer 2 is in a normal service-aged condition.

Individual Temperature Correction (ITC)
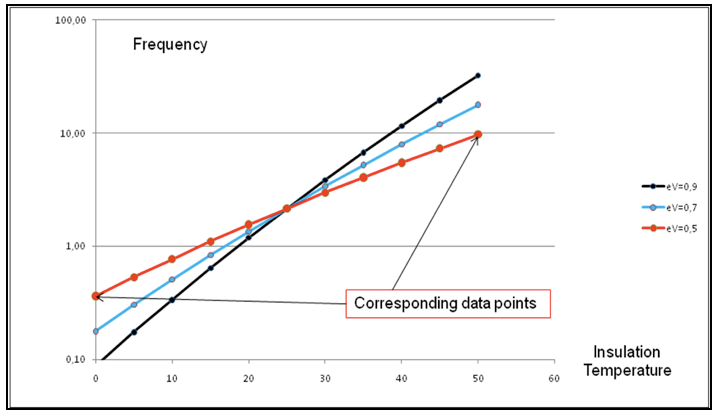
DFR measurements and analysis, together with modeling of the insulation system, also include temperature dependence. A new patented methodology is to perform DFR measurements and convert results to dissipation factor at 50 Hz as a function of temperature. This technique has major advantages in measurement simplicity for bushings. Instead of time consuming heating/cooling of the bushing and doing several measurements at various temperatures, one DFR measurement is performed and the results are converted to 50 Hz tan delta values as a function of temperature. The method is based on the fact that a certain dissipation factor measurement at a certain frequency and temperature corresponds to a measurement made at a different temperature and at a different frequency. The conversion calculations are based on Arrhenius’ law/equation, describing how the insulation properties relate to temperature.
κ = κ0·exp(-Wa/kT)
with activation energy Wa and Boltzmann constant k. This relationship is depicted for single-material insulation and three different activation energies in Fig 7.
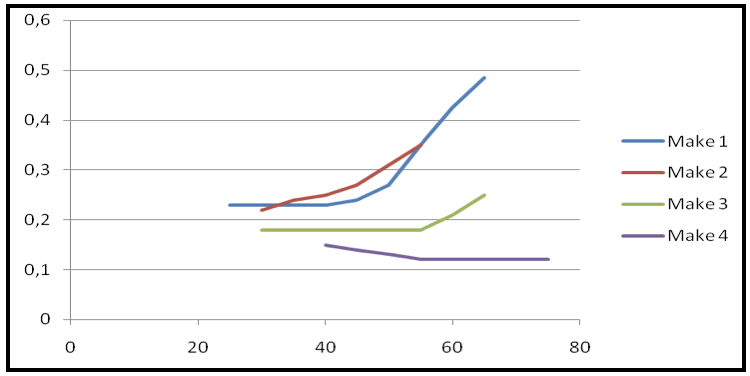
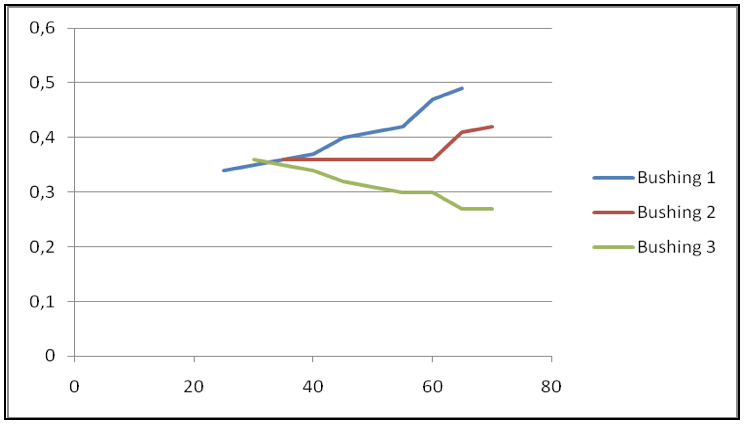
Temperature correction tables (such as in IEEE C57.12.90) give average values assuming ‘average’ conditions and are not correct for an individual transformer or bushing. This is confirmed in field experiments and some utilities try to avoid applying temperature correction by recommending measurements be performed within a narrow temperature range. Examples are shown in Figs. 8 and 9. Dissipation factor was measured at 10 kV on 4 transformers and 3 bushings of different age, condition and at various temperatures. Temperature dependence is very different for the transformers and bushings and using standard temperature correction tables will not give correct values for the 20°C reference value.
With DFR and the technique for converting data to temperature dependence, it is possible to do accurate, individual temperature correction (patent pending). For a ‘good’ component, temperature dependence is weak. When the component gets older and/or deteriorated, the temperature correction factor becomes much larger, i.e. the temperature dependence is a function of ageing status. This observation is in line with several projects and studies.
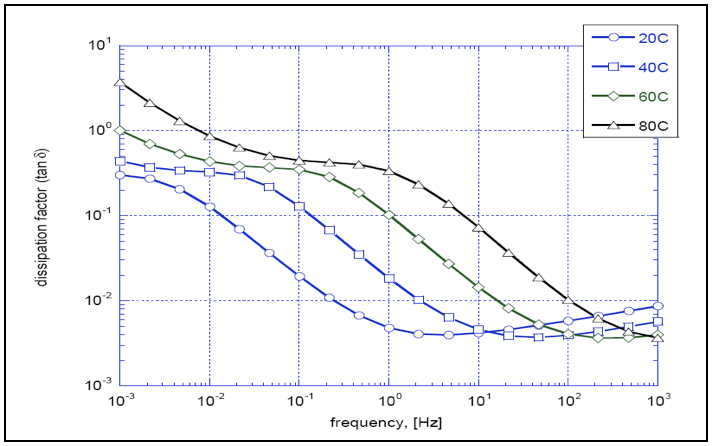
An example of using the technique is shown in Figs. 10 and 11. Samples of kraft paper with various moisture contents were measured at different temperatures. The dielectric response for dry paper (moisture content <0.5%) is shown in Fig. 10.
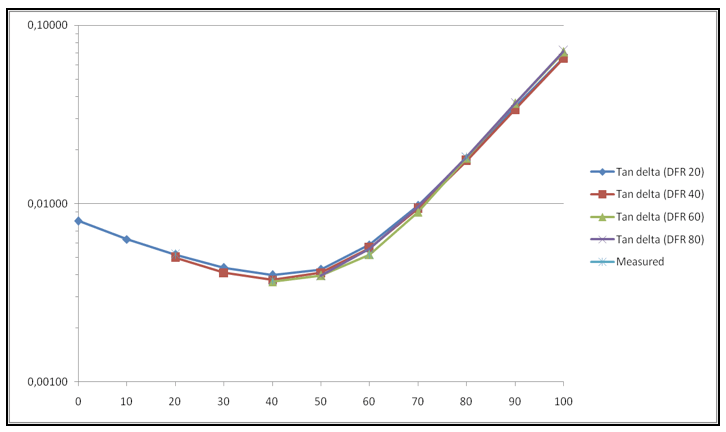
Using DFR technique to estimate temperature dependence based on measurements only at one temperature yields the results shown in Fig 11. As seen, calculated temperature dependence closely matches actually measured dissipation factors at different temperatures.

Bushing Diagnostics
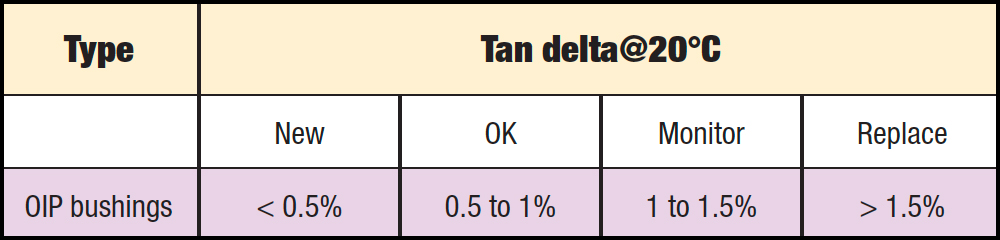
50/60 Hz DF measurements are the most common insulation diagnostic test performed on bushings. C1 (UST) is a common test and typical guidelines for evaluating the C1 dissipation factor are:
• Between nameplate tan delta and up to twice nameplate tan delta – Bushing deemed acceptable
• Between twice nameplate tan delta and up to 3 times nameplate tan delta – Monitor bushing closely
• Above 3 times nameplate tan delta – Replace bushing
Looking at Table 1 and the above guidelines, typical benchmarking values for oil-impregnated paper (OIP) bushings can be identified, as shown in Table 2.
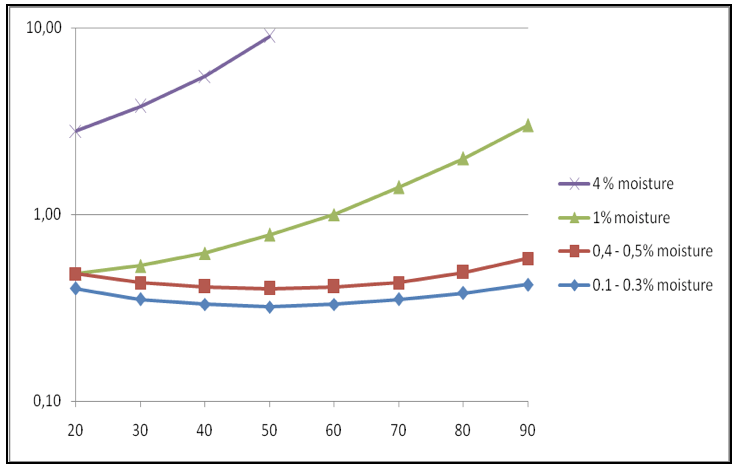
Measuring bushings over temperature – and in particular at high temperature – gives additional information about condition of the insulation and an indication of ageing/high moisture content (see Fig. 12). Increased dissipation factor at higher temperatures is a good indicator of bushing problems. A high dissipation factor at higher temperatures results in increased heating of the bushing, which in turn increases losses causing additional heating, which increases losses even further until the bushing finally explodes.
GE type U – Accelerated Ageing Tests
GE Type U bushings have exhibited a poor record of performance and provided utilities with major asset replacement issues. In one research project initiated by the former Ontario Hydro (now HydroOne) in Canada and Pacific Gas & Electric in the U.S., an accelerated ageing program was performed on 6 x 155 kV Type U bushings involving various diagnostic tests performed on the bushings. The bushings were subjected to simultaneous thermal and electrical ageing.
During the ageing program, 66 kV (nominal line-to-ground voltage) was applied to the bushings. Thermal ageing was accomplished by means of circulating power frequency current through the bushings, starting at 1200 A and slowly increasing to 2000 A. Two bushings (#3 & #4) failed at elevated current (1900 A) during the ageing program. The bushings were selected for test on the basis of tan delta (power factor) measurement results. Two units had low values, two units had high values and two had ‘intermediate’ values (see Fig. 13). Nameplate DF is assumed to be 0.25%. During ageing, periodic and continuous diagnostic tests were performed, i.e. Tan delta, capacitance, DFR, PD, DGA etc. Results from traditional test methods have been reported elsewhere and this paper focuses only on DFR measurement results.
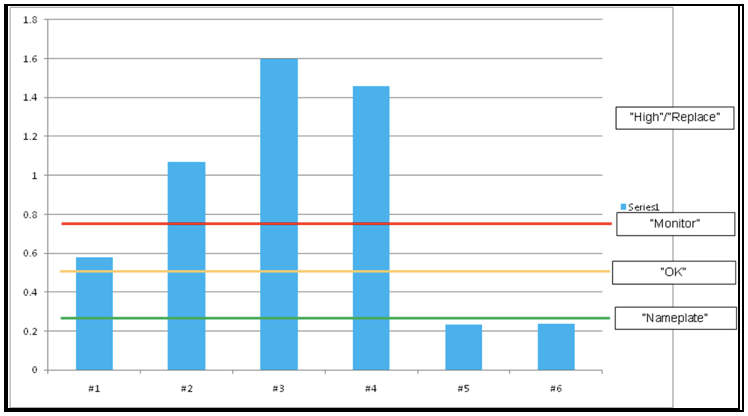
DFR Measurements
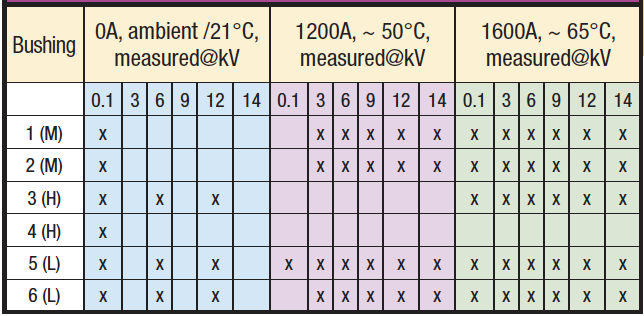
DFR measurements were performed at the beginning of the program. The bushings were tested at various voltages (tip-up tests) and temperatures (see Table 3). Insulation temperatures are estimates based on using DFR data at ambient temperature to determine temperature dependence (ITC).
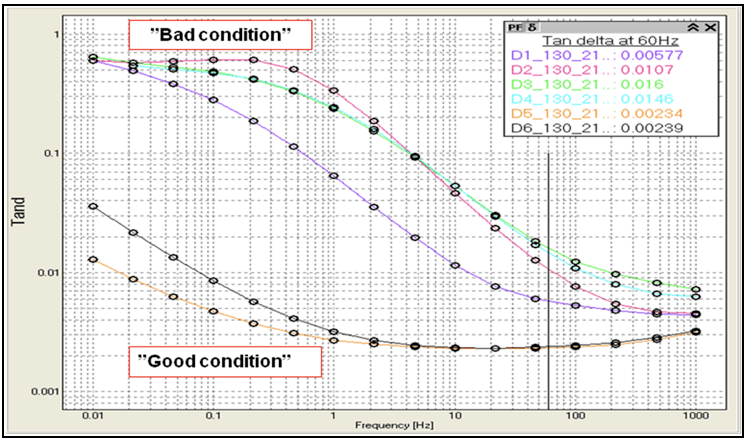
Low voltage DFR results are presented in Fig. 14. Differences in dissipation factors between bushings are much larger at low frequencies compared to 60 Hz values.
Temperature Dependence
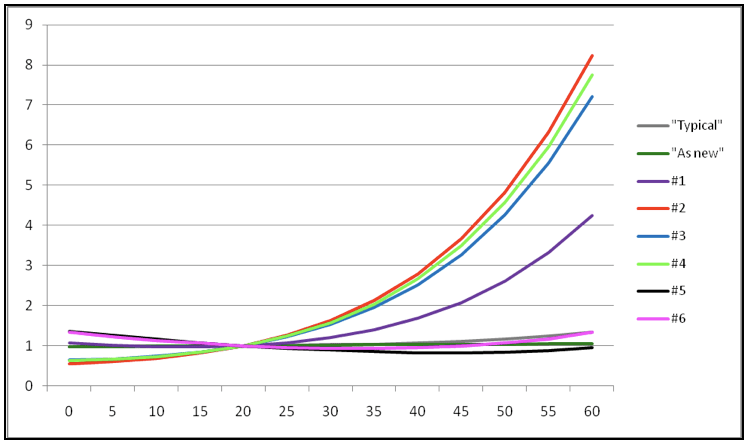
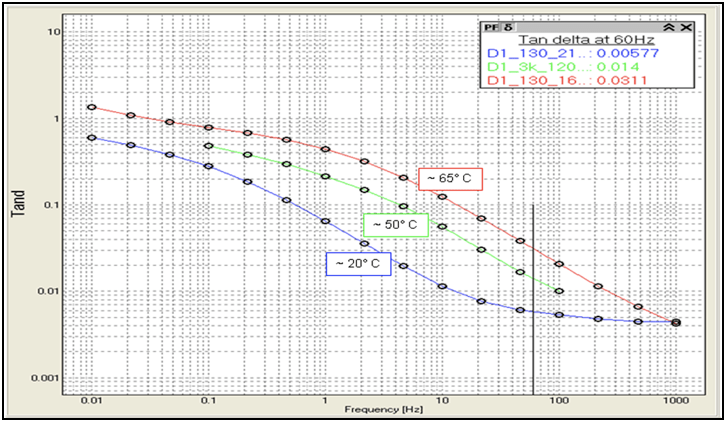
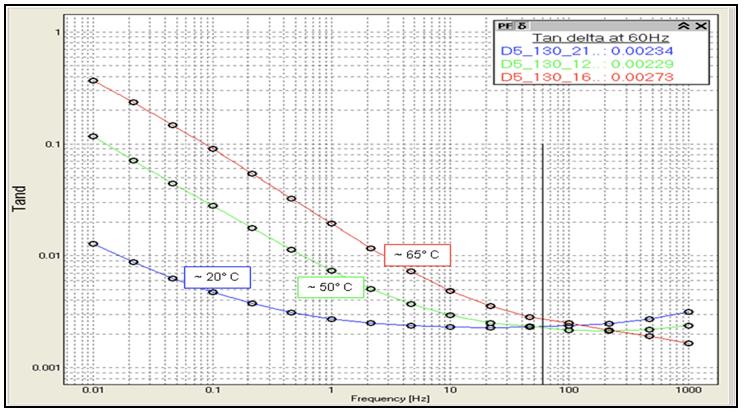
Using the technique described, DFR data can be used to estimate temperature dependence. The results are shown in Fig. 15 as tan delta temperature dependence for the 6 bushings. Temperature dependence for bushings #5 and #6 corresponds to factory data indicating that these bushings are in good condition. The other bushings have higher temperature dependence. Bushing #2, classified as M/ ‘intermediate’ has the same temperature dependence as the ‘bad’ bushings (#3 and #4) that failed during the accelerated ageing test.
DFR measurements at 3 temperatures are presented for two bushings in Figs. 16 and 17.
Tip-Up Measurements
Two tip-up results are shown in Figs. 18 and 19.
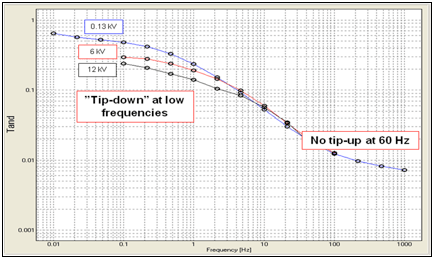
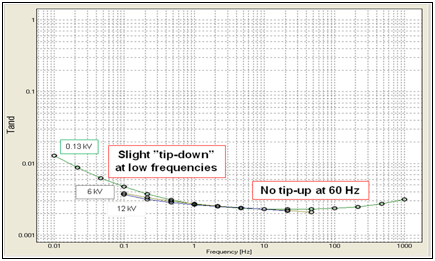
60 Hz tan delta values are almost independent of test voltage and not sensitive to ageing effects. At lower frequencies there is a ‘tip-down’ effect that, for the ‘good’ bushing, is very small.

Current Transformer Diagnostics
Similar experience from a past project has been gained for instrument transformers. In one experiment, for example, 6 current transformers of the same type but in various conditions were measured at temperatures ranging from 25°C to 50°C. Table 4 summarizes the CT units:
The first analysis was to confirm that the insulation material behaves as expected and determine the activation energy for the material. Results showed that the activation energy was 0.9 and quite similar for the 6 units (example shown in Fig. 20).
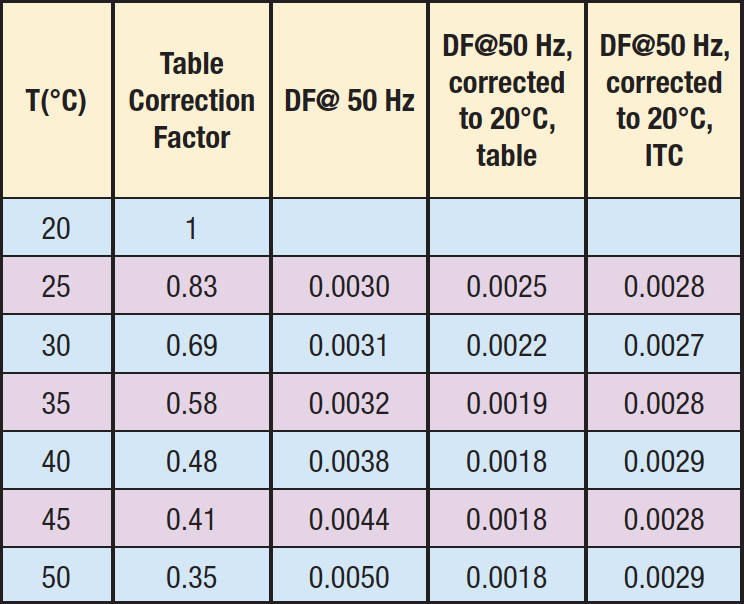
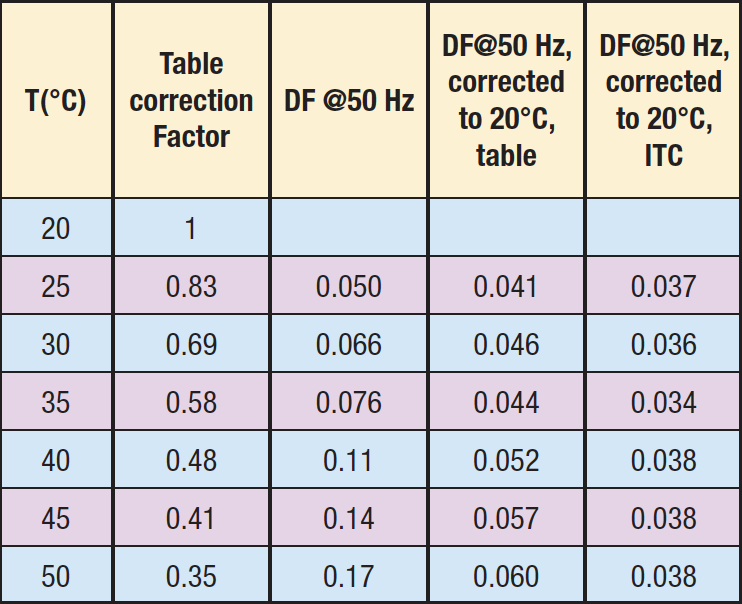
Based on these positive results it is possible to investigate the temperature dependence for the units. Examples are shown in Tables 5 and 6. CT 7 is a ‘good’ unit and in this case, the table correction makes it even ‘better’. CT 3 is a ‘bad’ unit and the table correction makes it even ‘worse’. ITC estimates the correct 20°C value for all the actual temperatures.
As noted in several publications, large temperature dependence is often aligned with a high dissipation factor at low frequencies. This can also be seen for the CTs in this investigation. In Fig. 21, 1 Hz and 50 Hz values are plotted for 4 series of current transformer measurements – in total 26 units.
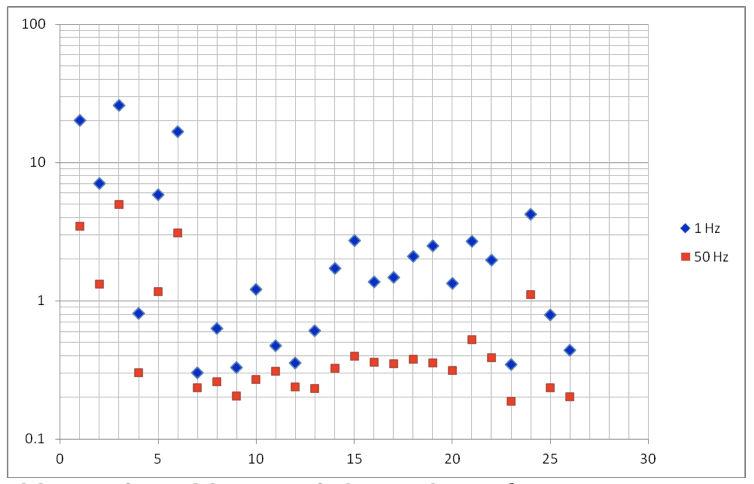
As expected, CTs with high values for 50 Hz tan delta (>1%) also have high values at 1 Hz. However, units with a tan delta within the ‘accepted’ range of 0.2-0.4% may differ significantly when looking at the 1 Hz values. This confirms that the low frequency data and/or the tan delta temperature dependence are better diagnostic parameter than the traditional 50 Hz value – especially when looking for early indications of insulation deterioration.
Discussion
The temperature dependence of the dissipation factor of an insulating material needs to be considered when comparing measurement results between phases, with previous tests or factory values. Historically, this has been done using average temperature correction tables. Results are disappointing and asset owners therefore try rather to perform diagnostic measurements at a specific (narrow) temperature range. The new method of using frequency data and estimating temperature dependence of the actual component offers an alternative to waiting for the ‘correct’ temperature – and then doing the test. It gives the possibility to have correct 20°C reference values and also to make a correct comparison to previously measured non-corrected data at other insulation temperatures. Temperature dependence can also be used as an analysis method for bushings and instrument transformers. Comparing measured temperature dependence with manufacturer data for temperature correction will tell if the condition of the unit is good or not. In insulation diagnostics, high tan delta values at low frequencies and large tan delta temperature dependence (increased dissipation factor at high temperatures) are good indicators of insulation deterioration.
Summary & Conclusions
Dielectric frequency response (DFR/FDS) measurement is a technique for general insulation testing and diagnostics. In comparison with 50/60 Hz dissipation factor measurements, DFR measurements provide the following advantages:
• Capability to perform individual temperature correction of measured 50/60 Hz dissipation factor at various temperatures to values at reference temperature, 20°C.
• Capability to estimate temperature dependence in an object and, based on measured dissipation factor at a certain temperature, calculate dissipation factor at a different temperature.
• Capability to estimate moisture content of oil-immersed cellulose insulation in power and instrument transformers and bushings.
• Capability to generally investigate causes for increased dissipation factor in power components.
Insulation properties are very important in determining the condition of a power system component. Knowing the condition helps to avoid potential catastrophic failure and identifying ‘good’ units and deciding upon correct maintenance can yield significant savings due to postponed investment costs.