Past service experience and laboratory testing revealed risk of great variance in the quality of glass insulators from different manufacturers, depending on raw materials, process and know-how. This finding applied to all components – from the glass shell to metal fittings to cement. Moreover, experts report that it has not always been possible to distinguish insulators of inferior quality based solely on past standard tests. This is because insulators sent for type and sample testing can be specially selected for this purpose. Moreover, requirements for routine testing during production are not always stringent enough to screen out insulators of inferior quality.
Combined with this development, demand for uninterrupted transmission has increased worldwide and especially in Europe. Improved modelling and specialized software have also made it possible to optimize insulator selection and dimensioning, resulting in more highly stressed insulators. All these factors have meant greater need for uniform high quality since the failure of any disk in a string becomes that much more serious.
A decade ago, large power supply companies in Europe co-operated to establish test procedures and criteria that would better reveal the true quality of toughened glass insulators. This edited past contribution to INMR by Kjell Halsan (Statnett), Igor Gutman and Johan Lundengård (then at STRI) provided the impetus for changes to standards, now implemented, and also discussed findings from laboratory testing of glass insulators.


Norwegian transmission system operator, Statnett, has had a policy of closely monitoring the quality of its glass insulators and representatives have attended sample testing for all major deliveries. In addition, operating data on shatter rate per 100,000 glass insulators per year has been collected and analyzed for long transmission lines. These statistics showed that shatter rate of discs can vary significantly among suppliers and sometimes even for different batches delivered by the same supplier. Given this, Statnett conducted a project to ensure purchase of only high quality glass insulators from both existing and new suppliers – with emphasis more on life cycle cost than on acquisition cost.
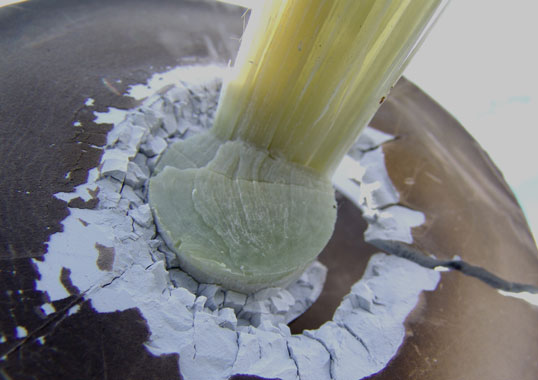
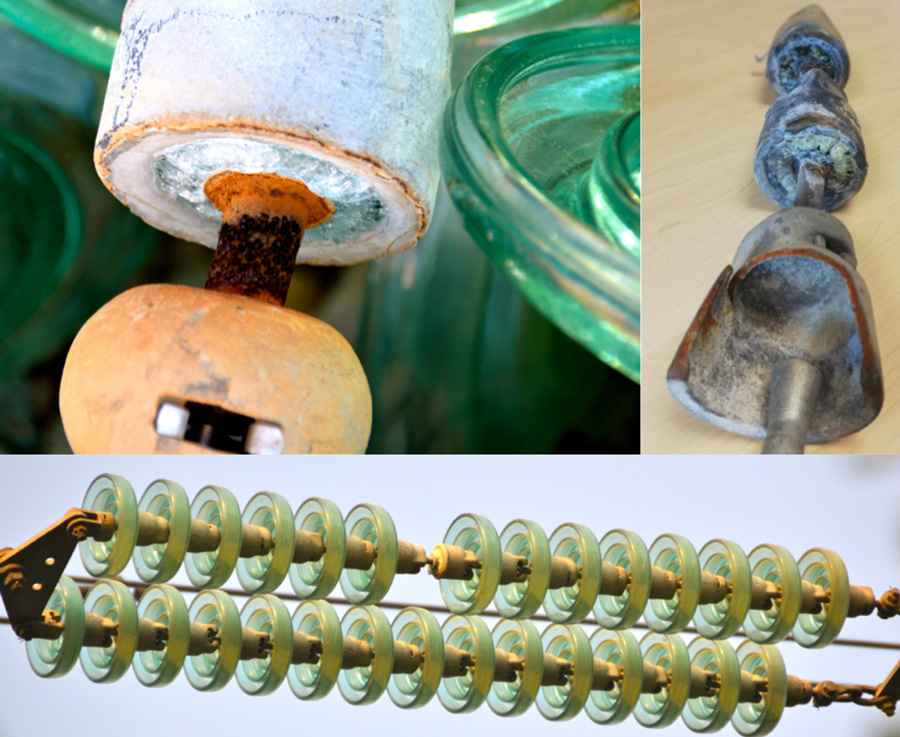
In Sweden, past refurbishment of a 220 kV line by TSO, Svenska Kraftnät, employed glass cap & pin insulators selected on the basis of usual tendering procedures including compliance with IEC requirements. Insulators were installed in a mostly clean but humid area, typical of Scandinavia. Abnormal discharge activity and audible noise were reported on these insulators after only a short time in service, most often when humidity was highest. Field inspection of the line with a daylight UV-camera confirmed the activity and suggested that the insulators could be suffering from defects in their cement.
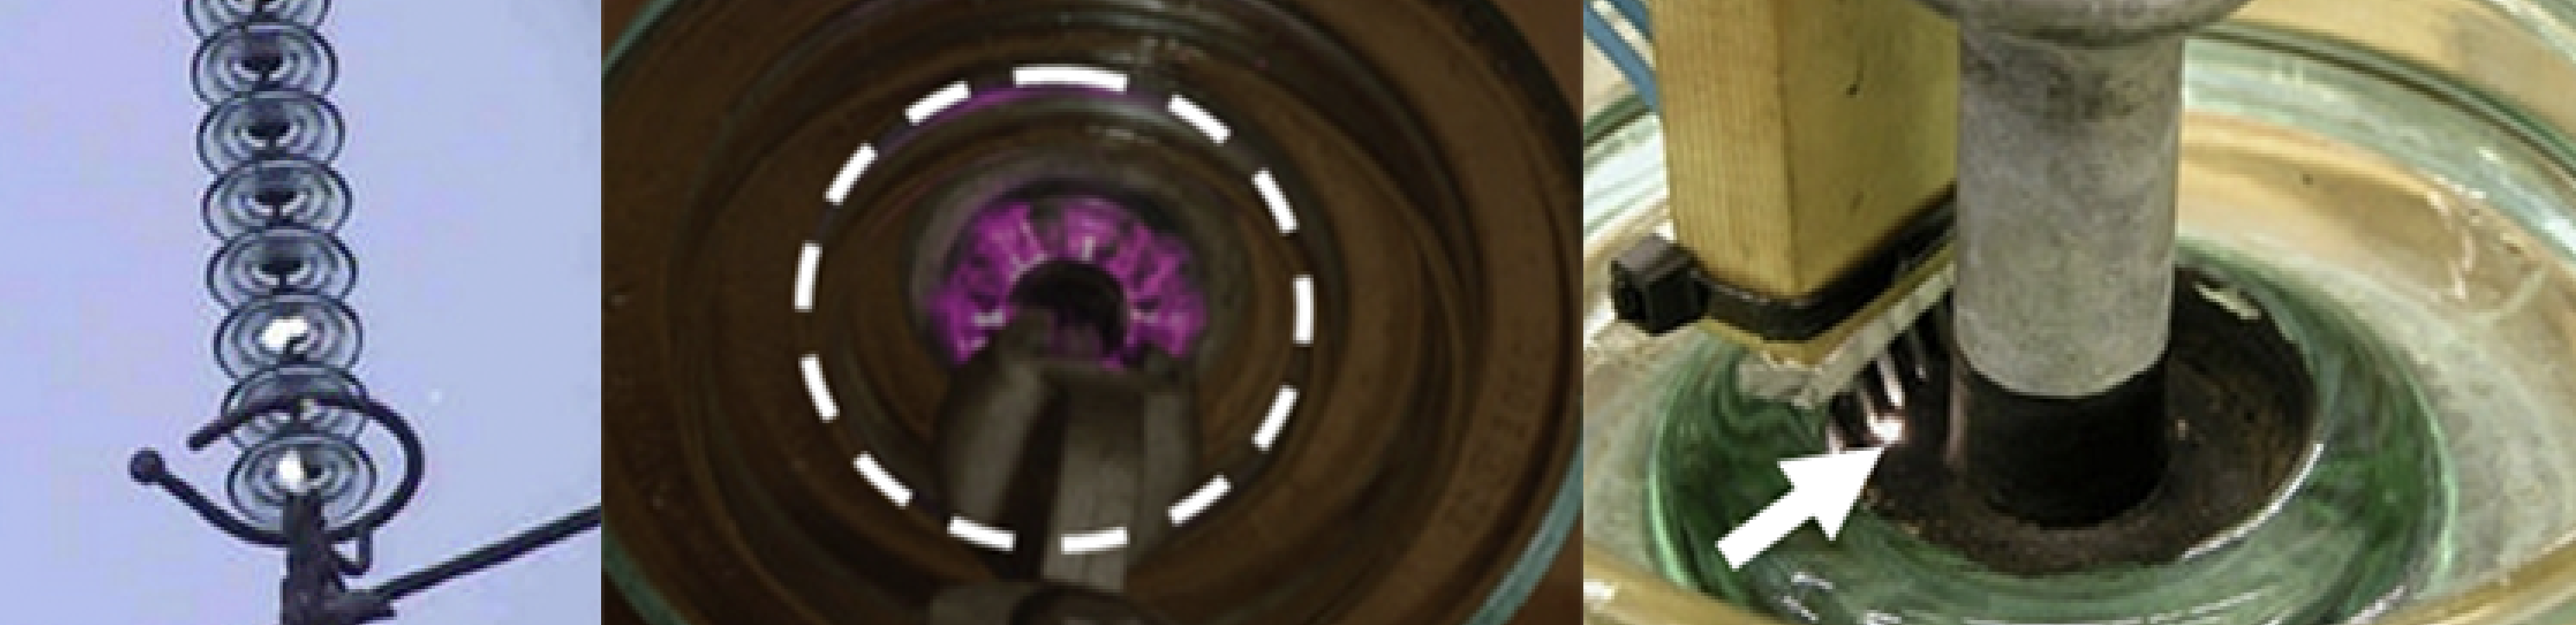
These observations became a concern since such unexpected initial behaviour for new insulators could influence long-term performance. Detailed investigations were performed, including voltage tests at operating voltage, and revealed discharge activity on the glass surface around the pin, just outside the cement. This was especially evident if the electric field distribution in this part of the insulator was affected by water sprayed onto it, to simulate humid service conditions. Resistance measurements using a hand-probe showed that the weakness observed was due to unusually high conductivity as well as unfavourable geometry of the cement. RIV levels, for example, had a wide spread among insulators from different manufacturers and this was interpreted as an indicator of poor quality control.
Given this, it was proposed to expand test requirements for tenders to include RIV measurements at 20 kV and 24 kV to reduce risk of similar problems in the future. Such a requirement is easy to implement and would help ensure that all insulators purchased are more robust with respect to discharge activity under humid conditions.
Preliminary Investigation
The aim of the first stage in the investigation was to identify effective yet practical test methods that could be used to qualify manufacturers in terms of the quality of toughened glass insulators they supply. This included a workshop with experts, discussions with leading test laboratories and manufacturers and a review of the literature. The production process for glass insulators was also examined closely to identify critical issues that can affect final quality. This was then used to identify tests that could be applied to differentiate between good and inferior quality insulators. The following points were highlighted:
• Overview of the components in a glass insulator disc;
• Walk-through a glass disc fabrication process;
• Quality control aspects during manufacture and assembly;
• Relationship between key properties and test methods to verify these.
Subsequently, a combination of the following tests was identified as suitable for more detailed investigation:
1. Steep-front puncture test in air to test the dielectric strength of the glass shell. This test method might need refinement with respect to steepness of the voltage wave applied.
2. RIV testing to verify pin cavity design and quality of cement used. This test was seen as maybe needing modification to verify the longevity of the RIV control measures that manufacturers use, e.g. coating with bitumen.
3. Ultimate tensile test to verify mechanical design. This is a standard test for insulators but could be modified for larger required sample size to better understand failure modes as well as how a manufacturer can control mechanical failure.
4. A test verifying residual mechanical strength can be an important tool to verify that, even if an insulator breaks, the conductor will not be dropped.
5. Thermal shock test to check the quality of the glass shell.
The first two, i.e. impulse puncture (called further steep-front) test and RIV test were subsequently chosen for the preliminary verification.
From discussions during this phase of the project, it was also concluded that testing alone might not always guarantee quality. Buyers would also need to implement a process for them to evaluate the quality control procedures used by the manufacturer. This would include regular factory inspections to ensure that these procedures are always implemented during production. In addition, a library of photos was created to assist the inspector to visually identify potentially problematic units for subsequent sample testing.
In this project phase, an overview of the entire manufacturing process was created to highlight important process parameters to be scrutinized during any factory visit. This guide (or questionnaire) would make it easier for a representative from the power supply company to go through the production and quality control processes of any manufacturer.

Limited Laboratory Testing
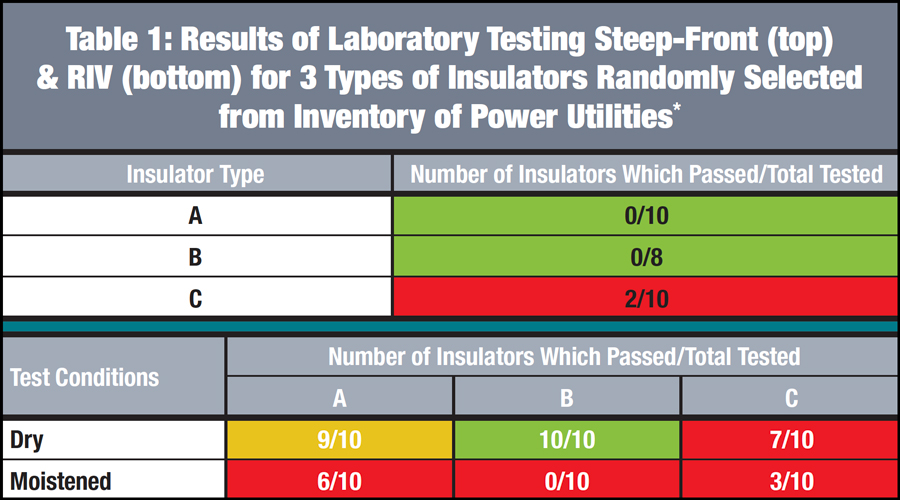
Limited testing was performed on 3 types of glass insulators selected from inventory at Statnett and Svenska Kraftnät. The aim was to conduct comparative testing on insulators assumed to have different levels of quality, i.e. ‘high’, ‘acceptable’ and ‘low’. These insulators were subjected to only two types of tests, selected as the most promising based on the literature, opinion of experts and previous tests performed for these power companies. The two tests were: RIV testing in dry/wet conditions followed by resistivity measurements of the cement; and steep-front testing (i.e. impulse puncture withstand test in air).
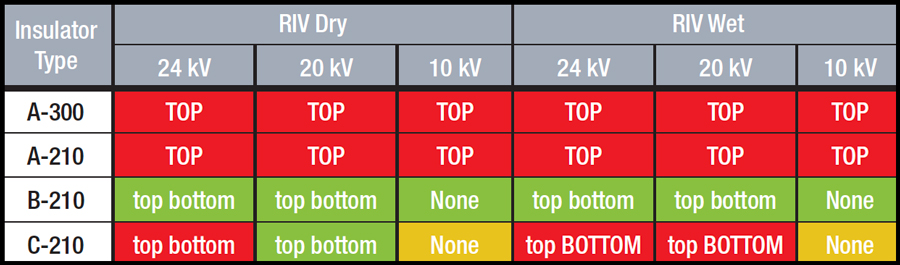
The RIV test was performed according to Swedish standard SS 447 10 11 (1984). A pre-stress voltage of 30 kV was applied for 5 minutes after which the RIV level was read at test voltage reduced to 24 kV. Then, test voltage was decreased to 20 kV and the RIV level was read once more. According to this standard, the RIV level must not exceed 60 dB (µV) at 20 kV.
Steep-front testing was performed according to IEC 61211 cl. 5.6 and Canadian standard CSA C411.1-10 cl. 6.6 and witnessed by representatives from STRI and Statnett. The results (Table 1) demonstrated that both tests were able to reveal insulators with ‘low’ quality in two of their elements, i.e. cement and glass. As such, it was recommended that these tests be part of an extended test matrix.
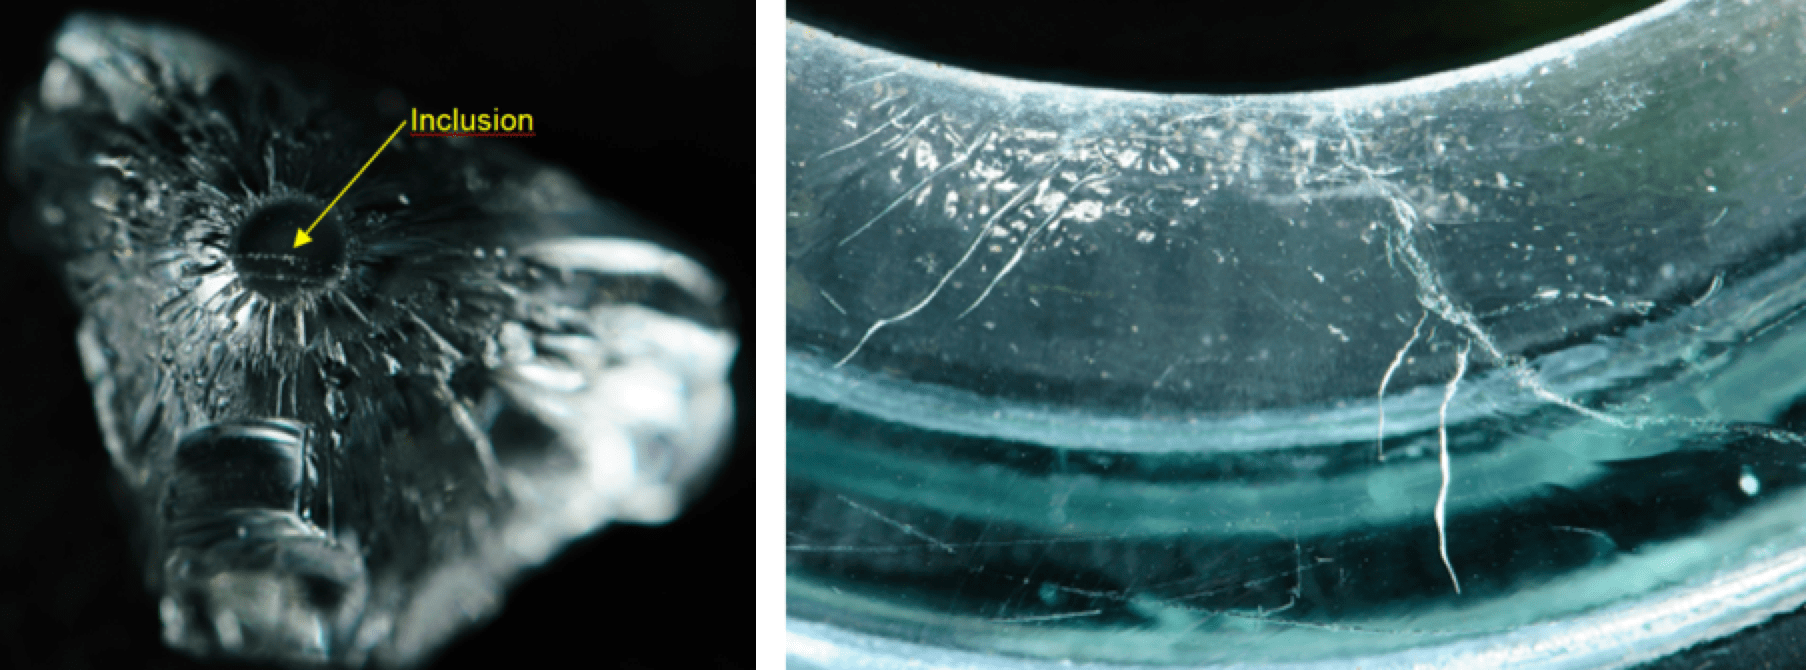
As one useful finding, results of initial laboratory testing showed that test insulators should be randomly selected since it seemed that manufacturers could produce a smaller batch with better quality insulators. Another practical output was that 8 out of 10 insulators randomly selected from one batch in storage failed the steep-front test by shattering. This confirmed not only the need for further work to prevent such insulators from ever reaching the stocks of power utilities but also the importance of carrying out steep-front as a sample test on randomly selected unit.
Development of New Test Matrix & Criteria
The aim of this phase of the project was to evaluate whether or not the test methods selected would be able to reveal insulators of variable quality. This would be accomplished by collecting a selection of insulators of differing quality such that some would be expected fail (thereby confirming that the test matrix can catch these) while some would be expected to pass (verifying that the test matrix was not unreasonably stringent). It was decided not to request the test insulators from manufacturers. Instead, these were selected at random from batches already purchased by participating power companies for line construction and refurbishment. In total, batches from 5 different suppliers with factories all over the world were chosen. Moreover, based on the specific request of participating utilities, the mechanical strength classes were limited to: 120 kN, 210 kN and 300 kN.
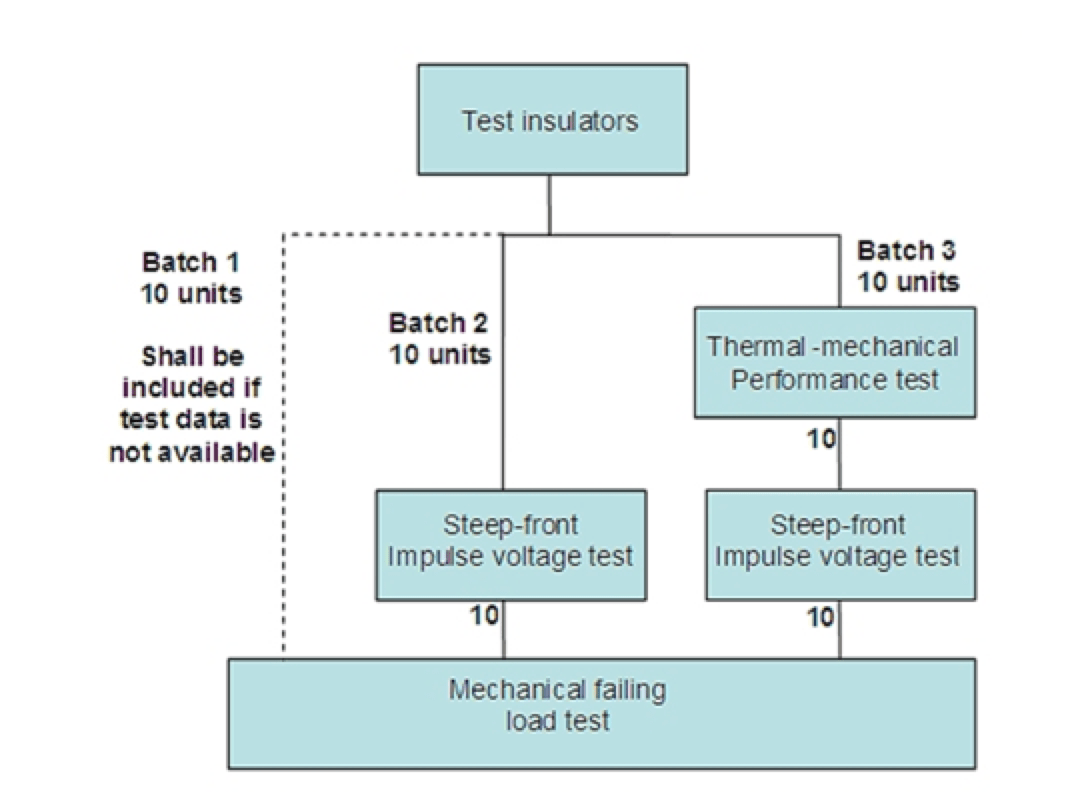
The results of 3 types of tests, i.e. RIV test (performed at STRI), steep-front test and thermal-mechanical test (both performed at EGU) were presented in a paper at the CIGRE General Session in 2014. In order to verify how different tests can affect and reveal insulators of poor quality, a test program according to the scheme proposed by the CSA (outlined in Fig. 2) was performed using 3 different types of glass insulators, with 30 units of each type.
When comparing test results from the mechanical failing load test on the same type of insulators, no significant variation was found between the 3 groups of insulators going through different numbers of tests (batch 1, 2 or 3). Problems with quality of glass discs were revealed during the thermal-mechanical test, steep-front test and mechanical failing load test. Thus, it was proposed not to use the thermal-mechanical test to pre-stress the glass before the steep-front test since it was felt this would be overly complicated.
The test program concentrated on RIV and steep-front tests and details on both test methodologies are as follows:
RIV Test
A pre-stress voltage of 30 kV was applied first for 5 minutes (before the RIV level was read). Test voltage was then decreased to 24 kV and RIV level was read again at this voltage. Then, test voltage was decreased to 20 kV and RIV level read once more. The same procedure was applied for dry and for wet insulators. Wetting the insulators was done by placing them upside-down and pouring de-ionized water onto the cement area close to the pin. The insulators were moistened this way for 15-20 hours before the test. The acceptance criterion to check if the lot passes the RIV test will be according to the formula: Average RIV level ≤60 dB-Risk factor x Standard deviation. Risk factor for 20 kV is considered as 1.6 and 1.2 for 24 kV. Application of the risk factor formula will make it more difficult for insulators having a large spread to pass. As such, there is already additional quality control.
Steep-Front Test
Tests were performed according to IEC 61211 cl. 5.6 with a series of 5 positive, 5 negative, 5 positive and 5 negative impulses. Based on preliminary results, it was decided that no impulses with reduced amplitude should be applied between polarity changes. Test voltage for the steep-front was according to IEC 61211. At relevant steep-front test voltages, each impulse resulted in flashover. The acceptance criterion was according to C411.10.1, i.e. the insulator passes if every steep-front impulse voltage application results in external flashover and the test record or peak voltage indicator does not show a large reduction in voltage between impulse applications. To evaluate results from the complete batch tested, it was decided to apply acceptance criteria in accordance with IEC 61211, cl. 5.8, i.e. requiring that no punctures are accepted. If only a single unit is punctured, a re-test procedure shall be applied. Also, punctured units shall be included in the mechanical failing load test.
After the steep-front test, all insulators were subjected to the mechanical failing load test performed according to IEC 60383-1 cl. 19.2. The acceptance criterion according to CSA C411.1-10, cl. 6.13.2 was used. Similar to the risk factor formula applied for results of RIV testing, the CSA has a formula to evaluate results of the mechanical failing load test: Quality factor Q=4≤ (Average failing load-Rated failing load)/(Standard deviation). A summary of these tests is presented in Table 2 that outlines results for 16 insulator types. It is clear the tests revealed different qualities of insulators.
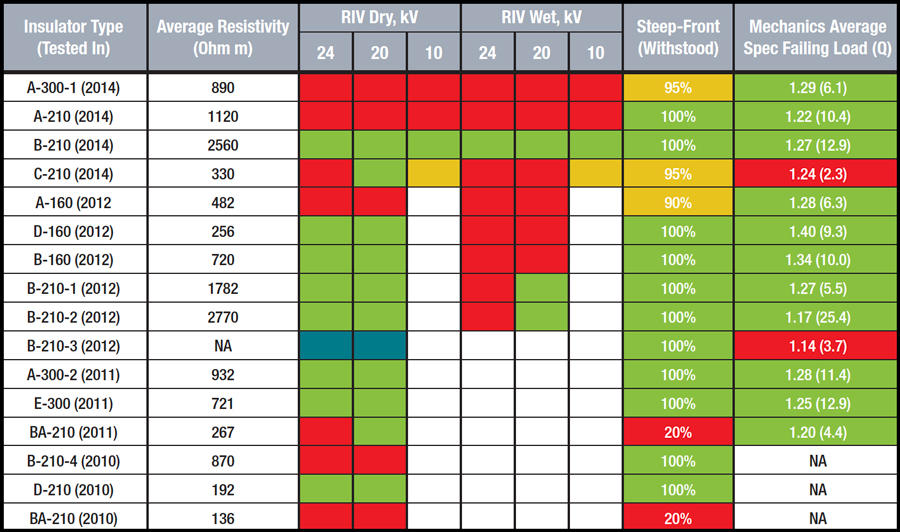
Table 2: Summary of Test Results
(BA is anti-fog insulator, others standard profile)

Discussion on RIV Tests
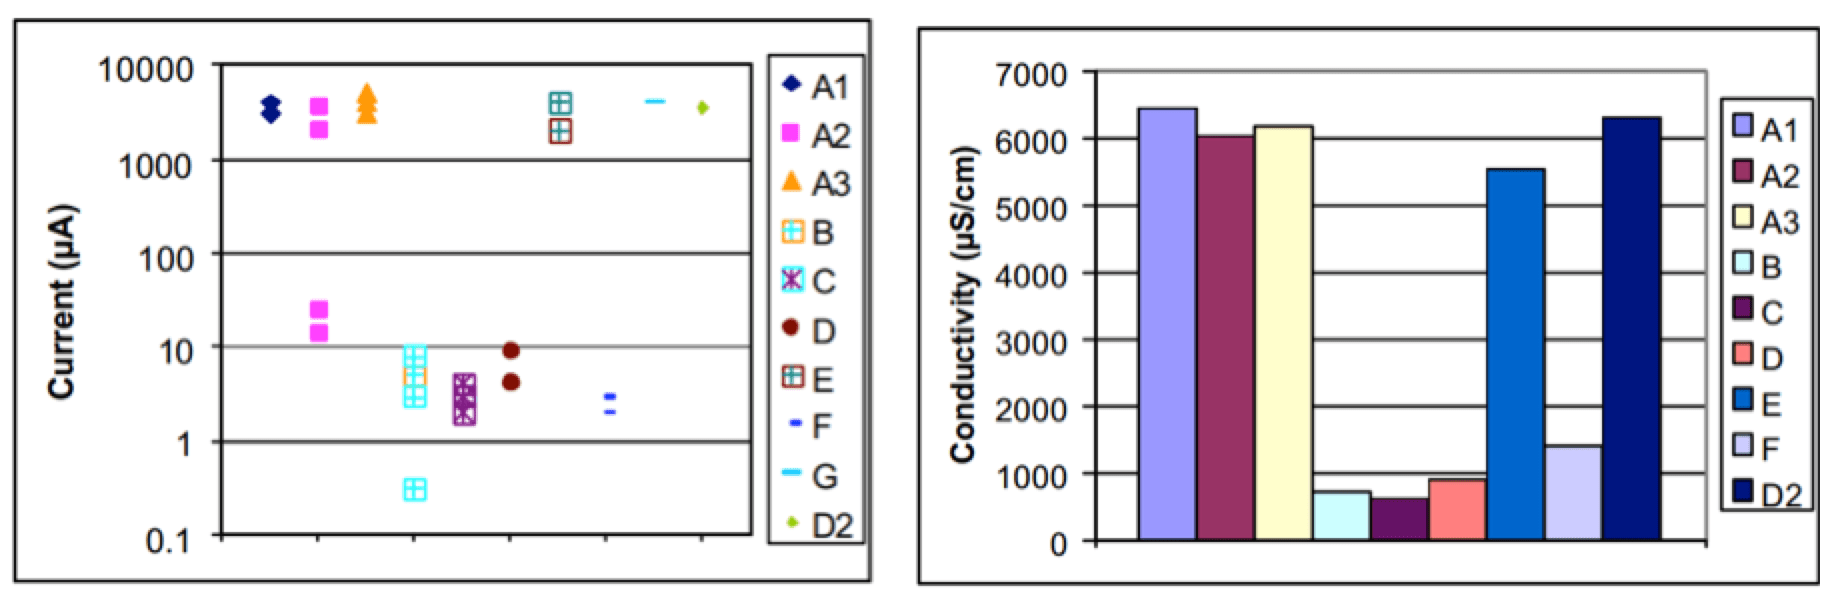
Conductivity measurements provide some indication of possible issues with cement under humid service conditions, i.e. high RIV levels. However, there is no clear correlation to RIV testing. For example, some Type ‘A’ insulators that failed the RIV test showed little or no resistivity of their cement and partial discharge activity came from the bottom of the cap. During the latest series of tests, performed in 2014, it was found that two cameras should ideally be used to allow simultaneous observation of discharges from the top or bottom as this could occur with different insulator designs.
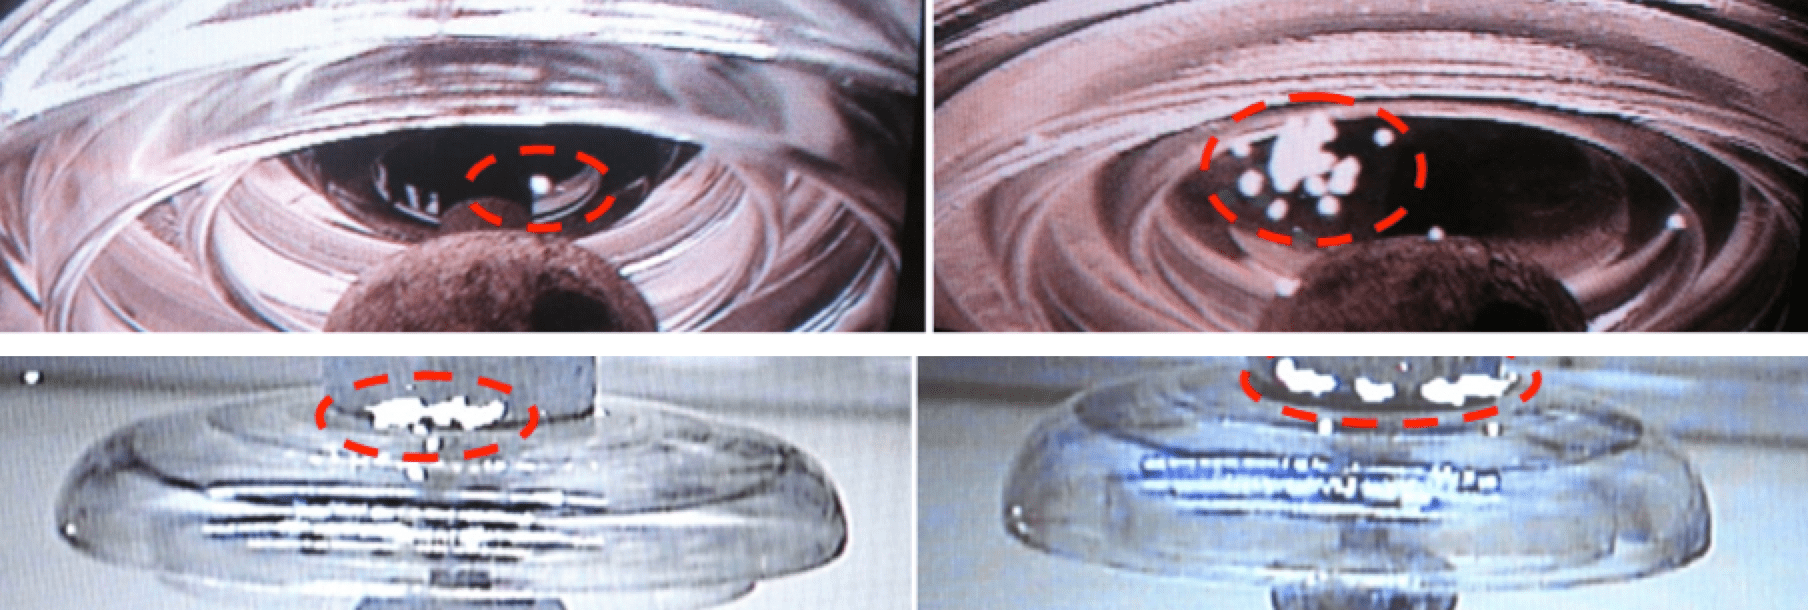
There is information in the literature that glass insulators experiencing partial discharges between the cap and disc (i.e. at the top) will also have a higher shatter rate due to deterioration of the surface. Indeed, in this project those insulators with high RIV activity between the cap and disc had an abnormally high shatter rate in service.
It therefore seems logical that when evaluating an insulator for purchase, a power supply company should carry out an RIV test under dry conditions. This should be done at the maximum possible level of voltage for the shortest typical string length for that voltage class. For example, in the case of the TSO in Sweden, this can be 24 kV for 400 kV overhead lines, whereas it might be 20 kV for Statnett or CEPS, the TSO in the Czech Republic. It would also seem reasonable to apply the same criterion for the RIV test under humid conditions, although results in this case suggest that this might prove too strict a test criterion. Therefore, further analysis of all results will be made, taking into account which insulators were considered as acceptable and then changing the risk factors of 1.2 and 1.6.
From all test results presented, it can be seen that the batches where glass shells shatter during the mechanical failing load test also have a higher probability of failing the steep-front test. However, at present both tests are still felt necessary. This is because of the distinct difference between a steep-front test and a mechanical failing load test. In the case of the former the glass shell is put under very high electrical stress, whereas in the latter mechanical load is increased to the maximum tension stress that results in mechanical separation of the insulator.
Proposed Test Matrix & Criteria
The proposed test matrix should consist of 3 tests: RIV, steep-front and residual strength. The guidelines for the requirements and criteria have been developed in the framework of this project and are shown in Fig. 3.
Summary
The two key issues under focus, i.e. high RIV levels and varying shatter rate, can be revealed by additional tests. Based on a comprehensive research program performed between 2009 and 2014, the following tests have been verified and are recommended to verify the quality of glass cap & pin insulators supplied by different manufacturers: modified RIV measurements under dry and wet conditions; modified steep-front test; and modified residual strength test. Actual test methods have been discussed and an important point is to ensure that insulators for these tests are selected in a random manner.