Zinc oxide surge arresters can degrade over time due to moisture ingress and compromise the reliability of a power system. However, traditional online and offline techniques to diagnose their condition can be complex and difficult to implement in many real-world scenarios.
This edited contribution to INMR by D. A. Da Silva at the Military Institute of Engineering in Brazil proposes a simple, qualitative condition assessment based on analyzing the plot of instantaneous applied voltage versus total leakage current. This method focuses on identifying changes in this graphic, which correlates with an increase in the resistive current component—a key indicator of degradation from moisture ingress.


While zinc oxide surge arresters are reliable, they are exposed to thermal, electrical and environmental stresses that can lead to degradation mechanisms. These include moisture ingress, increased resistive current, and deterioration of their housing material. Such issues compromise power system reliability and highlight the importance of effective diagnostic methods and condition-based maintenance (CBM) strategies.
Diagnostic techniques for surge arresters are divided into online and offline approaches. Online methods—such as leakage current monitoring and third-harmonic analysis—are widely used since they allow for continuous condition assessment without interrupting system operation. Advances in signal processing, including discrete Fourier transform (DFT), Prony analysis, and correlation techniques, have further improved diagnostic accuracy – even under distorted supply conditions. Additional indicators such as measuring active power loss and infrared thermography are also being employed to detect localized heating.
Emerging approaches, such as frequency response analysis (FRA) and artificial intelligence (AI)-based classification are now showing promise for more advanced fault diagnosis. Nonetheless, offline diagnostic techniques will continue to remain valuable for in-depth evaluation, especially for critical assets such as arresters.
Tests such as reference voltage measurement (Uref) and dielectric loss factor (tan δ) provide robust indicators of arrester ageing and internal deterioration. However, these methods require equipment shutdown, which limits their suitability for continuous monitoring. As a result, hybrid strategies that combine online and offline diagnostics are being explored to enhance reliability while minimizing operational disruptions. Recent developments are moving toward integration of smart sensors, IoT platforms, and machine learning models, paving the way for predictive maintenance of surge arresters.
In any case, most condition monitoring techniques for surge arresters imply a level of complexity that can make these difficult to implement. In this context, this research investigated the pattern created by the graphic of applied voltage x total leakage current measured on polymeric surge arresters during a modified immersion test. The idea was to identify significant changes in this pattern and correlate these with an increase in the resistive current component, which signals degradation by moisture ingress. Here, the immersion test is an accelerated test to speed up the degradation process. Pattern recognition is then a first step towards signal image processing applied to surge arrester condition monitoring.
To better understand how surge arresters can be affected by moisture, the following section reviews aspects related to the permeation process through polymeric materials. This is followed by a description of the methodology used in this research as well as a summary of results and conclusions.

Permeation Mechanisms in Polymeric Membranes
In the context of permeation through polymers, moisture (i.e. water vapor) is treated as a gas molecule. When water is in vapor form, it behaves as a penetrant gas and follows the same permeation mechanism as other gases:
• absorption of water vapor at the polymer surface;
• diffusion through the polymer matrix; and
• desorption on the opposite side.
What makes moisture particularly important is its strong polarity and high affinity for many polymers. This can accelerate diffusion, increase swelling, or even change a polymer’s microstructure compared to non-polar gases such as O2 or N₂. For that reason, moisture in permeation studies is often modeled and quantified like a gas molecule.
When evaluating polymeric materials, gas permeation occurs when a pressure gradient is established between opposite interfaces. This process depends on several factors, including polymeric properties (e.g. crystallinity, additives, fillers), characteristics of the permeant (such as chemical affinity and concentration), and environmental conditions including temperature, pressure and humidity.
Among the three stages involving permeation (i.e. absorption, diffusion and desorption), diffusion is usually the slowest and therefore the rate-determining step. In most practical cases, it can be described by Fick’s Laws of Diffusion. Although diffusion coefficients are commonly determined using flat polymer films (thereby simplifying modeling and analysis), such an approach could lead to discrepancies for more complex geometries, such as present in surge arrester housings. Nonetheless, it remains an accepted method for characterizing permeation behavior in polymers.
An approach to calculate diffusion through a membrane is defined by the Fick’s First Law, which relates diffusive flux to concentration field. The flux goes from regions of high concentration to regions of low concentration, with magnitude that is proportional to the concentration gradient:
J=-D∙∇c (1)
where, J is the penetrant flux through a material;
D: is the diffusion coefficient or diffusivity;
∇c: is the concentration gradient of the penetrant over the polymer membrane.
The minus sign indicates that diffusion occurs in the direction of concentration decrease.
Fick’s Second Law can be derived from his First Law and mass conservation in the absence of any chemical reactions. For unidirectional diffusion and for homogenic and isotropic materials, the usual form of Fick’s Second Law is:

where t: is time;
x: direction of flux.
Considering a steady state is used to calculate diffusion through a membrane.
However, concentration gradient, ∇c, can only be determined if solubility of the permeant in the polymer surface is known. This dependence appears because the concentration of the permeant at the entering surface depends on solubility.
Although Henry’s Law is applied for gases that become liquid at far from standard temperature and pressure (0ºC and 1 atm), a special assumption can be made in cases where the concentration of the penetrant is low and the material involved in moisture absorption/transport is a hydrophobic polymer. For this case, Henry’s Law is obeyed over the complete range of relative pressures, in the form:
c = S∙p (3)
where c: represents the concentration of penetrant in the polymer;
p: the partial pressure of penetrant at the interface.
In the steady state, Fick’s Law can be written as:

where l: thickness of membrane;
P: permeability coefficient;
∆p: pressure difference between sides of the membrane.

For simple gases, a general relationship between the three main permeation properties: permeability (P), solubility (S) and diffusivity (D) is almost exactly valid:
P=S∙D (5)
In cases where the permeability coefficient for a gas/polymer system is independent of pressure, the temperature dependence of P and D can be represented over small ranges of temperature by the Arrhenius-type relation.

Diffusion coefficient, D, depends on temperature and the nature of the penetrant/polymer system and can be constant or a function of penetrant concentration.

Whereas temperature dependence of S is expressed by the Van’t Hoff-type relation.

where P, D, S: permeability, diffusion or solubility coefficients;
P0, D0, S0: pre-exponential factors;
Ep, Ed: activation energy of permeation or diffusion;
∆Hs: enthalpy of solution;
R: universal gas constant;
T: absolute temperature.
The above equations provide an indication about permeability, diffusion or solubility coefficients values. However, a polymers’ molecular structure as well as its composition and the way it was processed present a highly complex system. Therefore, to obtain precise results, it is necessary to carry out an experimental analysis for each specific housing formulation. Even then, data is representative only of polymer permeation but does not mean that permeation through the entire surge arrester will follow accordingly.
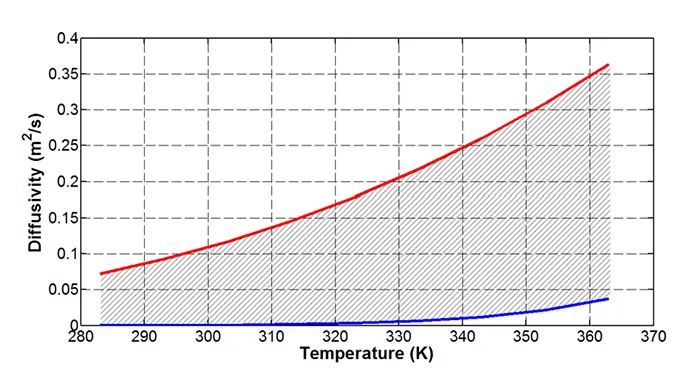
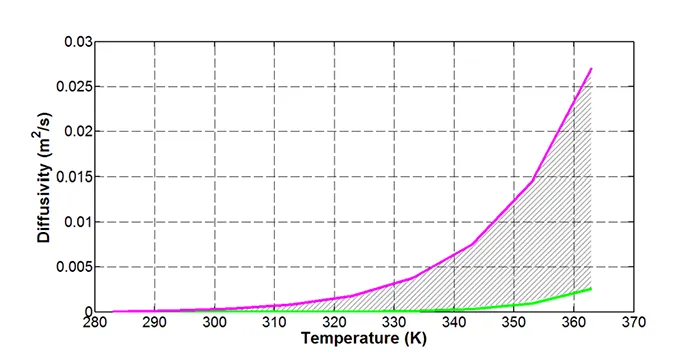
For example, comparing the theoretical diffusion coefficient for water vapor through silicone rubber (see Fig. 1) and through ethylene vinyl acetate (see Fig. 2), shows that vapor will diffuse much slower in EVA than in silicone. Since silicone rubber is hydrophobic, this might seem odd. However, it is important to consider that the smallest penetrant (i.e. H2O) has highest solubility and can diffuse even in a hydrophobic polymer.
For a simple gas-polymer system, polymers with lower Tg present higher diffusion coefficients. In the case of silicone rubber, the glass transition temperature typically ranges from approximately 148 K up to 203 K while for EVA it can be between 256 K and 261 K, depending on formulation and measurement method.

Materials & Methods
Below is a brief description of the surge arresters used in this research as well as the immersion and measurement procedures. It also introduces the concept behind condition monitoring based on a graphic profile/pattern of voltage-total leakage current. It is important to note that even though this article only describes 3 surge arresters (the most interesting cases), the research was actually much larger. The methodology was verified for 35 surge arresters from 9 manufacturers and at 3 temperatures (80°C, 90°C and 100°C).
A. Surge Arrester Details & Experimental Procedures
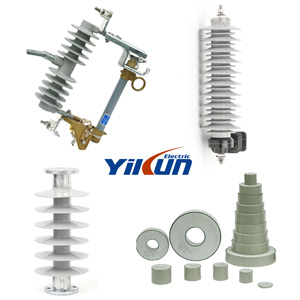
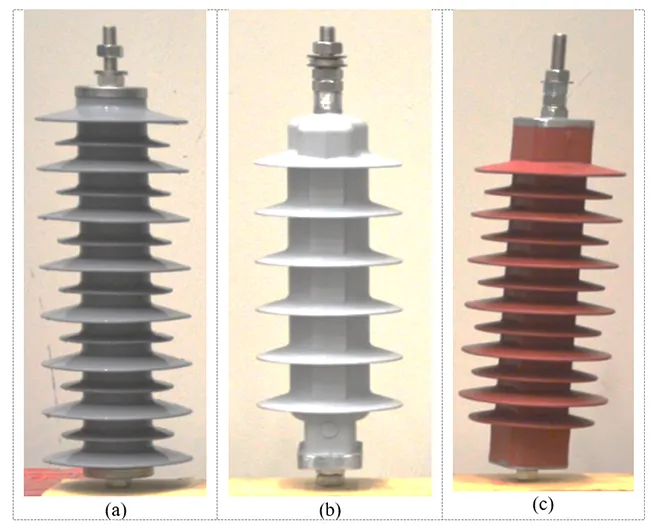
The surge arresters presented comprise 3 different designs. The Type A surge arrester is manufactured with a silicone housing molded directly over a fiberglass cage that surrounds the varistor blocks. The Type B surge arrester employs an internal structure consisting of two longitudinally positioned reinforced plastic rods, aligned along the sides of the varistor blocks and mechanically connecting the internal terminals, over which the polymeric (silicone) housing is directly molded. The Type C surge arrester differs by incorporating an ethylene-vinyl acetate (EVA) polymeric housing. Its internal structure is reinforced by two plastic fiber rods, one positioned on each side, providing mechanical robustness while maintaining proper alignment of the varistor blocks. Fig. 3 shows these samples.
The surge arresters were subjected to an accelerated ageing procedure consisting of immersion in de-ionized water maintained at 80°C using a thermostat. Sodium chloride was added to the water at a concentration of 1 kg/m³. It is important to emphasize that, although this methodology is based on IEC 60099-4 for evaluating sealing performance of surge arresters, it does not strictly replicate the test prescribed by this standard. IEC 60099-4 specifies immersion for 42h at 100°C and requires mechanical pre-conditioning of samples before immersion. Such pre-conditioning could cause sealing failures and allow water ingress through mechanically weakened points. By contrast, no pre-conditioning was performed in this research since the main goal was not to induce mechanical degradation.
Each day, the arresters were removed from the heated bath and cooled for 2h in water at ambient temperature, with 1h in each cooling tank. After cooling, they were dried at room temperature for 1h and subsequently exposed to an air jet to ensure complete external drying. Since leakage current is temperature dependent (IEC 60099-4), this procedure was used to avoid its influence on measurements. Then, phase-to-earth 12 kV was applied for 20s on each surge arrester and recorded together with its corresponding leakage current.

Graphic Pattern of Voltage x Leakage Current
Total leakage current of surge arresters consists of two components: resistive and capacitive. The resistive component is responsible for power losses and should remain as low as possible. For new or non-degraded distribution-class (Class 1) arresters, the resistive current represents less than 7% of total leakage current, meaning that the capacitive component will play the major role. As degradation progresses, the balance between resistive and capacitive currents will change and the resistive component will increase at a rate that depends on ageing or internal deterioration.
Typically, voltage and current analyses are presented with time or angular frequency as the horizontal axis. However, this work proposes to qualitatively evaluate arrester condition by plotting instantaneous applied voltage against instantaneous leakage current. To clarify this, it is worthwhile evaluating the behavior of voltage x current in purely capacitive and resistive elements (as in Fig. 4).
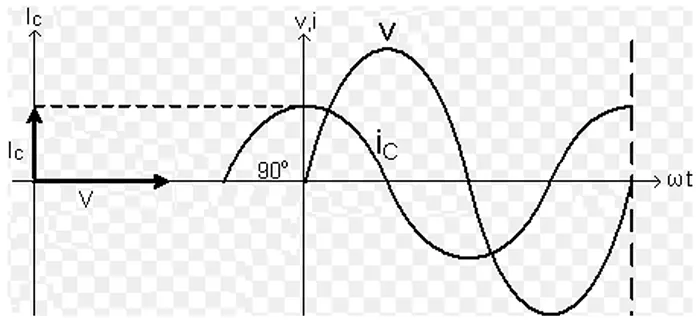
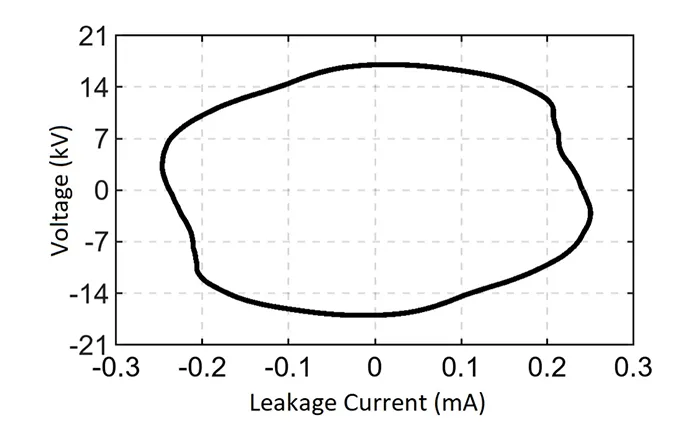
In a purely capacitive element, capacitive current leads voltage by 90° and the signals are in quadrature. If instead of using a temporal axis, plotting instantaneous voltage against capacitive current shows that the resulting waveform resembles an ellipse centered at the origin. Since leakage current of a new surge arrester is predominantly capacitive, the graph from plotting instantaneous voltage applied on its terminals versus total leakage current will not be a perfect ellipse but rather will follow this trend (as in Fig. 5). This is representative of a non-degraded surge arrester.
Unlike the capacitive component, the resistive current is in phase with applied voltage. As a result, both voltage and current reach their peaks and zero crossings simultaneously (as in Fig. 6).
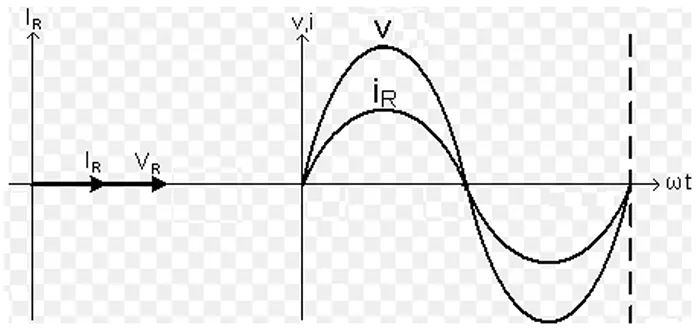

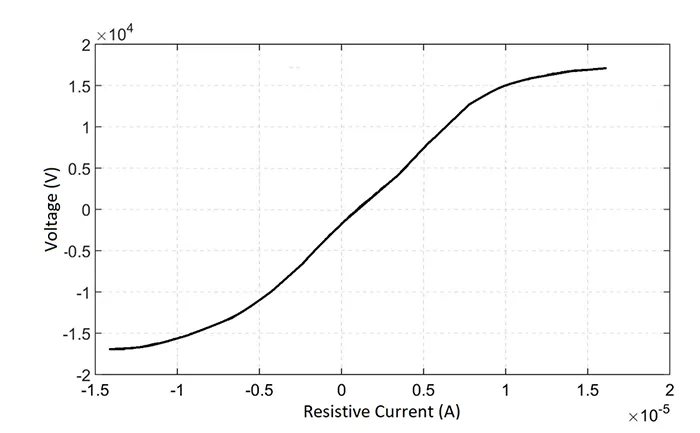
But if instead of using the signal representation in Fig. 6 for a linear resistor, instantaneous voltage versus resistive current is plotted, the result will be a straight line through the origin. However, when this analysis is extended to surge arrester voltage x resistive current, varistor non-linearity will result in a non-linear resistive current component, leading to a graph that resembles an arctangent function with a vertically expanded axis. Fig. 7 elucidates this behavior, using as example, the voltage x resistive leakage current for the surge arrester from Manufacturer A for a non-degraded situation. The resistive component was extracted from data used to plot Fig. 5, using the point on wave technique.
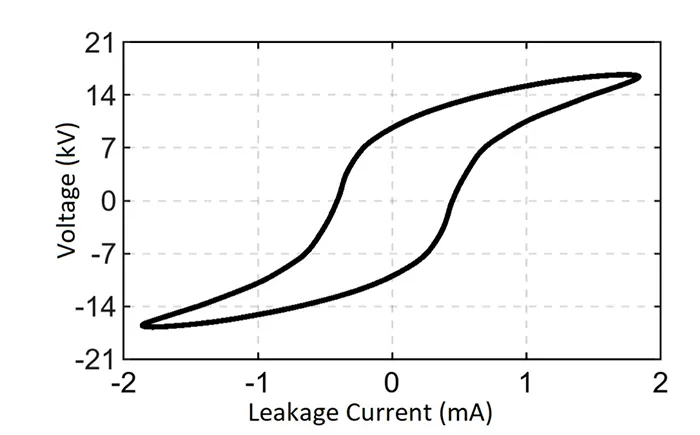
When the surge arrester is degraded by internal moisture, its leakage current increases significantly. In this condition, the resistive component—which was initially only a small fraction of the total current—becomes progressively more dominant. As degradation advances, total leakage current flowing through the varistors tends to become more like the resistive current component.
Consequently, the original elliptical voltage x current characteristic for non-degraded surge arrester from Manufacturer A (see Fig. 5) gradually evolves into a hysteresis-like loop similar to that observed in ferromagnetic materials (as in Fig. 8 for the same sample). In severely deteriorated arresters, the voltage x leakage current curve approaches the shape of an arctangent function. Nevertheless, due to varistor structure, total leakage current always retains an inherent capacitive component. This behavior is discussed below.
Results & Discussion
Total leakage current was monitored throughout the immersion test. Some arresters showed a clear increase in their current value, which indicates that moisture took place in the devices. Below, these details are discussed for each manufacturer. Moreover, changes in the pattern of voltage x leakage current are compared to the increase in the resistive current component. The graphs show applied voltage x total leakage current (black curve) but also include applied voltage x capacitive and resistive current components (green and red curves respectively). This is important since it is helpful to observe how leakage current profile changes towards resistive current components as a surge arrester deteriorates.
Manufacturer A
For a new arrester, total leakage current nearly coincides with the capacitive component, while the resistive contribution is negligible. This total leakage current distribution produces a phase displacement of approx. 90° with respect to applied voltage. Consequently, when plotting instantaneous voltage against instantaneous current, the resulting waveform resembles an ellipse centered at the origin and with maximum current occurring near the zero-crossing of voltage (see Fig. 9a).
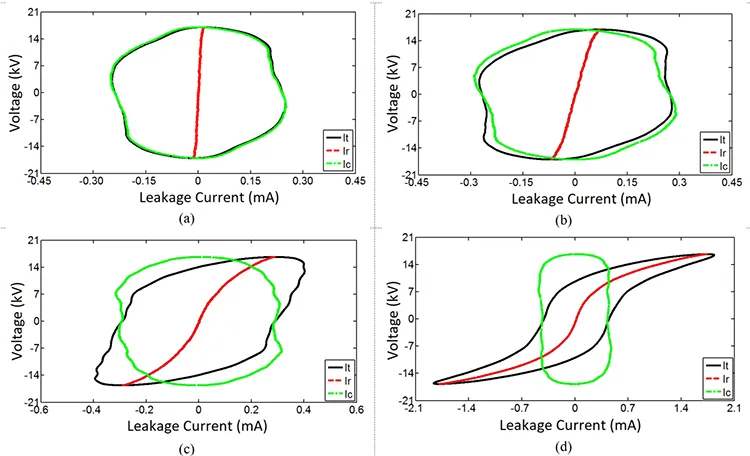
As the arrester degrades due to moisture ingress, the voltage-current profile progressively alters. After 10 days of immersion, in addition to an increase in current amplitude, a slight distortion of the waveform can be observed (as in Fig. 9b). This distortion becomes more pronounced after 13 days (see Fig. 9c), when the initial elliptical waveform tends toward a shape resembling the hysteresis loop of a hard magnetic material. By the 19th day of immersion (see Fig. 9d), the waveform resembles that of a soft magnetic material.
In advanced stages of degradation, the waveform increasingly resembles a hysteresis loop, approaching the profile of an arctangent function. This behavior is consistent with current conduction through the varistors, whose highly non-linear characteristics impose such waveform distortion on leakage current.
To understand mathematically how the contribution of the current components changed throughout the immersion test, a decomposition was performed. The leakage current initially measured was on the order of 0.2 mA with the resistive component representing only 4.6% of its composition. During the first 6 days of immersion, measured values of total leakage current remained within the acceptable measurement error range (i.e. 5%). However, starting on the 7th day, total current increased by 6.9% compared to the pre-immersion reference value, with the resistive component nearly doubling to 8.2%. This progressive increase continued and after 10 days of testing total leakage current had risen by 17.7%. In this condition, the resistive current increased from 8.2 μA (new arrester) to 42.9 μA, representing 20.8% of total leakage current.
After 13 days of testing, the contribution of the resistive component rose sharply to 58.2%, equivalent to 0.2 mA. By the 19th day of immersion, leakage current reached values far above those expected under normal operating conditions, with the resistive component accounting for approximately 92% of total current. Despite the gradual growth, no consistent pattern in rate of current increase could be identified.
It is worth noting that variation in applied test voltage throughout the immersion procedure was lower than 3.5%. Therefore, the changes observed in the current profile can be attributed to the arrester’s internal degradation rather than to fluctuations in the test supply system.
Since the digital decomposition method of leakage current requires a high level of computational and mathematical expertise that hinders rapid assessment of a surge arrester’s operating condition, a simpler methodology is recommended for identification of degraded devices. A preliminary alternative consists of a qualitative evaluation of arrester performance and degradation using only the instantaneous voltage–current waveform relationship introduced in this research.
Manufacturer B
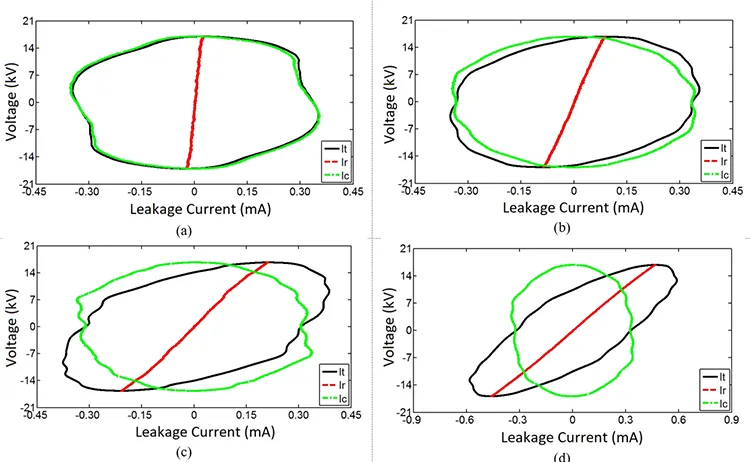
For a new arrester, total leakage current closely followed the capacitive profile, thus remaining in quadrature with applied voltage. Phase displacement was slightly less than 90° due to the small resistive contribution present in the initial condition (see Fig. 10a). After 23 days of immersion, a slight tilt of the current trajectory toward quadrants I and III was observed, indicating the onset of resistive dominance (see Fig. 10b). This effect became more evident on the 24th day, accompanied by a noticeable increase in current amplitude (see Fig 10c). By the 26th day, the tilt and current magnitude were even more pronounced. Nonetheless, the degradation mechanism observed in Arrester B differed substantially from that of Arrester A.
Instead of producing a hysteresis-like voltage-current loop typical of varistor non-linearity, the resulting waveform aligned along a nearly straight line. This behavior suggests that the leakage path was not primarily through the varistors but rather through the interface between the varistor blocks and the inner surface of the housing. Consequently, moisture infiltration was confined to this interfacial region, which, in turn, led to a subsequent reduction in total current between day 26 and the end of the immersion test. By the end of the test, the resistive component represented 50% of total leakage current
Initial total leakage current of Arrester B was 0.35 mA, predominantly capacitive in nature (94%), with a resistive component of only 6%. This condition remained stable during 22 days of immersion. However, over the same period, the resistive fraction gradually increased to 13%. In the following 4 days, both total leakage current and its resistive component exhibited a sharp rise; the total current doubled in magnitude while the resistive contribution grew to 78.9% of overall current.
By the 27th day of immersion, contrary to expectations, total leakage current decreased to 0.3 mA, with the resistive component accounting for 69%. From this point onward, both values declined progressively until the end of the test, with the resistive current representing approximately 50% of total leakage current.
Although the absolute leakage current of Arrester B did not reach the same levels observed in Sample A, the rapid increase in the resistive component to anomalously high values clearly indicated degradation of the device. To better understand this atypical behavior, the instantaneous voltage–current waveforms were analyzed. Fig. 10 presents the evolution of this waveform throughout the immersion test, highlighting the main stages of degradation.
Manufacturer C
Leakage current of Arrester C remained stable during the entire 30-day immersion period, with variations in measured values remaining below 2%. The relative proportions of the resistive (≈6%) and capacitive (≈94%) components also exhibited negligible fluctuation. These results demonstrate absence of degradation or moisture-induced ageing in this sample, as evidenced in Figs. 11a & b.
Compared to the behavior of Arresters A and B, the performance of C is particularly significant. In the previous cases, progressive increases in the resistive component of leakage current were observed, often reaching anomalous proportions that are well-recognized indicators of internal degradation. For example, Arrester A exhibited a sharp increase in resistive current after only 10 days of immersion, while Arrester B displayed a distinct degradation pathway probably associated with interfacial conduction mechanisms.
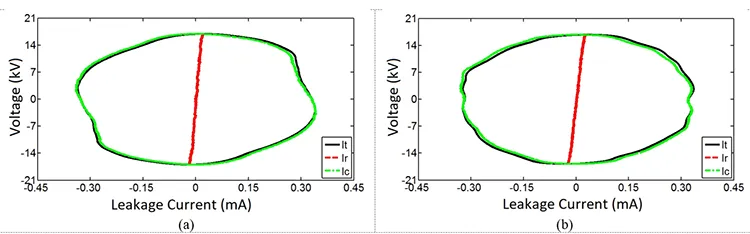
By contrast, the stability of arrester C under identical test conditions suggests that its internal sealing, housing configuration, and varistor arrangement were more effective in preventing moisture ingress and preserving dielectric integrity. This outcome highlights the importance of design differences on long-term reliability and demonstrates that structural and material choices can decisively influence an arrester’s resistance to environmental stresses.


Conclusions
Comparative analysis of the arresters tested demonstrates that the progression of leakage current under moisture exposure depends greatly on arrester housing material, internal arrangement and sealing efficiency. While arresters of Types A and B exhibited measurable degradation mechanisms—ranging from progressive resistive current growth to interfacial conduction paths—Arrester C maintained stable performance throughout the 30-day immersion test.
From an engineering standpoint, the behavior of Arrester C underscores the critical role of design optimization in enhancing long-term reliability of surge protection devices. Specifically, its ability to maintain the resistive component at approximately 6% of the total leakage current, with no evidence of moisture-induced deterioration, suggests superior dielectric robustness and effective prevention of internal humidity ingress.
These findings provide valuable insight for utility operators and equipment manufacturers. First, they reinforce the need to evaluate arresters not only in terms of electrical performance at time of commissioning but also regarding their resilience to environmental stresses over time. Second, results highlight that structural design decisions—such as housing material selection, sealing techniques, and varistor alignment— can directly influence service life expectancy. Therefore, adopting arrester designs with enhanced moisture resistance, as demonstrated by Arrester C, can significantly improve grid reliability, reduce maintenance frequency, and mitigate risk of premature failures in high voltage networks.
Analysis of voltage-leakage current (V–I) profile has proven a valuable tool for assessing the operational state and degradation of surge arresters. Its main advantage lies in its ability to provide a qualitative yet highly intuitive visualization of the relationship between applied voltage and leakage current, enabling a rapid distinction between capacitive and resistive contributions. Unlike purely numerical decomposition methods, the V–I profile allows practitioners to identify deviations from ideal capacitive behavior, such as hysteresis-like distortions or linear conduction paths, which are direct indicators of internal degradation processes. In addition, this method requires minimal computational effort, making it attractive for field diagnostics and preliminary assessments.
However, the approach also presents inherent limitations. At this stage, the V–I profile is predominantly qualitative, and its interpretation depends on expert knowledge of varistor behavior and non-linear conduction phenomena. Subtle variations in waveform shape might be overlooked or misinterpreted without complementary quantitative analysis. Additionally, environmental noise, measurement accuracy, and variations in test voltage can introduce distortions that complicate diagnostics.
While the V–I profile represents a practical and insightful tool for rapid screening of surge arrester condition, it should be applied as a complementary technique rather than standalone diagnostic. Its greatest utility is achieved when integrated with numerical decomposition and long-term monitoring, thereby combining ease of visualization with rigorous quantification of leakage current components.
References
[1] D. A. Da Silva et al, “Reliability of directly molded polymer surge arresters: Degradation by immersion test versus electrical performance”. International Journal of Electrical Power & Energy Systems, Vol. 53, 2013, pp. 488–498.
[2] B. Ranjbar et al., “A Survey of Diagnostic and Condition Monitoring of Metal-Oxide Surge Arresters,” Energies, 2022. 15 (21), 8091. doi: 10.3390/en15218091
[3] Lahti K. “Effects of internal moisture on the durability and electrical behavior of polymer housed metal oxide surge arresters”. [Tese de doutorado], 162 p, Universidade de Tecnologia de Tampere, Finlândia, 2003.
[4] W. A. M. Ursine, J. L. Silvino, L. G. Fonseca and R.M. de Andrade, “Metal-oxide surge arrester’s leakage current analysis and thermography,” 2013 International Symposium on Lightning Protection (XII SIPDA), Belo Horizonte, Brazil, 2013, pp. 297 – 303, doi: 10.1109/SIPDA.2013.6729238.
[5] H. Martins, F. B. Barbosa and W. Cruz, “Evaluation and diagnosis technique for surge arresters,” 2010 International Conference on High Voltage Engineering and Application, New Orleans, LA, USA, 2010, pp. 614 – 617, doi: 10.1109/ICHVE.2010.5640778.
[6] IEC 60099-5, Surge Arresters – Selection and Application Recommendations, IEC, 2018.
[7] I. A. Metwally et al.: “Online Condition Monitoring of Surge Arresters Based on Third-Harmonic Analysis of Leakage Current”. IEEE Transactions on Dielectrics and Electrical Insulation Vol. 24, No. 4; 2017. Doi: 10.1109/TDEI.2017.006334
[8] T.Almomani, E. A. Feilat, I.A. Metwally, “Internal and External Leakage Current Decomposition of Surge Arresters Using Discrete Fourier Transform,” Int. J. of Advanced Trends in Computer Science and Engineering, Vol. 8, No. 5, 2019. Doi: 10.30534/ijatcse/2019/89852019
[9] T. Alquthami et al., “Online Condition Monitoring of 120 kV ZnO Surge Arresters via Correlation Method,” Eng. Proc., 2023, 4 6 (1), 4; doi: 10.3390/engproc2023046041
[10] M. Khodsuz, M. Mirzaie, S. Seyyedbarzegar, “Metal oxide surge arrester condition monitoring based on analysis of leakage current components”, Int. J. of Elect. Power & Energy Syst., Vol. 66, 2015, Pages 188-193, doi: 10.1016/j.ijepes.2014.10.052.
[11] C. A. Laurentys Almeida et al., “Intelligent Thermographic Diagnostic Applied to Surge Arresters: A New Approach,” IEEE Transactions on Power Delivery, vol. 24, no. 2, pp. 751-757, 2009. doi: 10.1109/TPWRD.2009.2013375.
[12] Balakrishnan, G.K.et al. “A Review of Infrared Thermography for Condition-Based Monitoring in Electrical Energy: Applications and Recommendations. Energies 2022, 15 (16) 6000. doi: 10.3390/en15166000
[13] L. Yongling et al., “Aging monitoring and fault positioning for zinc oxide surge arresters based on the fifth harmonic of the leakage current”, Frontiers in Physics, Vol. 13, 2025, DOI=10.3389/fphy.2025.1595410.
[14] M. Khodsuz and S. M. Seyyedbarzegar, “Surge Arrester Monitoring under different operating conditions Using Bees-ANFIS,” Iranian J. of Electrical and Electronic Engineering Special Issue on Power Engineering 2019, 15(1): 151-160
[15] M. Khodsuz and M. Mirzaie; “Monitoring and Identification of Metal-Oxide Surge Arrester Condition Using Multi-Layer support vector machine. IET Gen., Trans. & Dist., Vol. 9, No. 16, 2015. doi: 10.1049/iet-gtd.2015.0640
[16] NEMA, USG-107-2021 Arrester Condition Monitoring Guide, 2021.
[17] IEC 60099-5, Surge Arresters – Selection and Application Recommendations 2018.
[18] Dobric, G.; Stojkovic, Z.; Stojanovic, Z. Experimental verification of monitoring techniques for metal-oxide surge arrester. IET Gener. Transm. Distrib. 2020, 14, 1021–1030. Doi: 10.1049/iet-gtd.2019.1398.
[19] M. Khodsuz, M. H. Teymourian, S. Seyyedbarzegar. “New criteria for metal oxide surge arrester condition monitoring based on leakage current analysis: Considering non-uniform pollution effect”. ET Gener. Transm. Distrib. 2024; 18:1072–1089. Doi: 10.1049/gtd2.13123
[20] B. V. S. Araujo et al., “Monitoring ZnO surge arresters using convolutional neural networks and image processing techniques combined with signal alignment”. Measurement,
Vol. 248, 2025. doi: 10.1016/j.measurement.2025.116889.
[21] L. K. Massey, Permeability properties of plastics and elastomers: a guide to packaging and barrier materials, 2nd ed., 2002, pp. 550.
[22] J. E. Mark, Physical Properties of Polymers Handbook, Springer2nd ed., 2007, pp. 1073.
[23] Vieth W. R., Diffusion in and Through Polymers, Hanser Publishers, Munich, 1991, pp. 322.
[24] D. W. van Krevelen and K. te Nijenhuis, “Properties of polymers: their correlation with chemical structure; their numerical estimation and prediction”, 4th completely rev. ed., 2009, pp. 1031.
[25] Jürgen E.K. Schawe, Elastomers. Volume 2, Mettl er-Tolede collected applications, Thermal analysis, 2002.
[26] C. E. Weir and E. R. Lippincott, “Spectroscopic studies of the low temperature transitions of polysiloxanes,” Journal of Research of the National Bureau of Standards, vol. 44, no. 4, pp. 367–374, 1950, doi: 10.6028/jres.044.035.
[27] Hitachi High-Technologies Corporation, Measurement Examples of Silicone Rubber Using Differential Scanning Calorimetry (DSC), Application Note TA No.018e, 1985. [Online]. Available: https://www.hitachi-hightech.com/file/global/pdf/products/science/appli/ana/thermal/application_TA_018e.pdf
[28] Y. Wu et al., “Structure evolution and thermal properties of methyl vinyl silicone rubber under crosslinking and filler loading,” Polymers, vol. 14, no. 9, p. 1855, 2022, doi: 10.3390/polym14091855.
[29] S.B. Yamaki, E.A. Prado and T.D.Z. Atvars, “Phase transitions and relaxation processes in ethylene-vinyl acetate copolymers probed by fluorescence spectroscopy”, European Polymer Journal 38, pp. 1811-1826, 2002.
[30] D. A. da Silva; Pissolato Filho, J.; K. Lahti. “Evaluation Of Metal Oxide Surge Arresters and Their Polymeric Housing Under Moisture Conditions”. In: 2017 International Symposium on Lightning Protection (XV SIPDA), 2019, São Paulo. 2017 International Symposium on Lightning Protection (XV SIPDA), 2019.
[31] IEC 60099-4 (2006), Metal- Oxide Surge Arresters without Gaps for AC Systems.
[32] D. A. Da Silva, Metodologia de Análise Qualitativa em Para-Raios Poliméricos Sujeitos à Umidade Interna. PhD thesis in Portuguese, State university of Campinas, Campinas – Brazil, 2016.
[33] C. A Spellman and A. Haddad, “A technique for online monitoring of ZnO surge arrester”,10th International Symposium on High Voltage Engineering, Canada, August 1997.