Many regions of the globe are exposed to severe earthquakes that generate dramatic consequences in the way of loss of life and destruction to infrastructure. Since these events can neither be predicted nor prevented, the focus is on mitigation. These natural events can be especially critical for power networks, with extensive damage to equipment that causes extended outages. In addition, cost of repair is also high while loss of energy for long durations only increases the misery of those affected.
Due to interconnection requirements and network structure, many HV and UHV substations are located in high seismic areas. This implies challenges when it comes to design of AC and DC insulators. In particular, in addition to ground acceleration, bushings are subject to amplification by the transformers and reactors on which they are mounted. Ideally, they must be able to survive powerful seismic stresses without interruption in operation. However, it is extremely difficult to carry out seismic tests on UHV bushings to effectively verify withstand performance. Therefore, use of static or modal analysis is required to demonstrate bushing capabilities versus performing real tests. These can also support the design process during development. Seismic tests performed on a shaker table can then validate prototypes and relevant simulations while providing additional information to improve design criteria and methodologies for technical verification using simulation. This edited contribution to INMR by P. Cardano, G. Testin and other engineers at GE Grid Solutions Bushings, in parallel with an overview of seismic standards, shows that such calculations match real values measured during seismic tests and demonstrates that this kind of analysis has now achieved satisfactory reliability.

Review of Standards
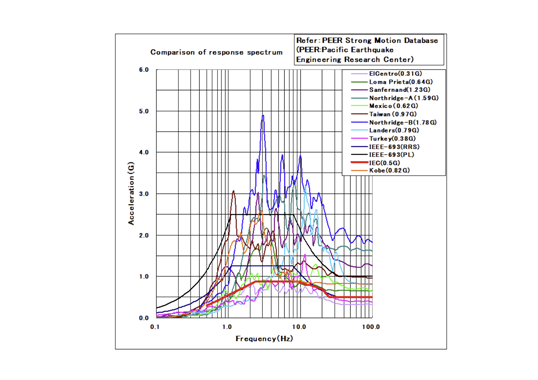
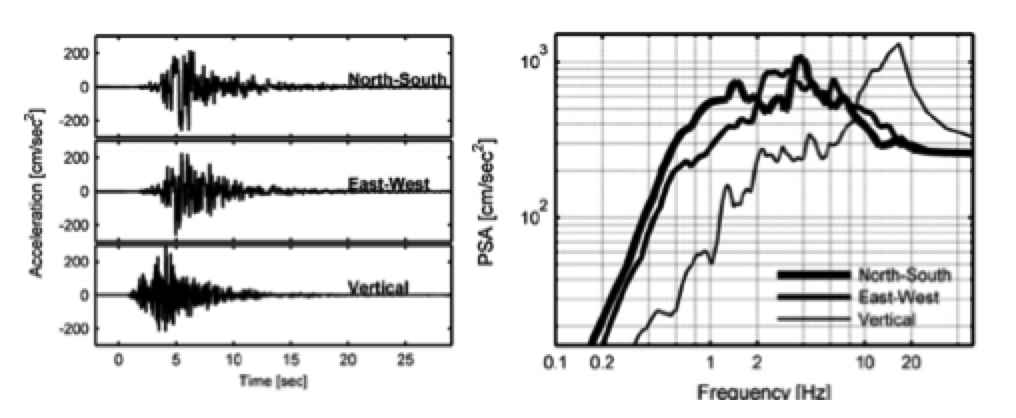
An earthquake causes ground motion of the soil. This generates a wave train characterized by different frequencies, each with its own intensity and that can be shown using a response spectrum graph (as in Fig. 1). Every particular type of soil is characterized by a main resonance frequency due to its composition (e.g. rocks, sand, clay, mixtures of these) as well as by other minor resonance frequencies (see Figs. 1 & 2). Based on records from past earthquakes, it has been noted that response spectra have similar shape, even with obvious different peak values and positions of peaks due to differing natural soil frequencies. In any case, all earthquakes have similar ranges in frequencies and a trapezoidal shape in the frequency domain (i.e. an increasing part, a maximum value and a decreasing part). The main differences are related to different positions of the relevant peaks, corresponding to the main soil resonance. This similarity in shape and requirement to consider all possible values of resonance of different sites has resulted in different international and national seismic standards when it comes to definition of Reference Response Spectra (RRS). This is the shape in the frequency domain of reference that seismic tests must fulfill. This RRS has an increasing section, a plateau and a decreasing section. The plateau, corresponding to the maximum acceleration value, includes all peak values recorded during past earthquakes, with the scope to consider all possible differing soil behavior. Because of this, all seismic standards have defined a similar RRS (see Fig. 5). The spectra plateau, corresponding to the maximum acceleration value, generally has a range of between 1 to 10 Hz. All spectra become flat with frequencies higher than 12 to 13 Hz at the zero period acceleration (ZPA) value.
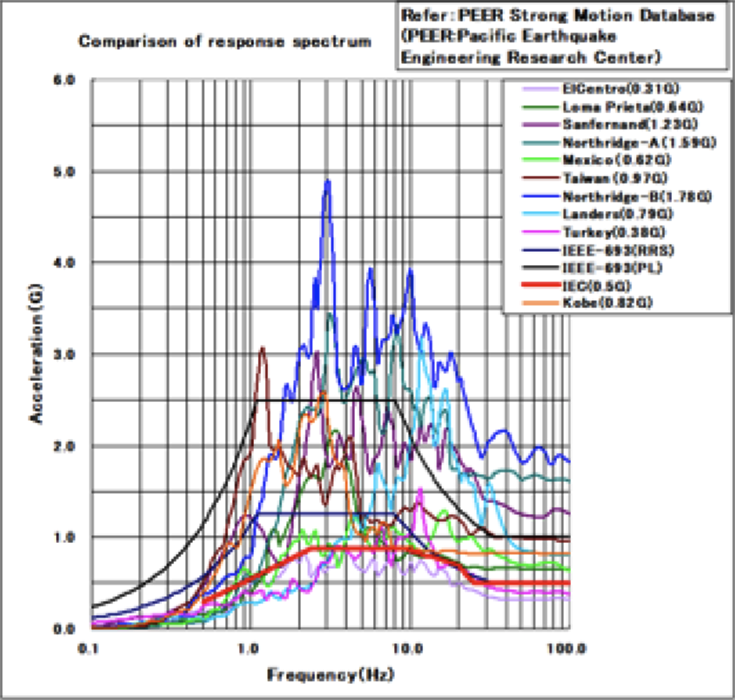
(Pacific Earthquake Engineering Research Center).
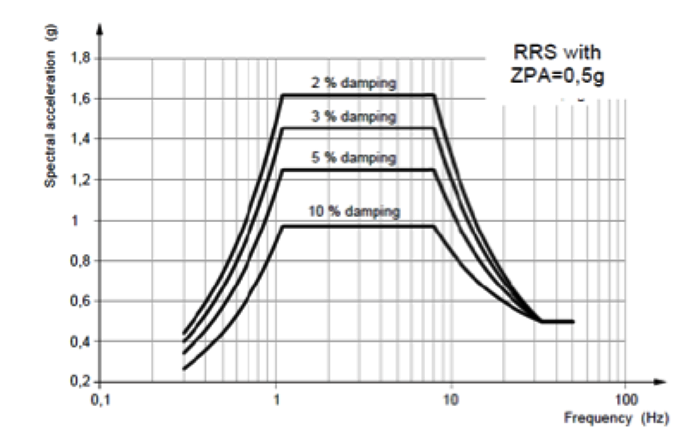
The ZPA value is the asymptotic value of the seismic acceleration at which there are no amplification effects. As the frequencies become lower, the RRS values become high due to resonance effects.
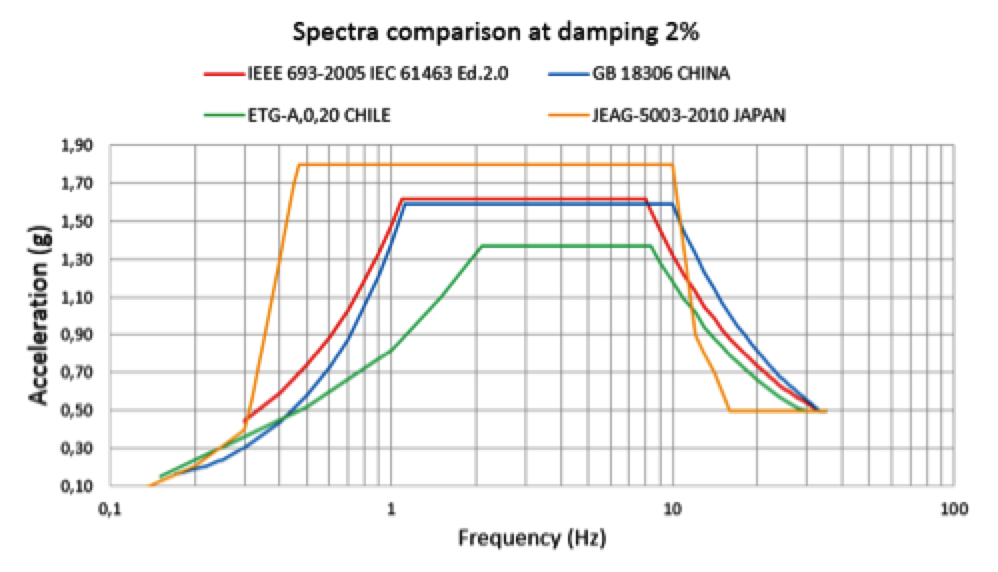
Among the various standards, IEEE 693 is the best known and the RRS it defines has become an industry benchmark. Recently IEC Standards (i.e. IEC TS 61463 for bushings and IEC 62271-207 for GIS) have adopted this RRS, which is the most used worldwide and similar to other standards. While the Reference Response Spectrum indicates the response of the soil to seismic vibration, bushings are not normally directly fixed to the ground, e.g. they are mounted on transformers or reactors, part of GIS systems, or fixed on walls or roofs. Some structure is always present between ground and bushing. Moreover, this structure is never rigid but rather imparts its own contribution to ground vibration depending on geometry, material, shape, etc. Different studies have been carried out to define the contribution of such structures and a super elevation factor K is normally defined to be in the range of 1 to 2, depending on structure. International Standards define this amplification coefficient as normally 1.5 or 2. Other contributions are then given by the fact that the system is not perfectly linear and that there are other minor natural frequencies (e.g. a bushing has many parts that can themselves vibrate at different proper frequencies) that can increase the amplification of motion (see Fig. 5 for a better understanding). IEC 61463 Ed. 2 is used in the calculation and considers such contributions.
(IEC TS 61463 Ed. 2)
(Font: IEC TS 61463 Ed. 2)
Another contribution is given by the damping of the bushing – a term indicating the capacity of the system to dissipate the energy with which it has been excited. The higher the damping, the lower the response of the system to seismic solicitation. For this reason, the RRS is actually a family of curves, each corresponding to different damping (see Fig. 6).
(IEC TS 61463 Ed. 2)

Seismic Tests on UHV Bushings
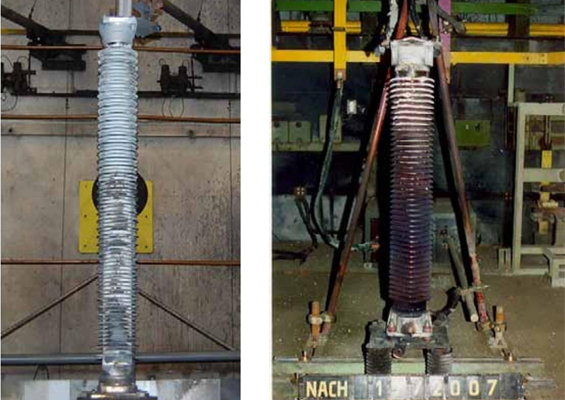
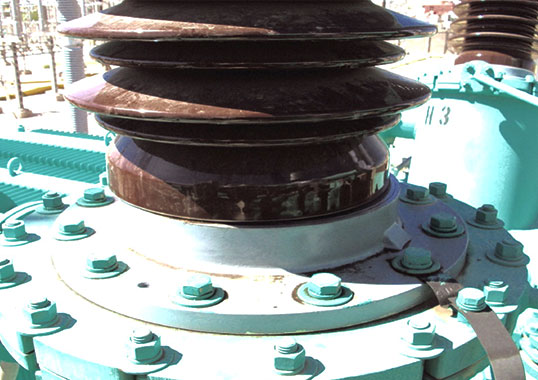
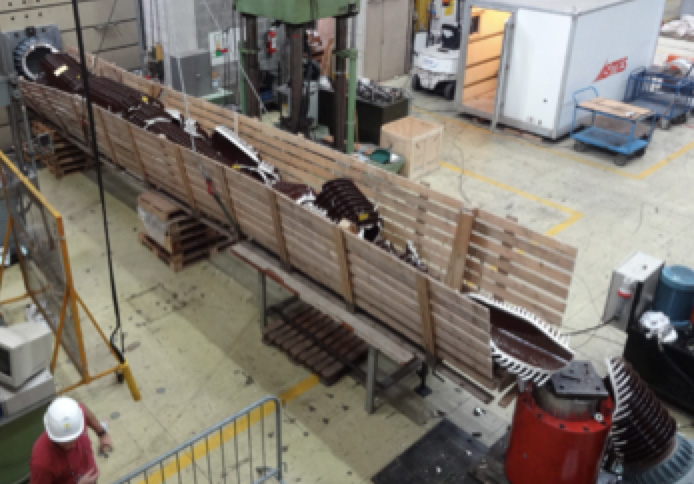
Based on the above concepts, it is easy to understands why a bushing, which is a heavy, tall and thin apparatus made of fragile materials such as porcelain, with center of gravity at more or less half of its air side height, will be subject to huge mechanical stress during ground motion amplified by the structure to which it is mounted. This phenomenon becomes greater when the bushing, due to voltage class, is extremely high and heavy, as is the case for UHV bushings. Such bushings (i.e. voltage class ≥ 800 kV) have air side length of at least 6 to 7 m and, in most cases, have an air side insulator made of porcelain. That only further increases their significant weight. They therefore feature among the worst possible properties from the seismic point of view. To this intrinsic fact must be added the difficulty to find a mechanical laboratory able to manage a seismic test on a system that is so high and heavy. One aspect is the capability to vertically handle a test object 10 to 13 m high, plus the frame for fixing it to the shaker table. But the main problem is given by the shaking tables themselves that must synthetize the ground motion. In the majority of cases they are not so large as to be able to correctly reproduce the time history of the ground motion on an object with a center of gravity of many tons placed at 4 to 6 m in height. In fact, each shaking table has been designed to have a maximum overturning moment. This is the maximum moment that the system can support (in ton x m), by correctly following the seismic RRS correctly in all range of accelerations. With higher values, the table may fail to strictly follow RRS requirements in some parts of its frequency range.
It easy to understand that a UHV bushing, with an air side center of gravity placed at about 5 to 6 m and weighing some 6 tons, gives a moment of 30 to 40 ton x m – a value reachable only by the biggest shaker tables. Due to the above, in conjunction with important cost aspects, it has become common to make use of finite element methods (FEM) to simulate the system under test and then to carry out only a few real seismic tests to validate the calculations.
(CESI-ISMES, Italy)
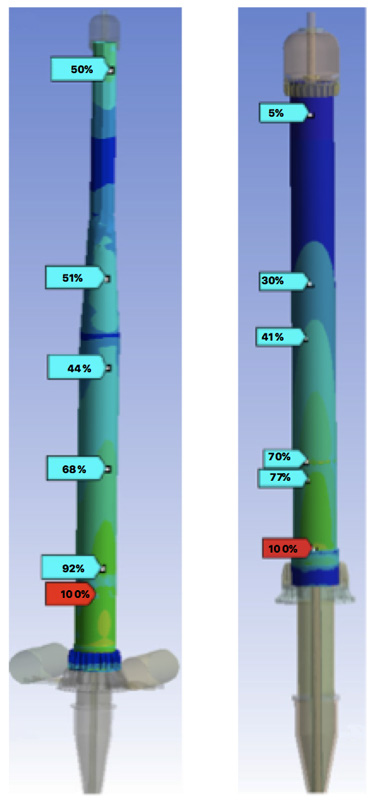
The bushing is modeled by FEM and a modal analysis is applied to study the dynamic properties of the system. This kind of tool identifies the dynamic response of the bushing, considered as a linear system, in each of its natural modes, when excited in the range of frequencies of the reference response spectrum. The result of this calculation is the map of vibration modes of the object (as in Fig. 7), where calculated displacements have been magnified for higher readability.
Each vibration mode is characterized by a natural frequency (i.e. result of the modal analysis). The next calculation is to excite the system with the reference earthquake response spectrum (RRS), establish the mechanical stresses generated by each mode and sum each contribution to generate a total stress map (see Figs. 8 & 9).
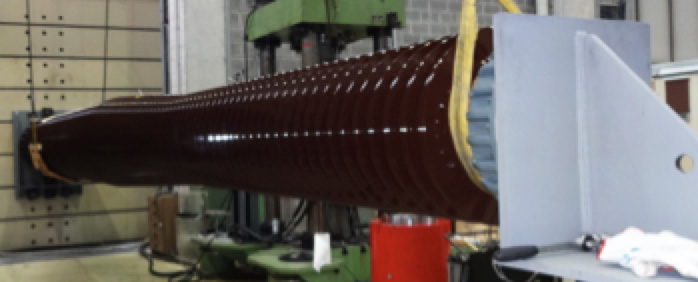
The model used for the FEM calculation is then validated with a real test. The stress measured during this test is compared with theoretical values obtained by exciting the system with the same input. If the results are similar, this means that the simulation has been done correctly, i.e. simplifications of the model carried out correctly, materials parameters close to real ones, mesh of the FEM built with the right complexity, exact weight of different system components, RRS correctly modeled, etc. After this validation step, the model can be used to simulate other seismic stresses, e.g. with different RRS if the bushing has to be verified for a different country with its own seismic standard or with the same RRS but another seismic intensity. The RRS is rigidly scaled based on the Zero Period Acceleration (ZPA), which can be 0.2g, 0.3g, 0.5g, etc.
A concrete example of this process is a seismic study carried out for 1100 kV and 550 kV class bushings to be mounted on the same monophase UHV transformer for the Chinese market. These were modeled and subject to the RRS spectrum from the China GB standard. Both bushings were then tested by Chongqing University at the same seismic motion level of 0.3g, with amplification factor K=2. The modal analysis output was the map of vibration modes of the bushing (see Fig. 10). Once subjected to the RRS, as per the specification, this yielded a stress in the most critical part of the bushing, i.e. the base of the air side porcelain, close to the flange, where stress is highest. The 550 kV rated bushing was subjected to the same procedure. During the seismic test, in addition to the acceleration profile, the strain (compression and tension) on their most critical part, which is the porcelain base, was measured for both bushings. This measurement was then compared to the calculation and the results are reported in Table 1.
for 1100 kV and 550 kV Class Transformer Bushings (in %).
It is evident that the results of calculations are not far from real values measured during the tests (namely 94.2%, 80.3%, 98.1% with respect to 100%) and that the calculations are conservative, giving values higher than real ones. It is also evident that differences may not be negligible due to a variety of reasons – on one hand due to the model being used with its approximations and on the other hand due to any measurement uncertainties. What is important, however, is that results provide a precise idea of the stresses involved and that, by being conservative, assure a better margin. The models can then be said to have been validated and will be used for future requests with different seismic spectra or with the same spectrum but with different ZPA.
(Chongqing University, China).
The same approach can be followed when the bushing is equipped with a composite insulator. The modal analysis yields the vibration modes and further application of the seismic response spectrum, RRS, gives the resulting stress.
The model is then compared with a real test on a shaker table and, if the values are similar, can be said to be validated.
(CESI-ISMES Lab, Italy)

Verification Tests on Materials
A stress profile for different materials must be compared with the maximum allowable stress for each. While for metals it is comparatively simple to find standards or technical literature that give material limits, in the case of a porcelain or for a composite insulator this can be more difficult. There, the stress limit cannot easily be read from rupture tests on specimens and depends not only on material but also on geometry, including thickness, diameter and shape as well as on the fittings, such as material for cementing and fixing the flanges. That is why when limit values must be known with precision, it is often necessary to carry out rupture tests on real insulators, e.g. the 10 m long hollow porcelain insulator used in the 1100 kV bushing referred to above. In this case, the porcelain insulator, fixed by its base to the laboratory mechanical reference wall, was subjected to a linearly increasing bending force at its head and perpendicular to its axis until the point of rupture. By recording rupture force and taking into account weight contribution and insulator geometry, it became possible to calculate rupture stress of the material. This was then used as reference in the seismic calculations and also during the real seismic tests.
(CESI-ISMES Lab, Italy).
Conclusions
Since the consequences of an earthquake can be disastrous for the integrity of HV and UHV electrical networks, extensive studies have been carried out in the past and are still in progress today to limit these consequences as much as possible. In depth studies of earthquakes have brought about standardization of response spectra (RRS), with similar shapes for the majority of seismic standards. Unfortunately, since bushings are mounted on frames (e.g. transformer or reactors) that amplify ground motion and being thin, tall and heavy, these are subject to high mechanical stresses – especially in the UHV voltage range. Due to the complexity and high costs in carrying out seismic tests on such bushings, much use is made of FEM simulations and modal analysis. These yield the vibration modes of the bushing, coupled with the RRS of the earthquake. The result is a mechanical stress map of the entire bushing structure.

Real seismic tests are then carried out with the goal of comparing the FEM model results with actual test results. When the model results are close to real ones, it can be concluded that the simulations are validated. These models can therefore be used for other spectra intensities or for investigating different seismic spectra. To calculate margins with respect to the maximum mechanical values that a bushing can withstand, stresses are compared with maximum allowable values of their various materials. When these values are not easily available or depend not only on material but also on geometries of the test object, mainly hollow core insulators, mechanical/rupture tests on real insulators must be done to obtain their real mechanical behavior. With these results, real margins can be evaluated to eventually improve design and increase performance in the case where values are found not to be sufficient.