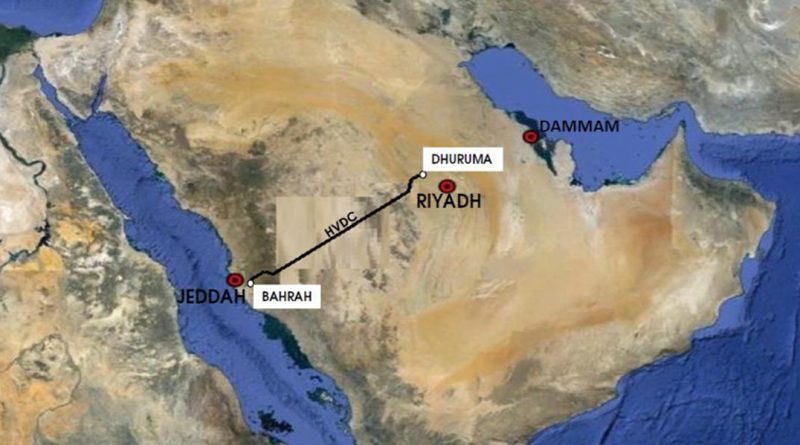
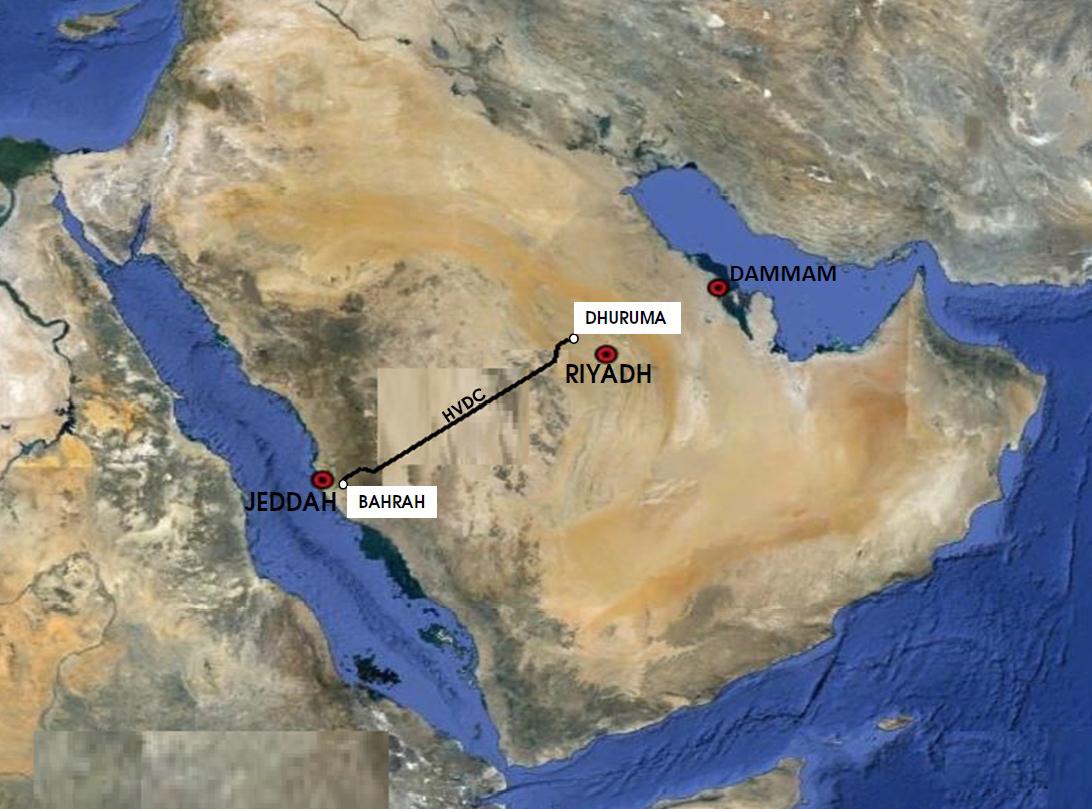
The goal of the bulk power HVDC link between the Central and West Saudi power grids was to provide economic dispatch for the generating units, flexibility to share capacity under normal conditions and provide back-up during emergency operating conditions. The scheme consists of two poles with a 770 km long overhead line between Bahrah and Dhuruma Substations and was designed for nominal power carrying capacity of 3500 MW and rated voltage ±600 kV.
This past contribution to INMR by A. H. Al-Mubarak of the Saudi Electricity Company, A. Ardito of CESI, I. Banchi of PROJECT and expert consultant, Alberto Pigini, reviewed the process of designing the line’s insulation for its harsh service environment, including seacoast and desert.
AC insulation design for EHV and UHV systems is in nearly all cases dominated by the performance requirements under switching overvoltages, which determine the arcing distance; the pollution performance requirement is then satisfied by selecting insulators with a suitable ratio between creepage distance and arcing distance (creepage factor CF). In the case of DC systems, the insulation design is most often dominated by pollution requirements, especially in harsh environment as in Saudi Arabia. This is essentially due to the following three reasons:
• contamination deposited on insulators is generally higher in DC lines than in AC lines;
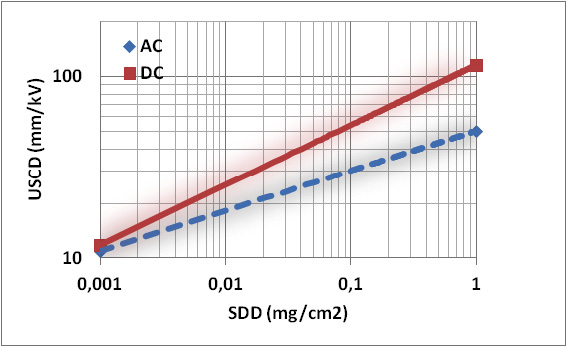
• for the same voltage level (reference to phase-to-phase rms value for AC), the creepage distance required for DC, at a given insulator contamination condition, is higher than for AC;
• magnitude of switching overvoltage in DC systems is generally lower in p.u. than in AC.
Therefore the pollution requirements are very critical for DC lines and have a determining influence on the design and cost of the overall system. In fact an over-dimensioning (leading to extremely long and costly insulators and huge towers to accommodate long insulator sets) may result in unacceptable investment costs. On the other side, an under-dimensioning may lead to unacceptable operating costs (e.g. with the need of costly palliative maintenance measures). It is therefore necessary, for the DC lines, to follow a detailed design approach, based on accurate estimate of the pollution severity and dielectric withstand characteristics of insulators, combined to a statistical evaluation of the insulator performance.
Estimating Pollution Severity
Estimation of site pollution severity requires the following basic information site related:
• ESDD: equivalent solid deposit density (mg/cm2) obtained by measurements on typical insulators
• NSDD: non soluble deposit density (mg/cm2) obtained by measurements on typical insulators
• Number of wetting events (events that, humidifying the pollution layer, makes the flashover possible)
Pollution Severity for AC Systems
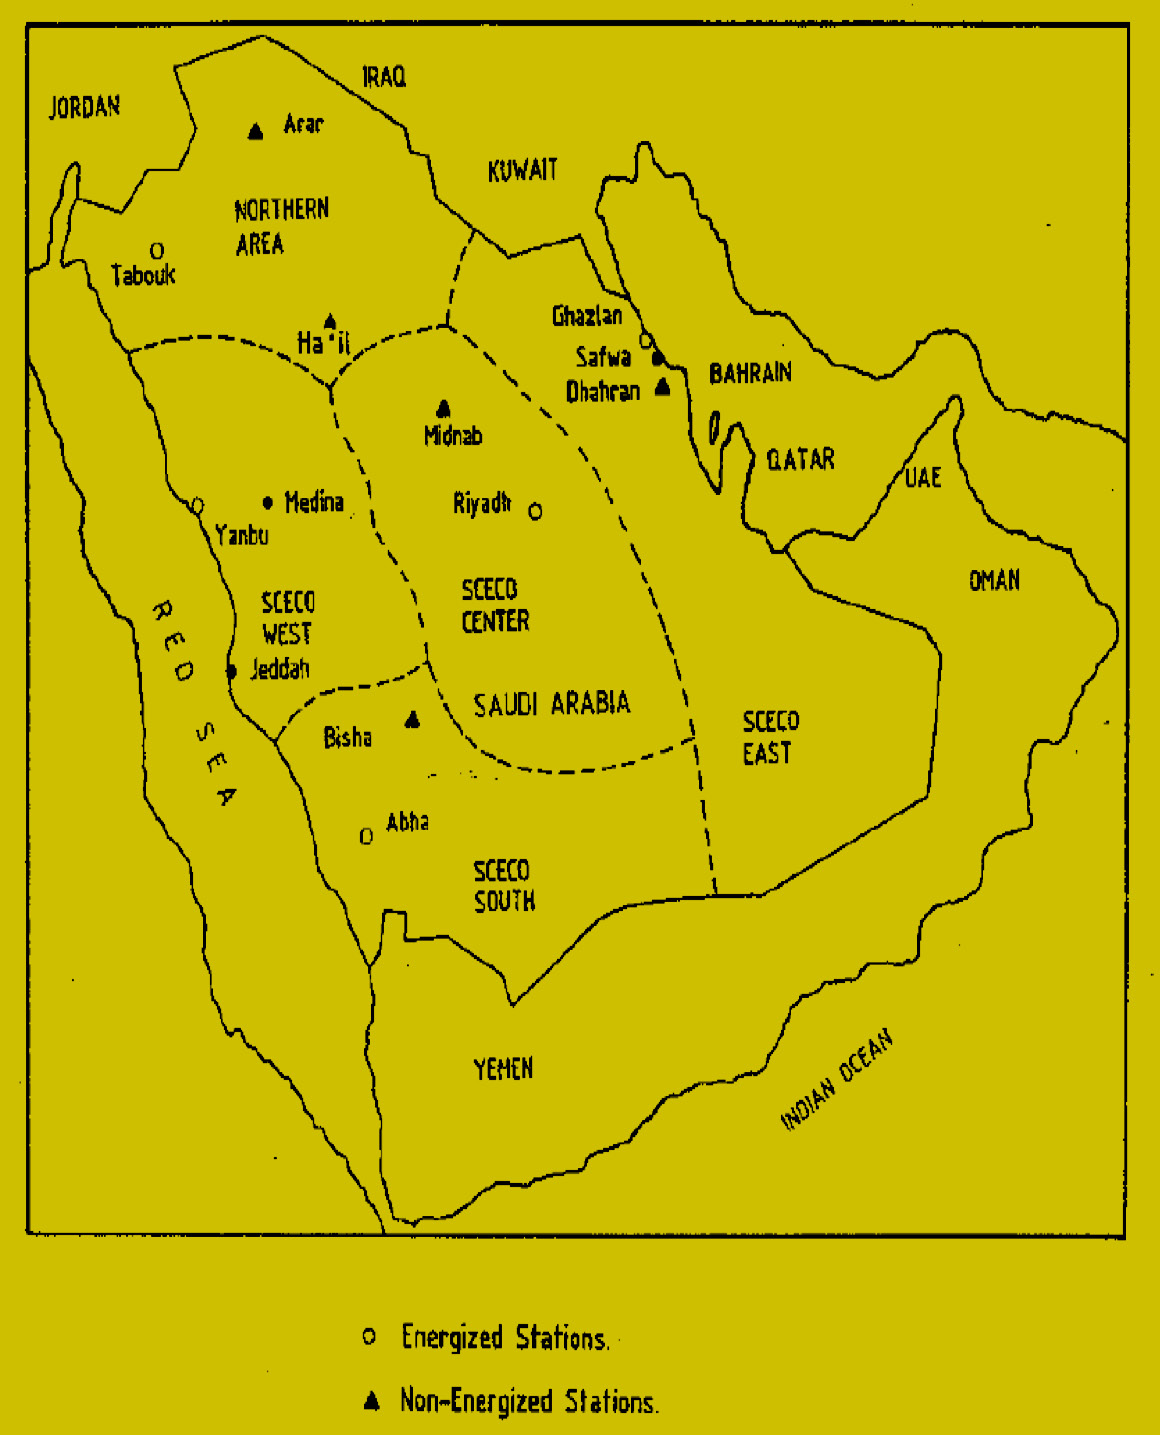
A wide and long duration research was carried out to map the contamination severity of Saudi Arabia by means of long duration measurements, as shown in the example of Fig. 2, in several test stations, located in different representative areas as shown in Fig. 3.
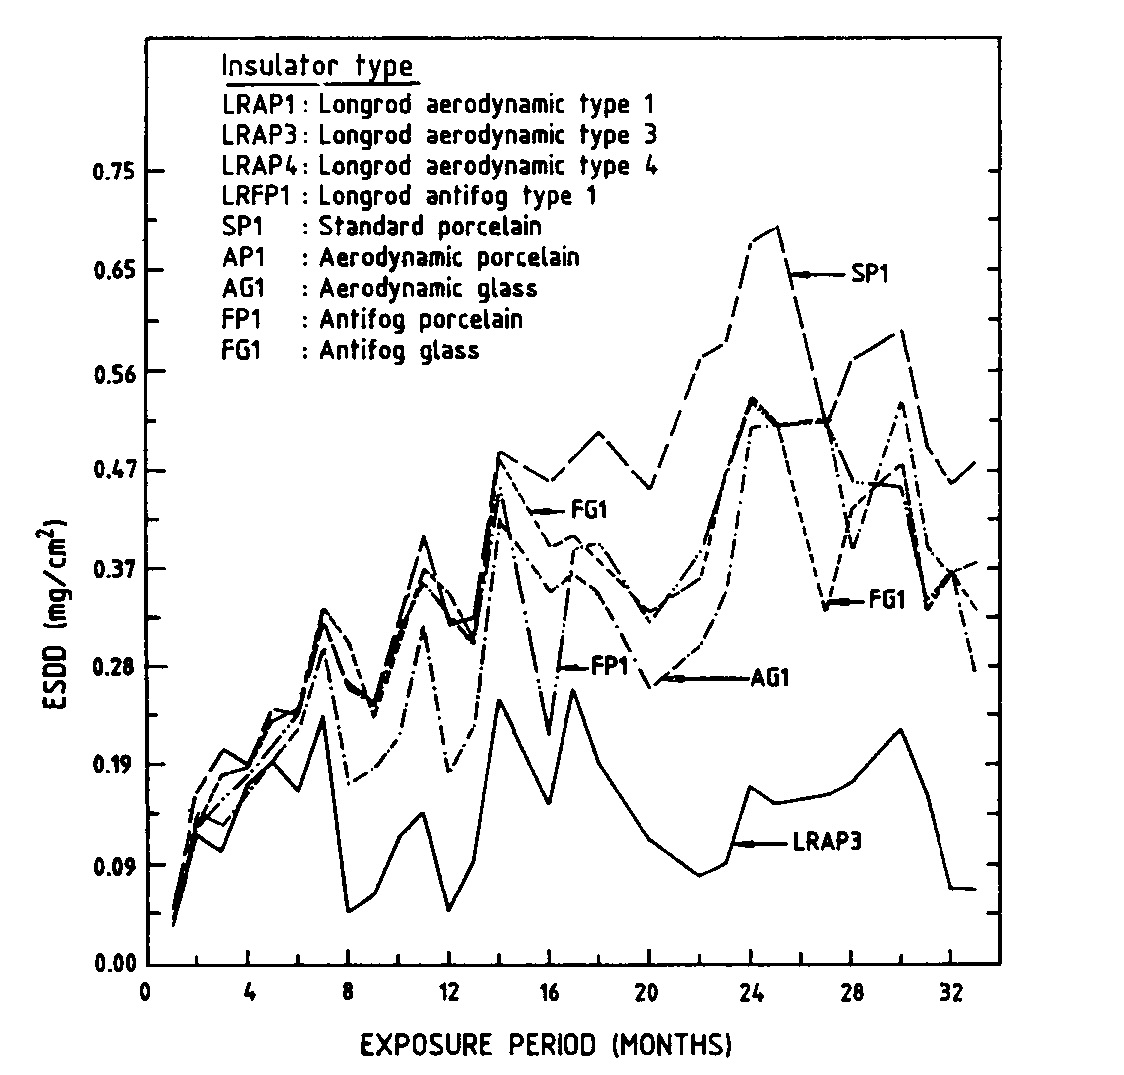
This research gave unique and excellent information about the pollution conditions in harsh environments, such as Saudi Arabia.
The ratio NSDD to ESDD was found very spread. However the NSDD value is generally significantly higher than ESDD as expectable in marine/desert environment. Averaging the available information, a ratio NSDD/ESDD equal to 5 may be assumed. On the basis of the measurements, preliminary indications on the necessary unified specific creepage distance USCD were given, as reported in Table 1.
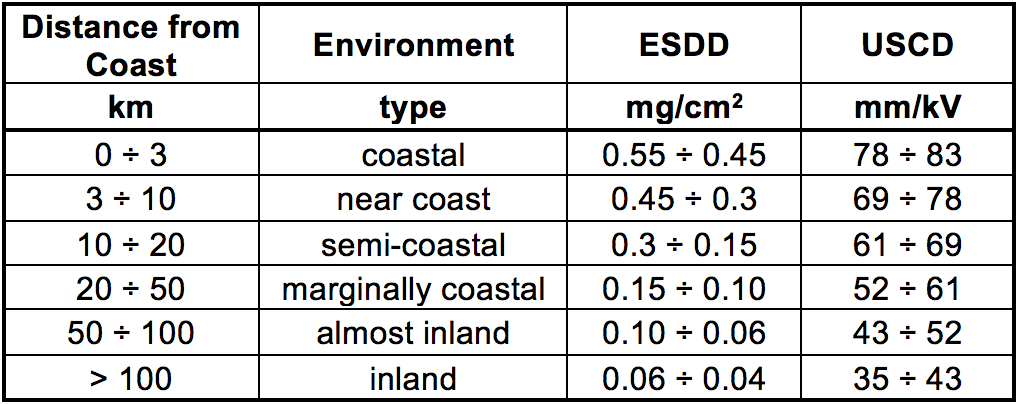
The above information was the basis for SEC specifications of the necessary USCD for AC insulators. The following values of ESDD were finally assumed by SEC to standardize the insulation for AC lines, as shown in Table 2:
• ESDD=0.3 mg/cm2 in the inland areas of WOA (Western Operating Area), EOA (Eastern Operating Area), SOA (South Operating Area), while a lower value was assumed for COA (Central Operating Area).
• ESDD= 0.55 mg/cm2 in the coastal areas
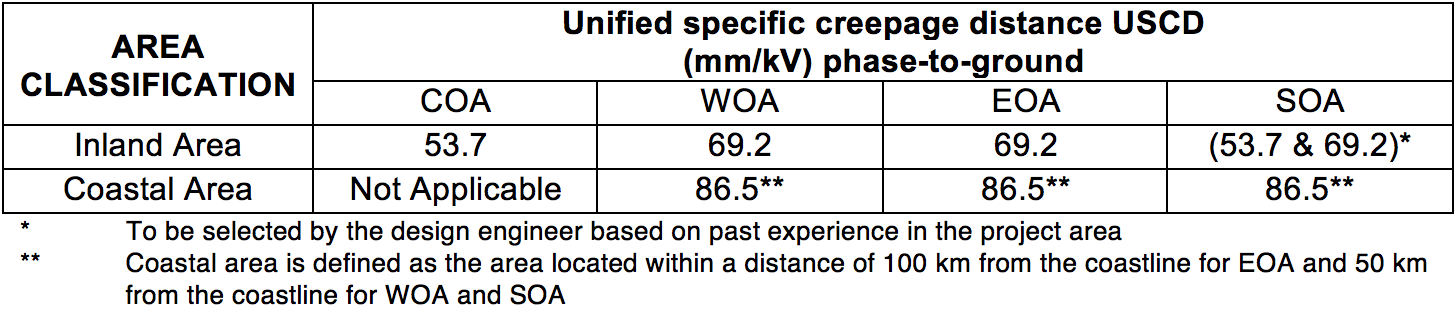
Specified for AC Systems in SEC Specification for
Glass/Porcelain Insulators
Available information indicates that AC lines equipped with cap & pin insulators with USCD=69.2 mm/kV perform well inland without a significant flashover rate and without need of washing, indicating that the assumed USCD conservatively represents the environmental conditions considered.
On the other side, AC lines with USCD=86.5 mm/kV were still found critical in the most severe environments, requiring washing, even if more rare than in the previous conditions, where lower USCD were adopted.
Pollution Severity for DC Systems
No data are available at present about the contamination on DC energized insulators in Saudi Arabia, therefore reference is made to the most up to date international experience. DC energized insulators may accumulate more pollution than AC energized or non-energized insulators, due to the permanent static electric field surrounding DC insulators. The ratio of DC to AC accumulated pollution varies from one site to another and is the result of a complex interaction of a number of parameters. It is therefore not possible to accurately predict this ratio (see Fig. 4). Long-term measurements (2-3 years) on DC energized insulators in typical coastal areas and inland areas could be very useful to optimize the design. Taking into account the indications in the literature for a pollution level ESDD from 0.1 to 0.55mg/cm2 (typical range for AC insulators in KSA area), the enhancement factor Kp may be assumed to vary from 1.1 to 1.6.
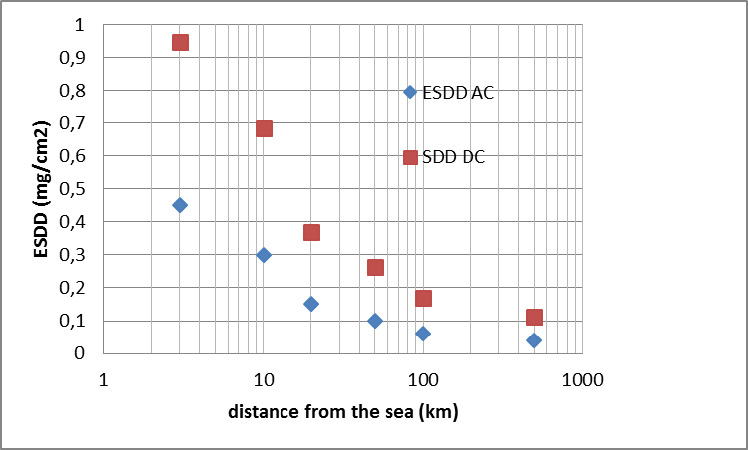
For evaluation of the insulation strength, the SDD value, salt deposit density as in IEC 61245, is necessary to be defined. This value makes reference to the standardized condition of tests with NSDD close to 0.1 mg/cm2. An estimate of the SDD was made starting from the ESDD AC values in Table 1, considering:
• influence of NSDD (assumed 5 times the one in AC), evaluated on the basis of references in published literature
• DC enhancement factor (value of 1.1 for the highest severity and then varying up to a value of 1.6 for the lowest severity considered).
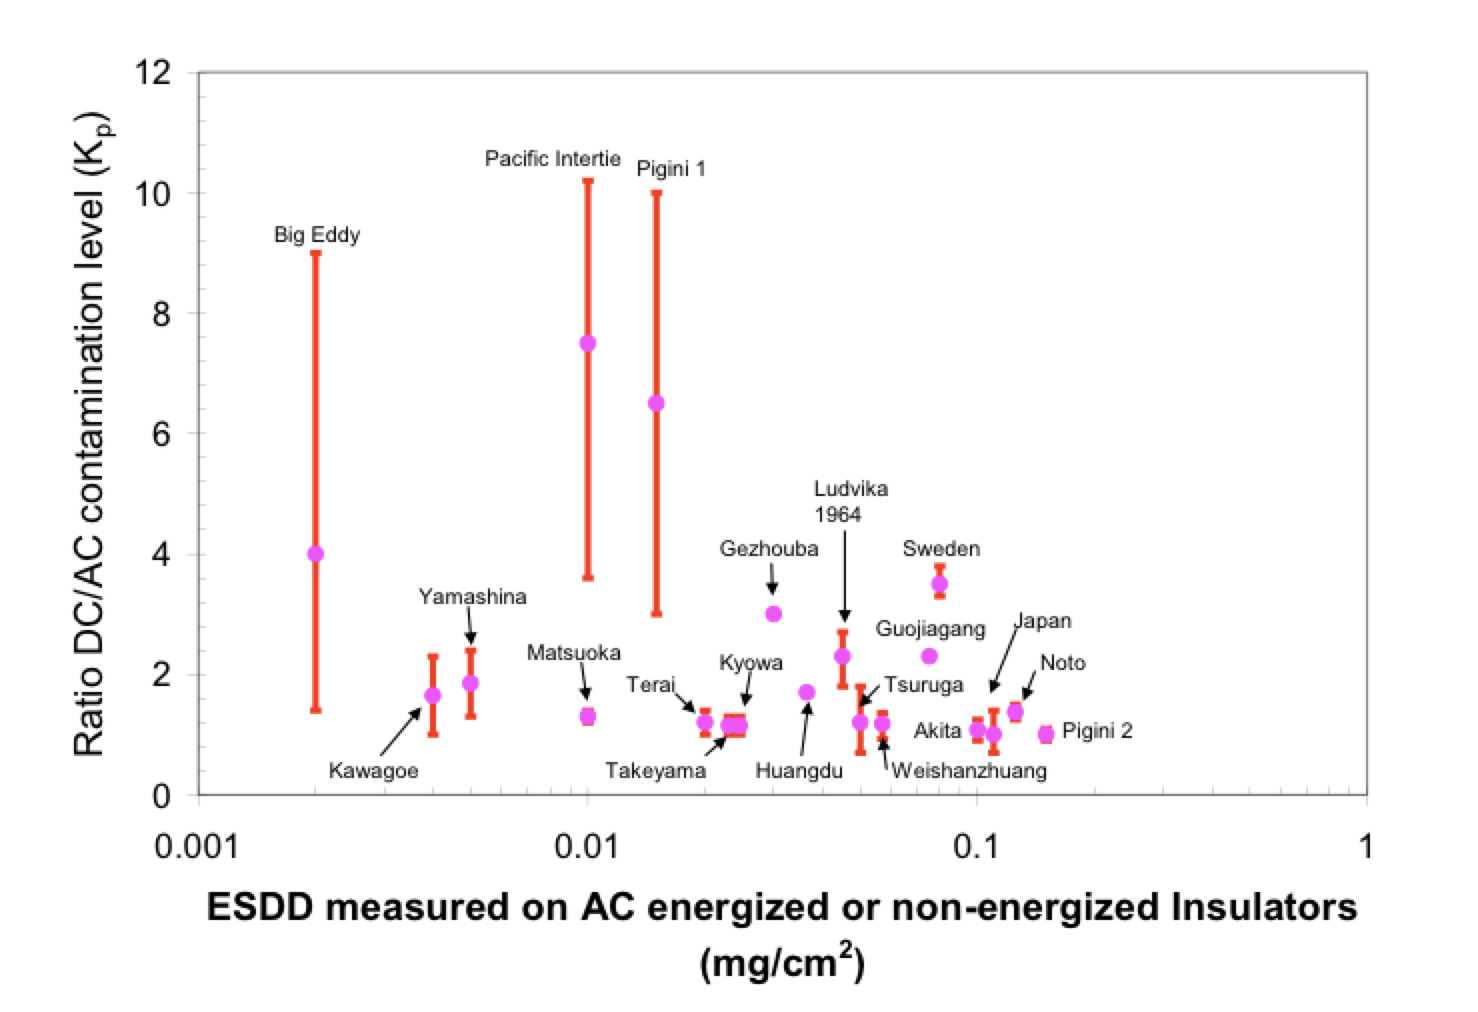
Fig. 5 reports on pollution severity SDD taken as a basis for DC design.
Number of Pollution Events
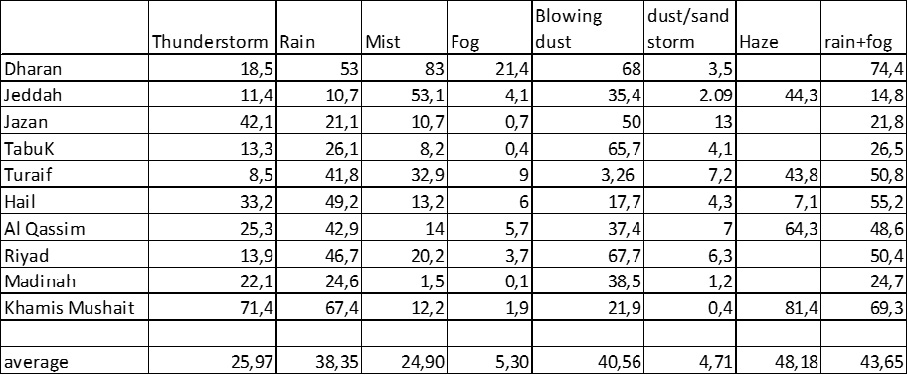
Insulation contamination is not critical by itself. It becomes critical only if suitably humidified. A conservative estimate of the pollution events may be obtained by summing the number of fog days and rainy days. An indication of the data of interest with reference to the Saudi Arabia territory may be obtained from the literature. More recent data averaging the information from 1985 to 2010, are reported in Table 3. To be less conservative, the assumption that only part of the events are actually critical can be made in flashover risk evaluation.
Estimating Insulator Withstand Voltage
Insulation strength is derived by laboratory test, where the withstand voltage is determined as a function of the salt deposit density SDD, according to standardized methods with the simulation of a NSDD condition of about 0.1 mg/cm2 (IEC 61245). The strength of insulators under DC is remarkably lower than in AC, thus requiring a much higher USCD for a specified SDD value. The curves in Fig. 6 average many experimental results for cap and pin insulators tested according to the standard procedure. A careful selection of the strength curve for the specific insulators to be considered for the final design is to be made, taking into account insulator characteristics on the insulator performance.
Evaluating Necessary USCD by Statistical Approach
When evaluating the necessary USCD in relation to the acceptable number of flashovers, the following aspects have to be taken into account:
• For ceramic insulators, flashover has no impact on the insulator material, since does not cause degradation. The flashover simply affects line operation reliability.
• The maximum contamination on insulators, assumed in the risk evaluation, is reached only after about three years.
• Only part of the humidification conditions of Table 3 can results really critical from the flashover point of view.
• By monitoring pollution contamination, the approaching to a critical condition can be identified, indicating the need, if any, to wash the insulators after long term service performance.
• Pollution events are not so critical as in AC, since in DC there is the possibility, during critical condition (e.g. rain or fog and heavily contaminated insulators), to operate the system at reduced voltage.
• The prescription of a very low flashover rate would remarkably impact on the necessary insulator length.
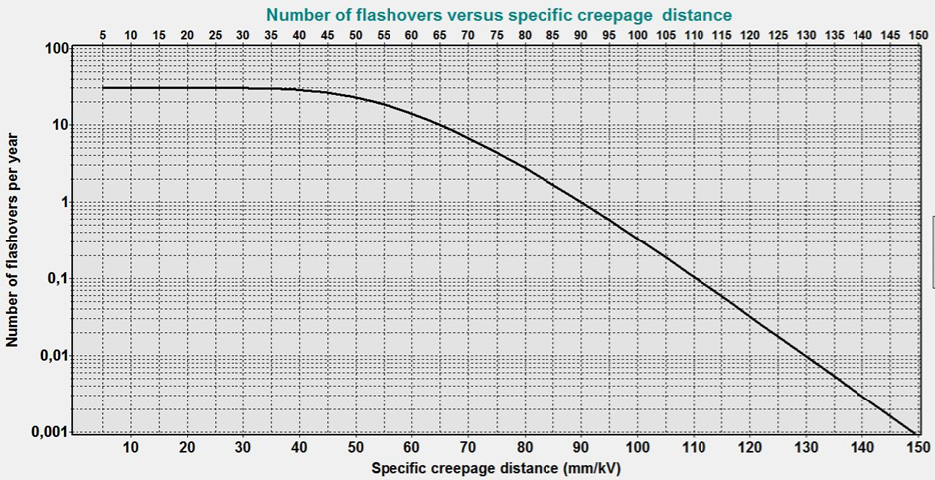
An example of calculations of the required USCD versus the acceptable number of flashovers is reported in Fig. 7. The calculations permit to evaluate the required USCD and then the insulator length for any required number of flashovers per year.
Required insulator characteristics have been evaluated statistically under the following assumptions:
• reference line length: 100 km;
• span length of 400 m (conservative assumption, as the average span in the actual line is longer, ³450m), with 500 insulator strings in parallel (assuming for V strings that only half of the insulators are in the most critical condition, those energized with negative polarity). The estimation may be more conservative for I strings. However the assumption is not very critical since the number of considered insulators does not influence remarkably the results;
• Two assumptions about the number of fog and rainy critical days: Ng=30 and Ng=15;
• USCD from Fig. 6, assumed as withstand values of a log-normal distribution with a standard deviation of 1.41 in p.u in terms of ESDD;
• SDDDC derived from AC data and corrected for the influence of DC voltage and for the influence of NSDD;
• Ratio of creepage distance to insulator length (Creepage Factor) equal to 3.3.
The necessary USCD evaluated according the following assumptions:
• 30 critical pollution events per year and 1 acceptable flashover per 100 km per year
• 15 critical pollution events per year and 2 acceptable flashover per 100 km per year (less conservative assumption) is reported in Table 4.
Taking into account all the above evaluation, the following USCD were finally adopted, to guarantee a flashover rate lower than 1/(100 km*year) in the conservative assumption of 30 critical pollution events per year for the specific line under design:
• USCD 74 mm/kV for the 720 km line section located inland
• USCD 90 mm/kV for the 50 km line section closer to the sea, considered conservatively as coastal (conservative assumption since the distance of the last km of the line from sea coast ranges from about 30 to 70 km)
From a standardization point of view, looking to other possible future DC projects in the KSA territory, no extra creepage is recommended to avoid unjustified oversizing of the insulator sets and towers geometry. In case of the few very severe conditions of lines to be installed very close to the sea, washing procedures may be recommended.
Insulator String Design
For suspension towers of the line the most common alternative set arrangements (I, V, Y) have been examined; the relevant outlines configurations are shown here below:
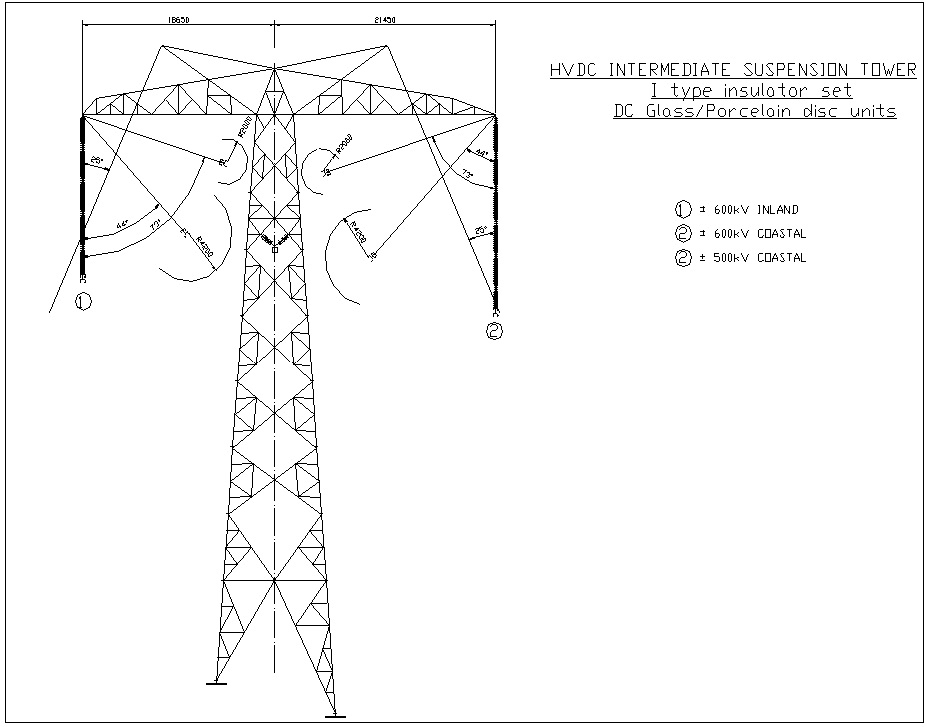
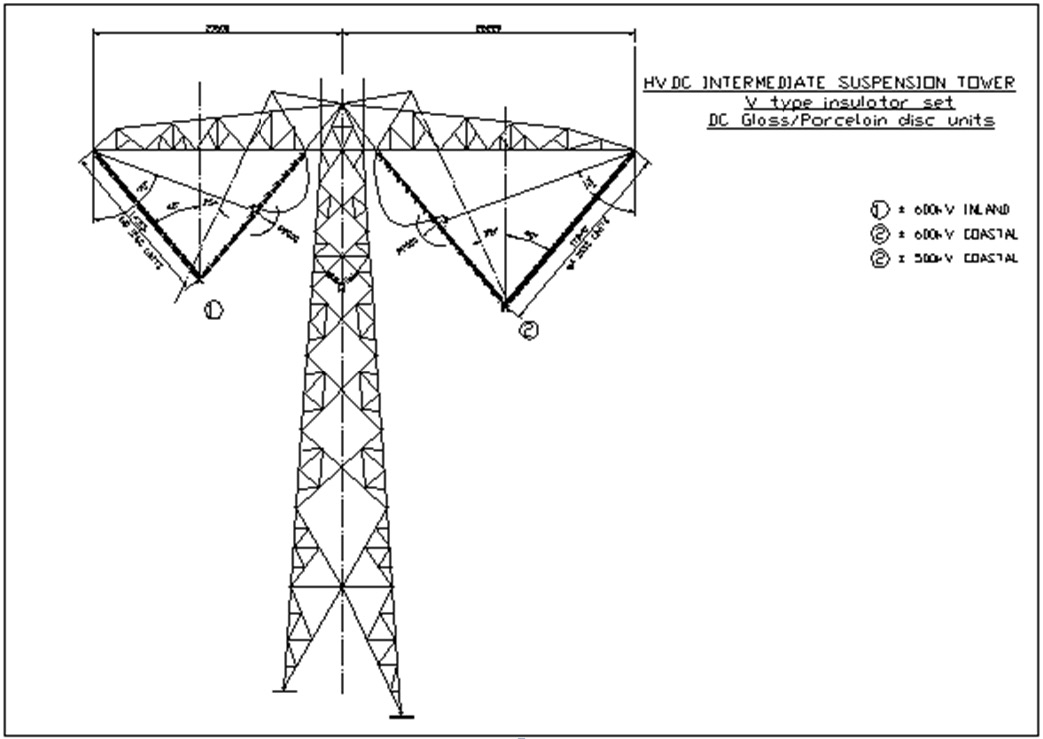
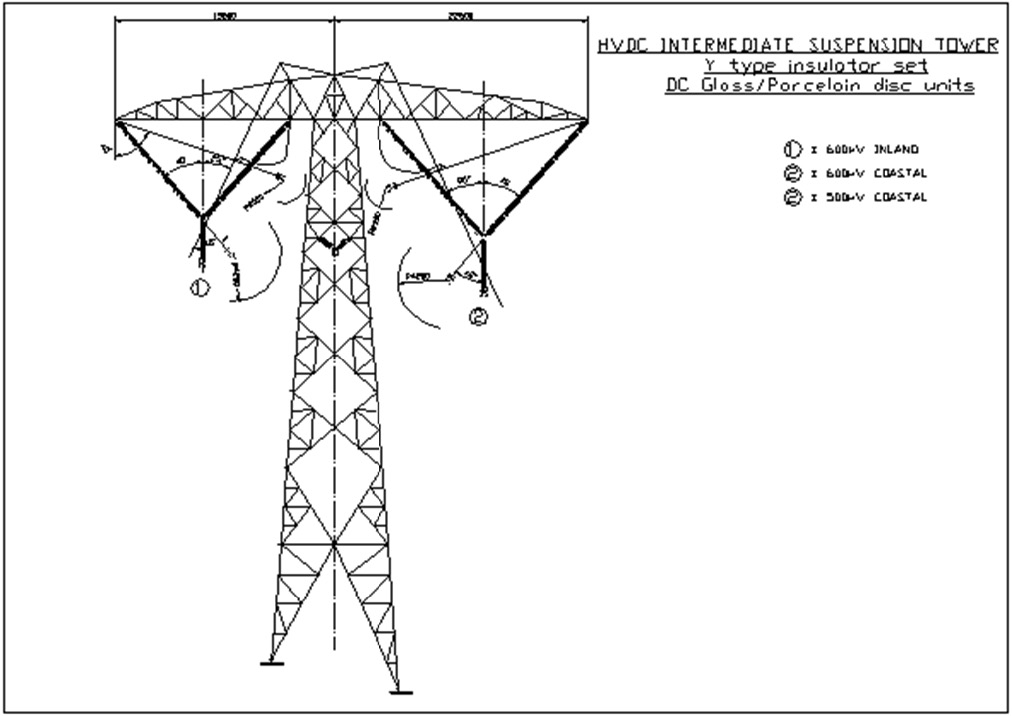
To be noted that in above outlines one (neutral) only was installed in the middle of the tower, while, in the final outline, two metallic returns have been installed on the main crossarms, near the poles (see Fig. 11). After in-depth analysis, the following pole insulator set arrangements were selected:
• Suspension set: Y type, consisting of two single arms in upper V part, double vertical string in lower I part
• Tension set: Quad type
• Jumper suspension set: I type single string.
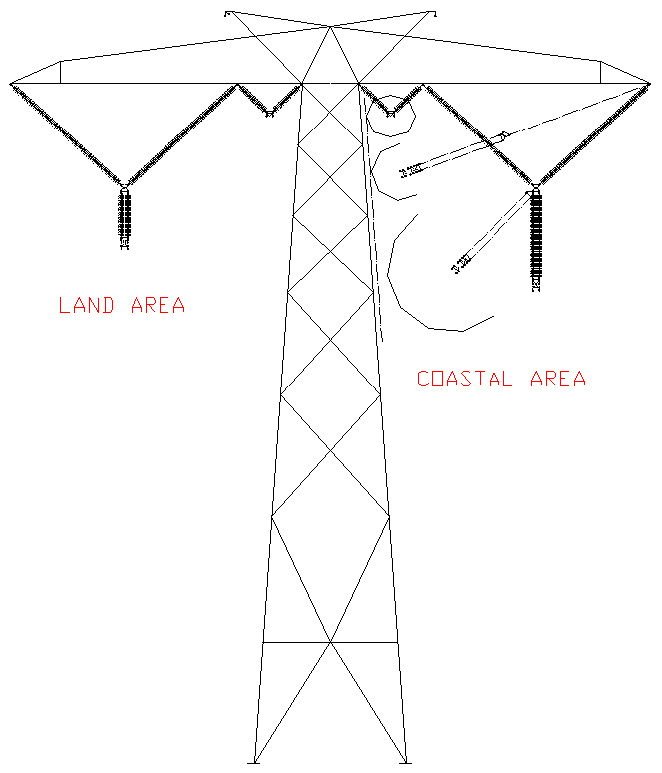
The Y arrangement (see Fig. 11), consisting of V and I parts, has been chosen to optimize the requirement as far as clearances, swinging, deformation, strength and security are concerned. The crossarm average height above ground level is about 45 m and the 14.6 m horizontal distance of pole conductor from tower axis is much lower than in other possible alternative arrangements, reducing the torsional effect on the tower structure and the line ROW width.
To assure the highest security and same electrical behaviour as in the V part, a double (parallel) string has been considered in the I part. The V part has 52 insulators 300 kN type, with 635 mm unit creepage nominal length. The I part has a number of insulators variable from 2 x 20 to 2 x 37, 210 kN type, with 550 mm unit nominal creepage length. This solution allows achieving a total creepage distance varying from 44,020 mm (land area) to 53,380 mm (coastal area), corresponding respectively to 74 mm/kV and 90 mm/kV at rated voltage.
For tension towers, each string of the quad tension insulator set is composed by 300 kN type disc insulators with 635 mm unit nominal creepage distance. The selected number of units is either 74 or 90, depending on the two considered environmental conditions, with a total creepage distance of 46,990 mm and 57,150 mm, respectively, i.e. about 6% higher than the one selected for suspension towers.
Conclusions
The pollution severity to be assumed for design was determined accurately analyzing the information available in KSA, implemented by the most up-to-date information available worldwide. Necessary insulation characteristics were evaluated by the application of a statistical approach. An optimal insulation configuration was finally selected to reduce tower size and right of way as far as possible.