Mexico’s distinct climatic zones make power system design challenging. One notable example is the Yucatan Peninsula, with its relatively high incidence of atmospheric discharges which are not only seasonal but can also vary significantly from one year to the next. Planning for such potentially wide variability therefore dominates design and maintenance policies for regional transmission lines as well as grounding systems.
This edited contribution to INMR by Dr. Carlos Ramirez Pacheco of the Comisión Federal De Electricidad (CFE) discusses how Mexico’s TSO has applied a strategy of adaptation based on monitoring meteorological data to ensure reliability in this key economic zone.


A high incidence of atmospheric discharges to transmission lines is one of the main causes of outages and can not only impact reliability but also the physical integrity of an electrical power system. In fact, one of the most relevant parameters when analyzing performance of transmission lines is atmospheric discharge activity in the areas where they are located.
Estimating behavior and most suitable transmission design under a high atmospheric discharge density is typically carried out considering both grounding system and shielding of lines. This involves evaluating the effect of lightning on failure rate of lines and working to improve performance by implementing suitable measures based on available decision-making tools.
In the case of those countries located between tropical zones, atmospheric discharges are traditionally one of the major causes of transmission line outages. In fact, studies have shown that between 40% and 70% of all transmission system failures in these zones are due to lightning. One of the reasons is that lightning protection of lines often relies on generalized procedures that sometimes do not properly consider high variability of seasonal storm activity. Fig. 1, for example, shows how storm activity across Mexico varied significantly between 2006 and 2016.

Variability of Atmospheric Discharges in the Yucatan
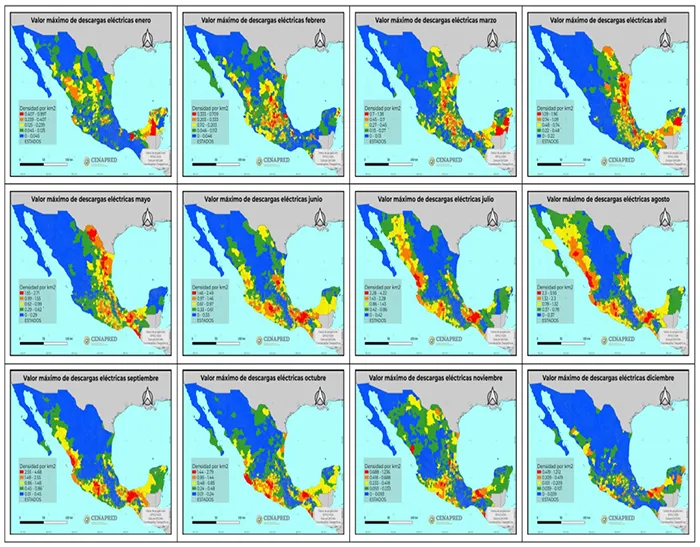
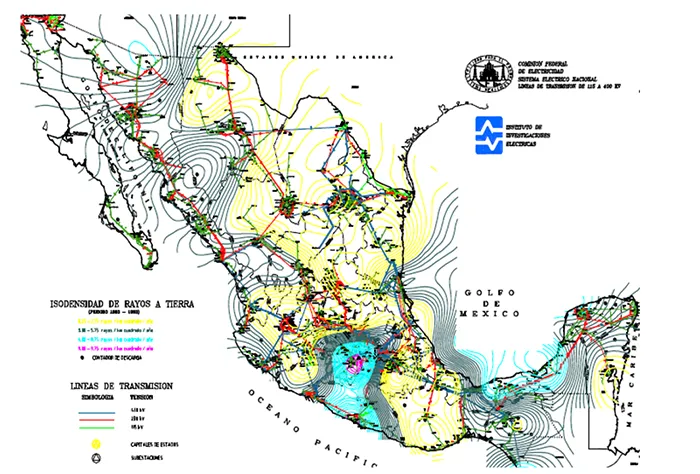
The highest incidence of atmospheric discharges during the year in Mexico is concentrated during August and September which are also the months with the highest rainfall. In addition to information on density of atmospheric discharges, the CFE collaborated in the past with the National Institute of Clean Energy to develop a map showing the density of atmospheric discharges to land from 1983 to 1993. CIGRE type lightning counters were utilized to create Mexico’s first iso-density map (see Fig. 2).
Although the information in Fig. 2 provided a valid approximation of atmospheric discharge activity across the country, important differences were observed for the Yucatan Peninsula. As a result, in 1998 the CFE developed an isokeraunic map based on data obtained from NASA’s ILS sensors (1997 to 2002), OTD from 1985 to 1997 and OLS from 1973 to 1985. This resulted in the map shown in Fig. 3.
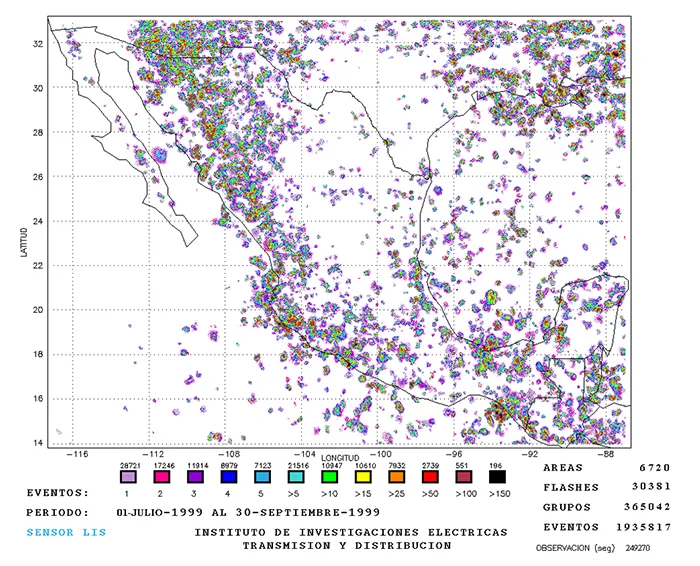

As can be seen, there is a good correspondence between areas of high atmospheric discharge density compared to Fig. 2. However, these now correspond to average time periods over several years and there is variability because ILS sensors, OTD and OTS also consider intra-cloud and cloud-to-cloud lightning.
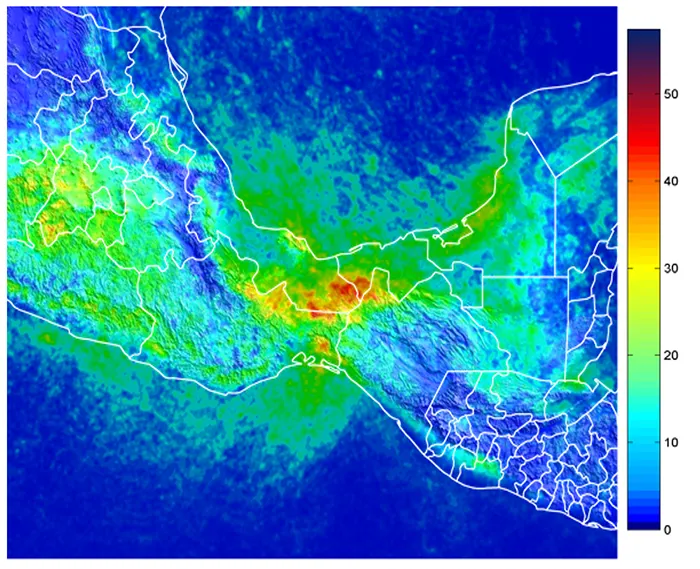
A better approximation to Fig. 3 is the map created in 2019 by Colombian company Keraunos with the LINET network (see Fig. 4). This map shows good correlation with Fig. 3 when it comes to concentrated annual data and considering cloud-to-ground, intra-cloud and cloud-to-cloud lightning across the Yucatan.
In 2005, Civil Engineering Management (GEIC), a branch of the CFE, installed an atmospheric discharge detection system in the Yucatan based on field sensors. These provided valuable information that allowed improved analysis of the distribution of atmospheric discharges. Figs. 5 & 6 show atmospheric discharges detected using this system during the months of August and September respectively between 2008 and 2011.
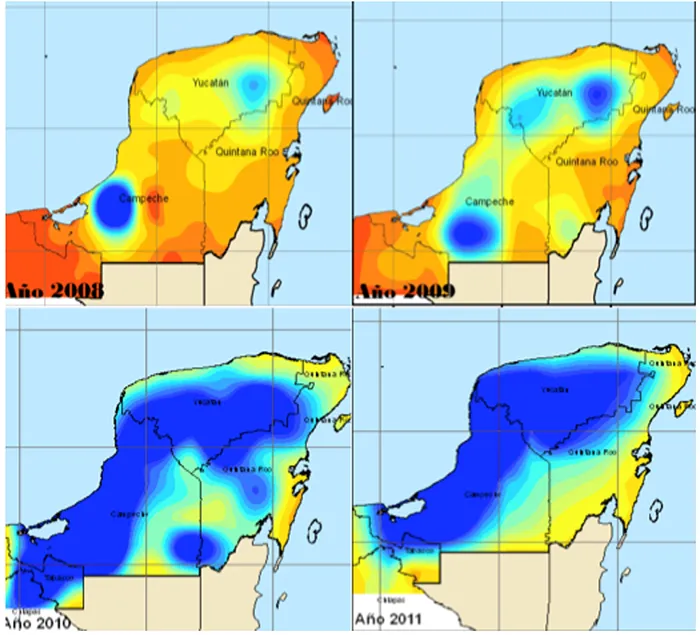
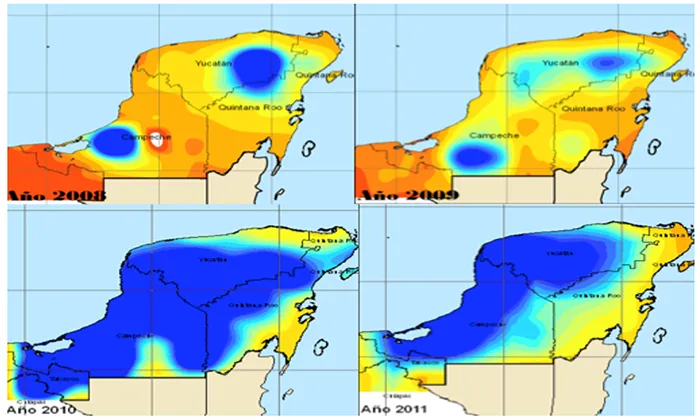
As can be observed, periods of maximum atmospheric activity (i.e. August and September) varied considerably over these years. In fact, comparing data on maximum density of atmospheric discharges versus previous years has demonstrated that a lightning density map concentrated over only a few years of data may not be sufficiently reliable when planning design and maintenance of electrical power networks.

Variability of Atmospheric Discharge Density & Failure of Transmission Lines
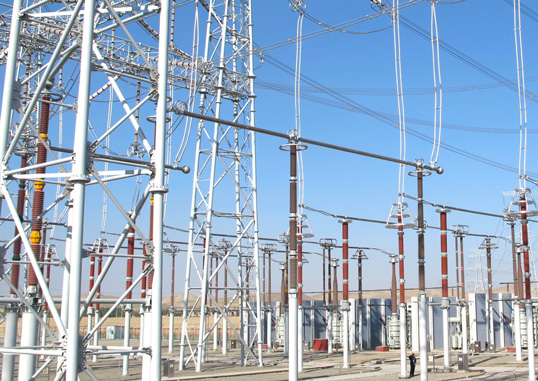
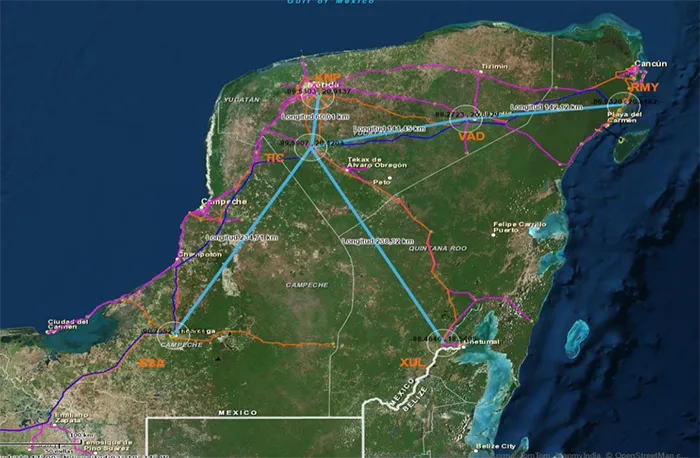
The electrical system in the Yucatan consists of transmission and sub-transmission lines of 400 kV, 230 kV and 115 kV. Due to large consumption centers as well as immportant transport and touristic activities, reliability must be ensured and one of the challenges is protecting the region’s transmission system against atmospheric discharges. Fig. 7 shows that these transmission lines travel along paths with high atmospheric density and across swaths of jungle that are difficult to access.
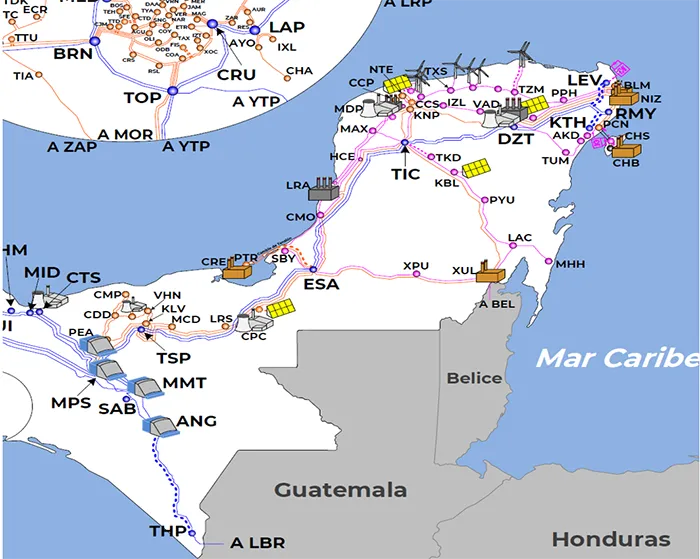
Fig. 8 depicts the incidence of transmission line failures due to atmospheric discharges (red bars) covering the period from 2001 to 2011.
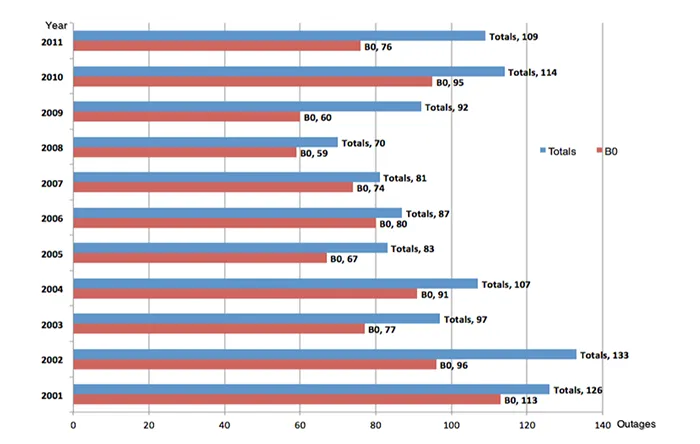
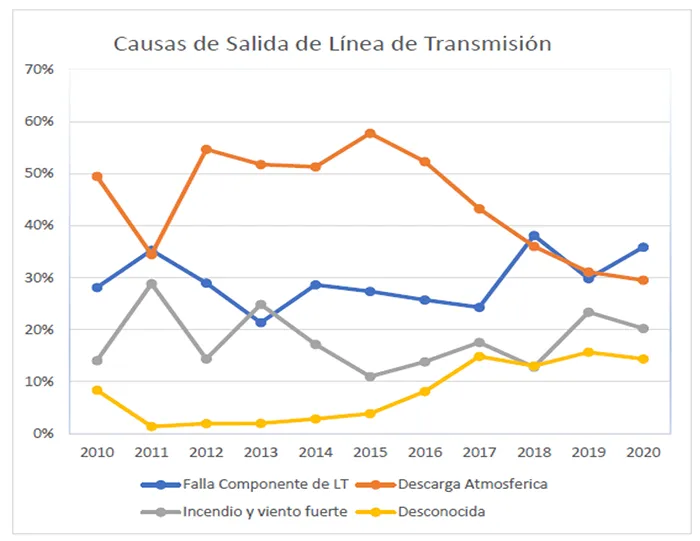
As evident from Figs. 5 & 6, there is good correlation for the increased density of atmospheric discharges in 2010 and 2011 with the number of transmission line failures in the Yucatan Peninsula during those same years. Recent line failure data for 400 kV, 230 kV and 115 kV transmission lines (see Fig. 9), confirms that the main cause continues to be atmospheric discharges.
Evaluating & Locating Atmospheric Discharges Using Field Sensors
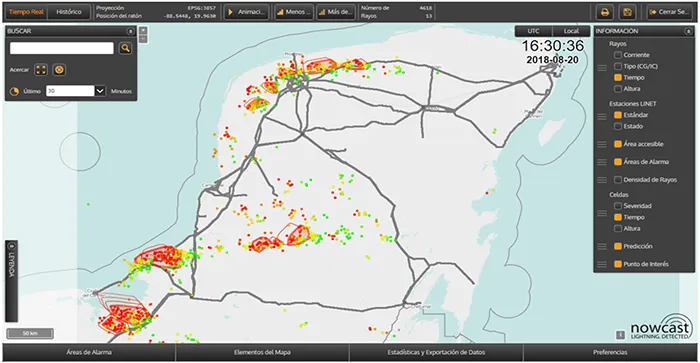
Due to these problems, in 2014 a project was launched to install a network of atmospheric discharge sensors (Lightning Location System) from Nowcast. This system has allowed analysis of lightning parameters as well as location and Fig. 10 shows the locations of these sensors in the Yucatan.
The configuration of sensors installed at substations across the Yucatan Peninsula’s grid has allowed 100% coverage. The LLS system offers visualization of discharges on a web platform with time stamp information and lightning parameters (as shown in Fig. 11).
In addition to this LLS system, an I3CM system has also been installed on different transmission lines to visualize electromagnetic transients and atmospheric discharges, while synchronizing such information and time with GPS and proprietary software. This system for both central and peninsular areas was functional until August 2020 and has yielded valuable data to allow analysis of the behavior of atmospheric discharges, their parameters and distribution across the area as well as the relationship to transmission failures.

Using Data from LLS System to Improve Reliability of Transmission Lines
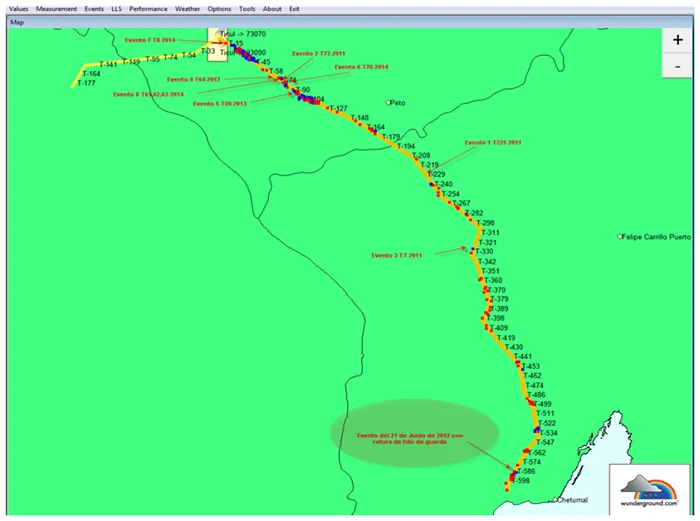
One of the important outcomes of the LLS and I3CM systems has been the ability to analyze historic faults and their distribution along transmission lines. Fig. 12, for example, shows a 230 kV line being monitored which has a length of about 235 km and passes through areas that are difficult to access yet with a high density of atmospheric discharges, as described earlier.
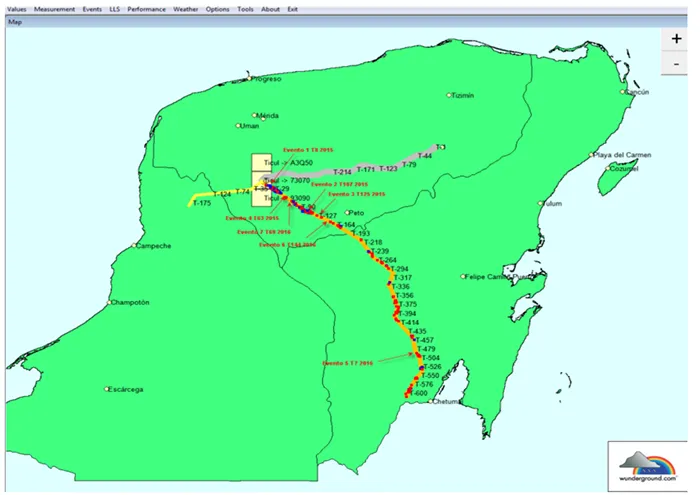
Fig. 12 shows that sections of this line experience a high incidence of atmospheric discharges, such as near the Ticul Substation. These areas also have a high rate of transmission line failures due to atmospheric discharges. Based on analyzing such data, subsequent maintenance programs have been aimed at improving shielding on this line in addition to selective placement of line surge arresters as well as improved earthing systems.
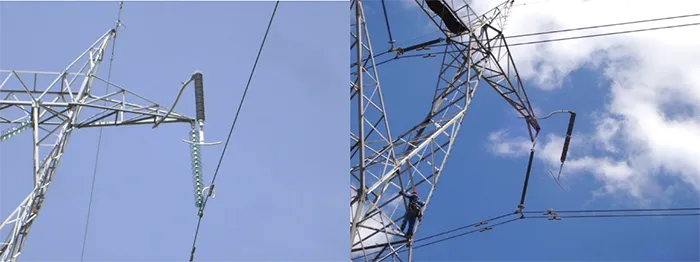
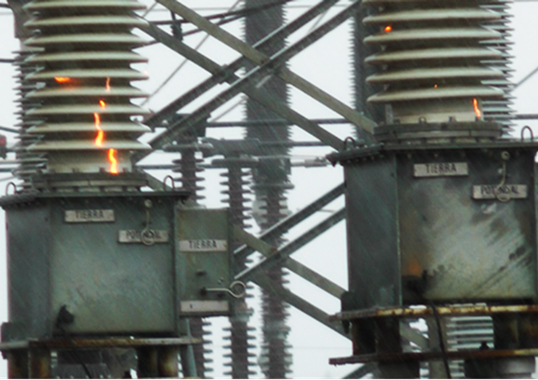
Another important outcome from using the LLS and I3CM systems has involved the ability to identify and analyze shielding failures. The shaded area in Fig. 13 for example shows the event of a broken overhead shield wire which coincided with an area of high lightning density on the line. Because it was confirmed that this incident was caused by atmospheric discharges, analysis was carried out to avoid recurrence by improving the shielding and grounding systems.
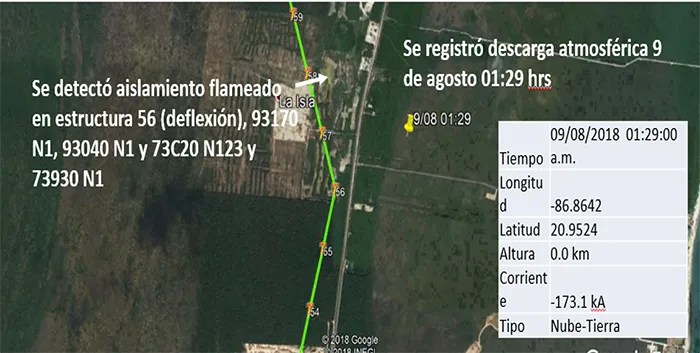
A similar analysis of failure triggered by atmospheric discharges was carried out using the NOWCAST web interface. As shown in Fig. 14, a failure was detected on a 115 kV transmission line in the city of Cancún, coinciding with an atmospheric discharge of considerable magnitude (173 kA) that caused multiple insulation failures on a multi-circuit transmission tower. In this case, modifications were made to the line’s shielding. Moreover, since this was an urban area, grounding systems were also reviewed and a study of selective placement of surge arresters was carried out.

Discussion
The high variability of annual atmospheric discharge density in the Yucatan Peninsula has imposed challenges for grid operator CFE. These involve improving shielding of transmission lines as well as selective placement of surge arresters based on analyzing data from the LLS system.
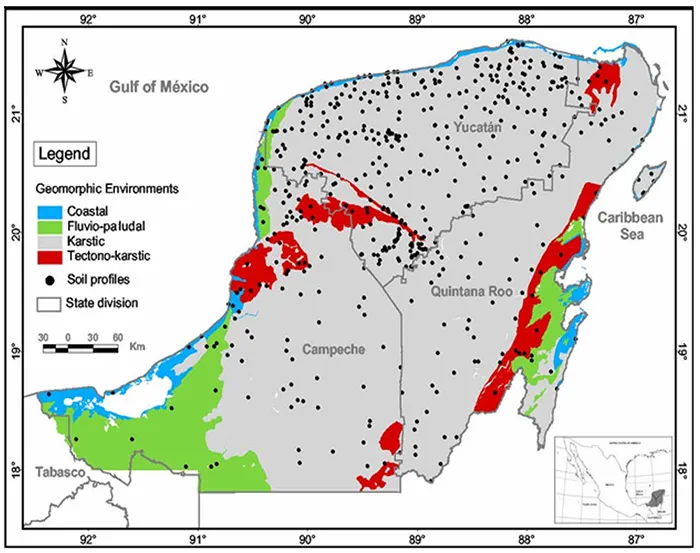
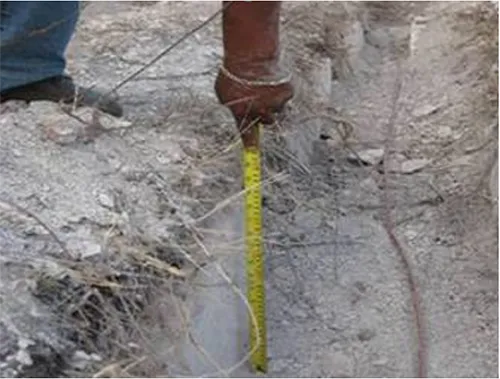
An additional consideration has involved analysis of the effectiveness of grounding systems along the trajectory of lines. Soil across most of the Yucatan formed over millions of years and is a Karstic type composed mainly of limestone (see Fig. 15). This makes it permeable to water and with high resistivity.
Such soil composition means that grounding systems applied along the line must be selective in nature due to the high investment cost needed each year to improve resistivity by adding chemical aggregates. These decisions benefit from observing and analyzing variability of atmospheric discharge density along any line’s path.
As discussed, density of discharge activity across the Yucatan can vary greatly depending on storm cloud formation during the rainy season. This is not the same year after year. Observations from LLS system data and past incidences of line failures across the Yucatan show that there has been strong empiric correlation between solar activity and density of atmospheric discharges, especially in 2001, 2011 and 2015 (see Fig. 17).
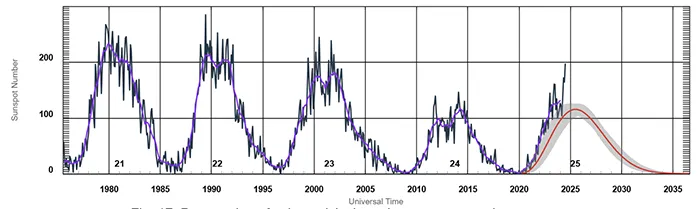
The effect of solar activity on cloud formation has been studied at length but may not itself conclusively account for high variability of atmospheric discharge density in the Yucatan, which might also be influenced by other factors.
Conclusions
There has been a history of high variability of atmospheric discharge density in the Yucatan which has affected reliable operation of transmission lines across the Peninsula.
Based on this as well as field experience at the CFE, it does not seem advisable to carry out design and maintenance of an electrical system based mostly on a map of atmospheric discharge density developed over a long period. Rather, data should be observed year after year and month by month with the help of a suitable discharge detection system and by analyzing such information in combination with relevant meteorological parameters. The goal is to optimize resources in the application of line shielding, ground systems and selective installation of line arresters.
The high variation in lightning density across the Yucatan Peninsula may have its origin partly in solar activity and focused studies are necessary to confirm if atmospheric discharges that impact power networks coincide with solar cycles.
References
[1] Ju-Feng Wang, Dong Wu, “Development of an arc extinguishing lightning protection gap for 35 kV overhead power lines, IET Generation, Transmission & Distribution, 11:11, 2017
[2] Diana Arlette Cordero Devesa, Martín Jimenez Espinoza, Actividad 4-1: Actualización de capas de índice de peligro y riesgo del ANR por ondas cálidas y odas gélidas, CENAPRED, 2021
[3] CFE, IIE. (1993). Proyecto para la determinación de Isolíneas de densidad de descargas de rayos a tierra. Cuernavaca, Morelos: IIE. Comisión Federal de Electricidad. (1986).
[4] C. Ramirez, G.E. Harper, “Improvements to the Protection of Overhead Transmission Lines Using Lightning Detection System in the Mexican Yucatan Peninsula”, International Colloquium on Lightning and Power Systems, Lyon France, 2014
[5] Alberto Braulio Alzate Duque, Tesis de Maestría, “Análisis de la Confiabilidad de Líneas de Transmisión Multicircuito Mayores a 115 kV en Zonas de Alta Incidencia de Descargas Eléctricas Atmosféricas”, Benemérita Universidad Autónoma de Puebla BUAP, México 2020
[6] CENACE, Diagramas Unifilares del Sistema Eléctrico Nacional 2023-2028, Programa de Ampliación y Modernización 2023.2037, Centro Nacional de Control de la Energía, diciembre 2023
[7] Eduardo Mestizo Sánchez, Tesis de Maestría, “Mantenimiento Predictivo de Líneas de Transmisión con el Uso de Equipos de Onda Viajera”, Benemérita Universidad Autónoma de Puebla BUAP, México 2022
[8] Gerencia de Líneas de Transmisión CFE, “Estadística de Salidas de Transmisión”, Archivo Gerencia de Líneas de Transmisión, CDMX, 2010-2020.
[9] Holler Harmut, Betz Hans Dieter, Finke Ullrich, Schmidt Kersten, “Lightning Detection”, Atmospheric Physics, Research Topics in Aerospace, ISBN 978-3-642-30182-7. Springer-Verlag Berlin Heidelberg, 2012, p. 331
[10] T Sadovic, S Sadovic, O. Hadžić, V. Pantić, “Expert System for Transmission Line Lightning Performance Determination”, CIGRE C4 Colloquium on Power Quality and Lightning, Sarajevo, Bosnia and Herzegovina, 2012
[11] Ella Vázquez Domínguez, Héctor T. Arita, “The Yucatán Península: biogeographical history 65 million years in the making”, Ecography 33: 212-219, 2010
[12] Francisco Bautista, J. Alfred Zinck, “Construction of an Yucatec Maya Soil classification and comparison with the WEB framework”, Journal of Ethnobiology and Ethnomedicine”, 6:7, 2010
[13] Space Weather Prediction Center, NOAA, https://www.swpc.noaa.gov/products/solar-cycle-progression
[14] Brian A Tinsley, “Solar Activity, Weather, and Climate: The Elusive Connection”, Bulleting of the American Meteorological Society, 104:12, pp E2171-E2191, 2023