Some failures of insulators can be traced to inferior design, materials or manufacturing. However, in most cases, the underlying cause of problems such as pollution flashover is improper insulator selection in the sense that either geometry or dimensioning is not ideal for the intended service environment. Monitoring the pollutants that deposit onto lines and substations is therefore among the most effective means of ensuring insulation is designed to cope with the stress levels actually experienced.
Several years ago, INMR accompanied a technical specialist from Eskom, the TSO in South Africa, to gather pollution exposure data at substations and sites with varying climatic conditions and pollution exposures.
For many years, Eskom’s Western Transmission Region dispatched a technical specialist monthly to collect data at selected points scattered across its vast service area. Each trip provided vital input to assist reliable operation of the grid since the information gathered was used to help engineers select required insulator creepage at substations. Extrapolating pollution data from one site to the next also allowed better understanding how pollution was affecting overhead lines.

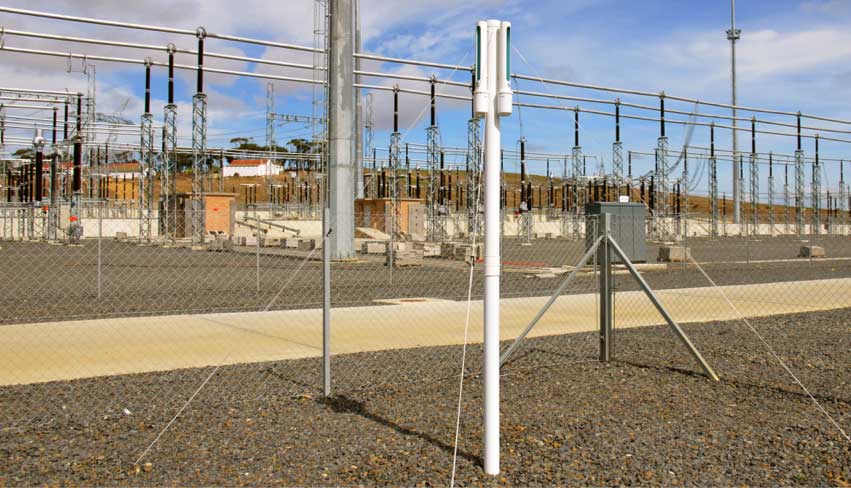
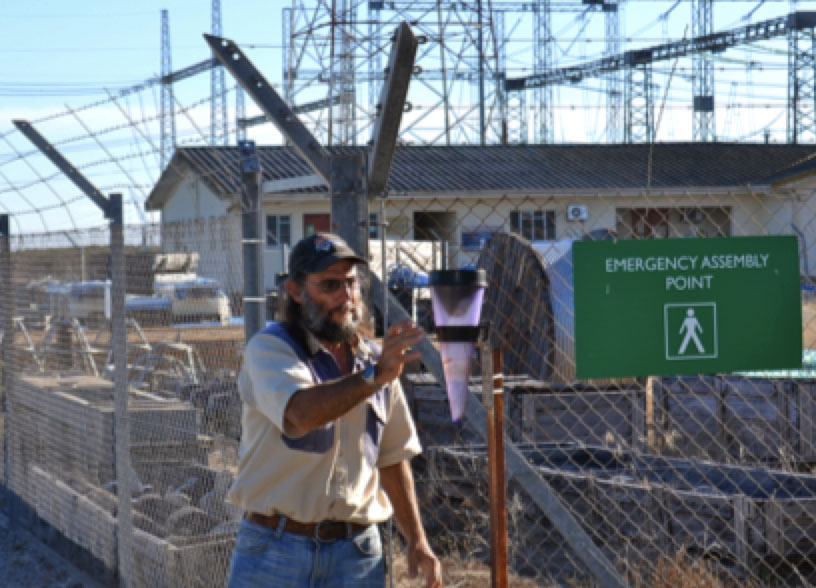
Among the motivations behind this program were wide scale pollution flashovers that blacked out much of the Western Cape in 2000 and have been a recurring problem since. The best way to anticipate such events and react in a timely manner is by constantly monitoring ESDD levels that affect insulators. In the case of Eskom, this task has been accomplished using a far-flung network of substations and other sites equipped with directional dust deposit gauges (DDDGs) as well as strings of reference insulators.
CLICK TO ENLARGE
While use of directional dust deposit gauges (DDDGs) first originated in England, Eskom perfected their application over the years beginning in the late 1970s and early 1980s. One of the keys to successfully using DDDGs is making sense of the data gathered but, once done, this information can prove invaluable in properly applying the philosophy behind pollution standards such as IEC 60815.
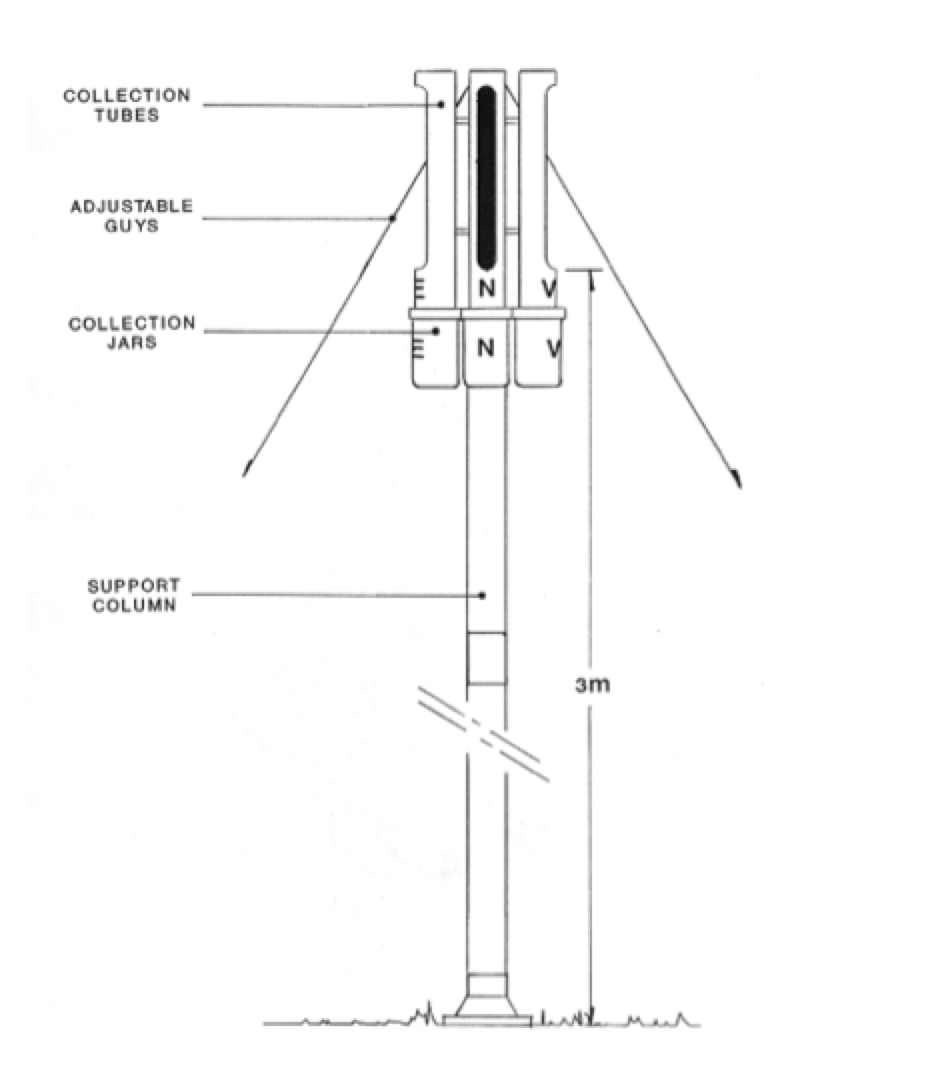
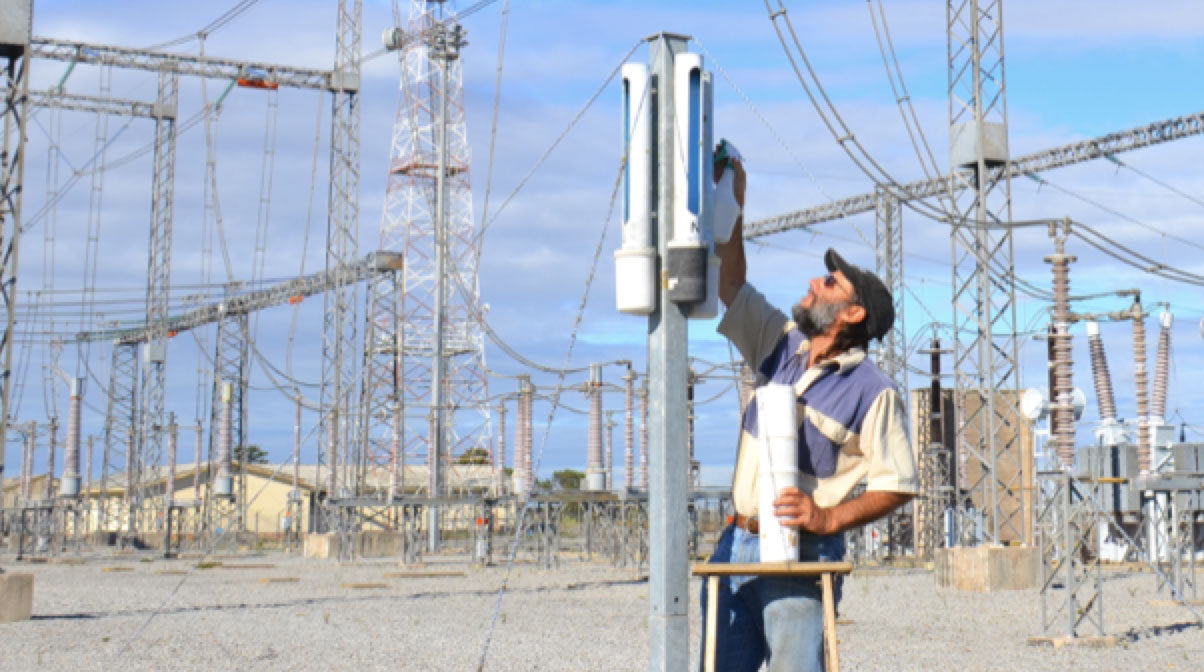
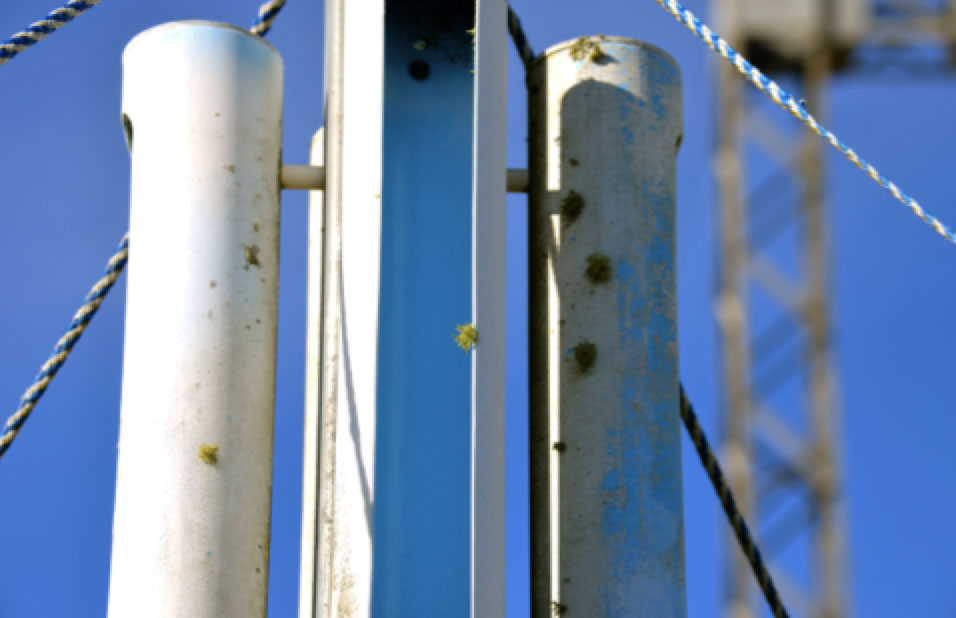
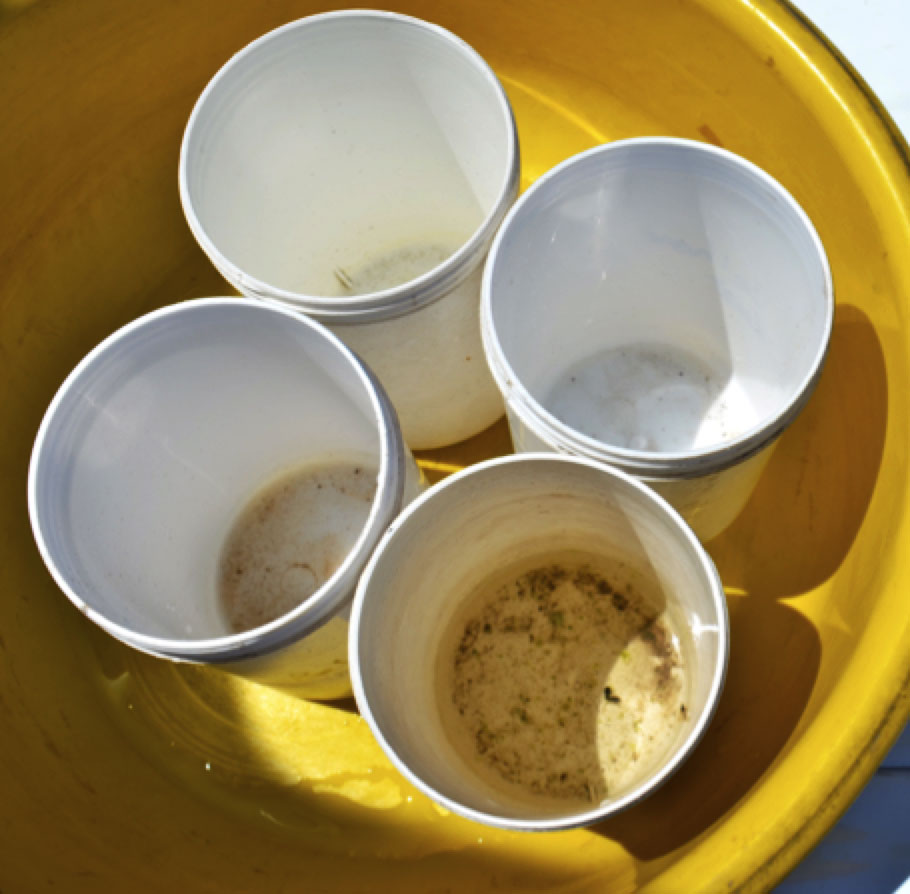
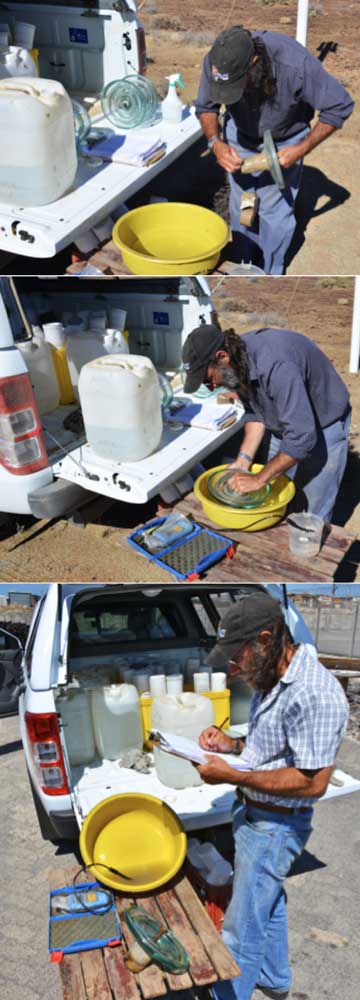
A standard DDDG is comprised of four vertical tubes, each with a large slot of standard dimension cut into its sides and arranged with proper identification to face all four directions on the compass. A removable cylindrical receptacle at the bottom of each tube collects all wind blown deposits that enter these slots. Before removing containers for analysis, the sides of a DDDG are sprayed with water to ensure that whatever particulate matter adheres to them is washed down into the appropriate container and included in the analysis.
CLICK TO ENLARGE
CLICK TO ENLARGE
Among the advantages of the latest generation of DDDGs is that they do not require an energy source, are relatively simple and cheap to install and are made from rugged plastic components. This makes them durable and also less a target for theft. A DDDG’s efficiency in collecting dust is greatest for relatively coarse particles and correspondingly less for very fine particles that the air stream typically sweeps around the gauge. Nevertheless, this same physical process is inherent in dust deposition on any objects in the path of wind and therefore offers a valid simulation of how contamination deposits onto insulator surfaces.
Not surprisingly, the volume of material collected in each receptacle depends mainly on wind direction and is greatest when it blows directly into the slot and lowest when it comes from a perpendicular angle. This means that the DDDG is also effective in indicating from where contamination most impacts a particular substation and helps identify pollution sources of greatest concern.
CLICK TO ENLARGE
Wind tunnel tests to see if contaminants could be blown out of a DDDG have confirmed that particles larger than 300 µm diameter remained unaffected, even at windspeeds up to 90 km/hr. Moreover, very small particles decrease only marginally with no significant impact in measuring net pollution levels – especially if one considers that high winds will also clean insulators of these same tiny particles.
CLICK TO ENLARGE
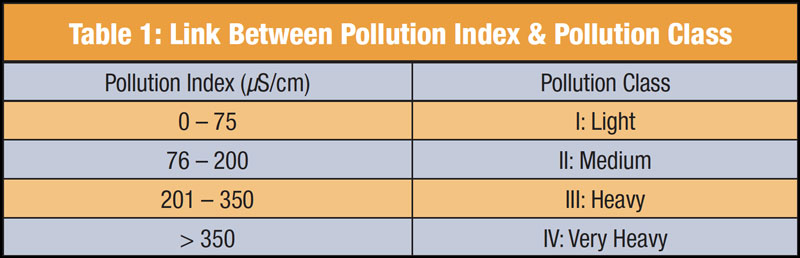
An analysis of each DDDG is conducted by adding enough de-mineralized water (i.e. less than 5 µS/cm) to make up a solution totalling 500 ml in volume, allowing for any water that may already be in the container from rainfall. After shaking to dissolve the contents of each receptacle, a portable meter measures resulting conductivity, which varies according to volume and nature of pollutants inside. The resulting Pollution Index established by the DDDG is then taken as the mean of the reading from all four directions, normalized over the 30-day period between readings. An additional application of a DDDG is filtering and weighing the resulting solution to assess levels of non-soluble pollutants (NSDD).
CLICK TO ENLARGE

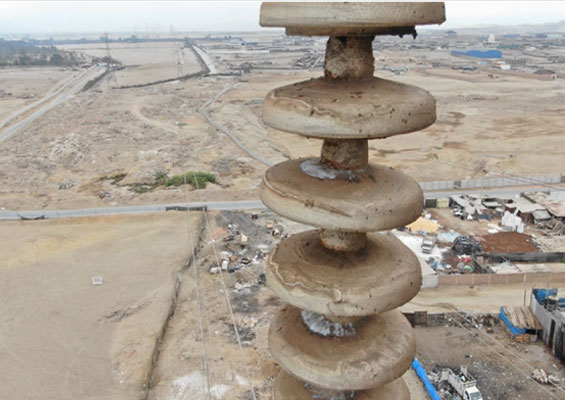
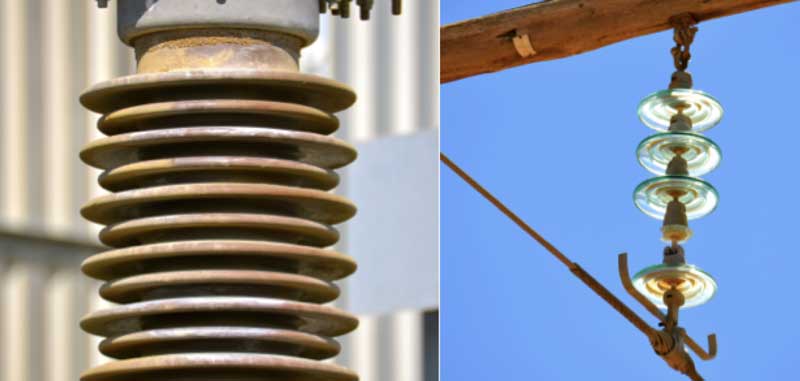
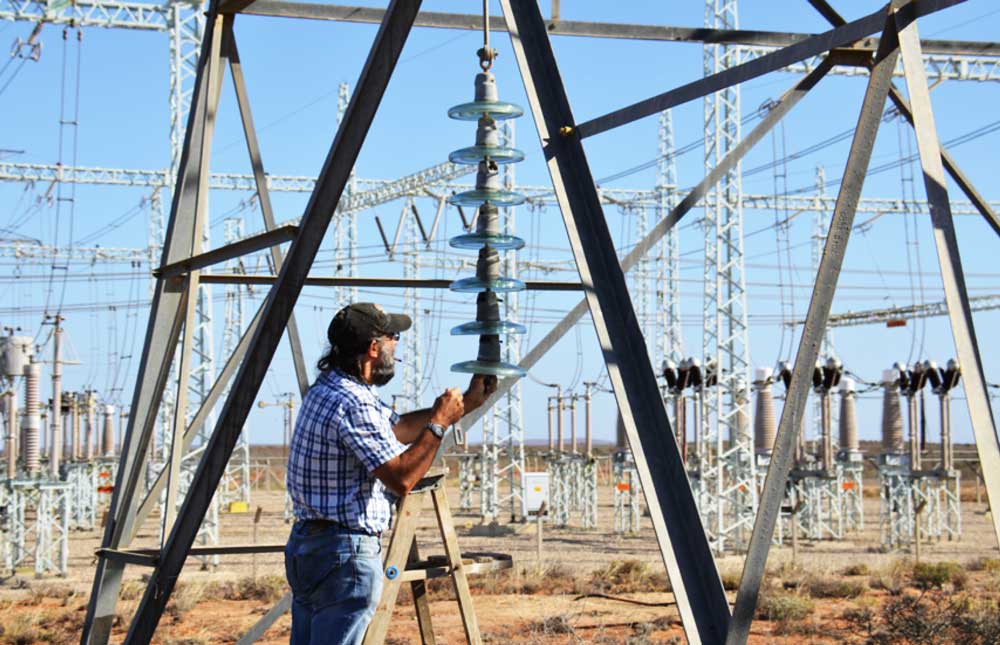
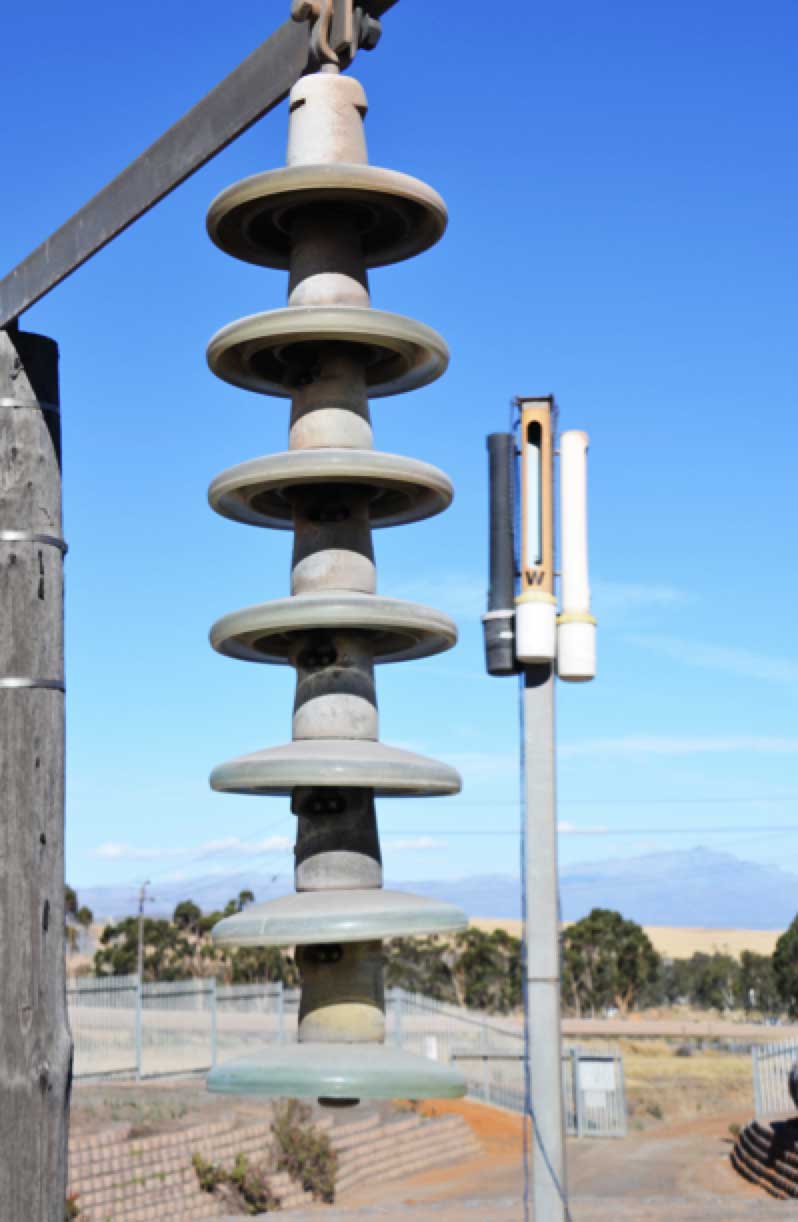
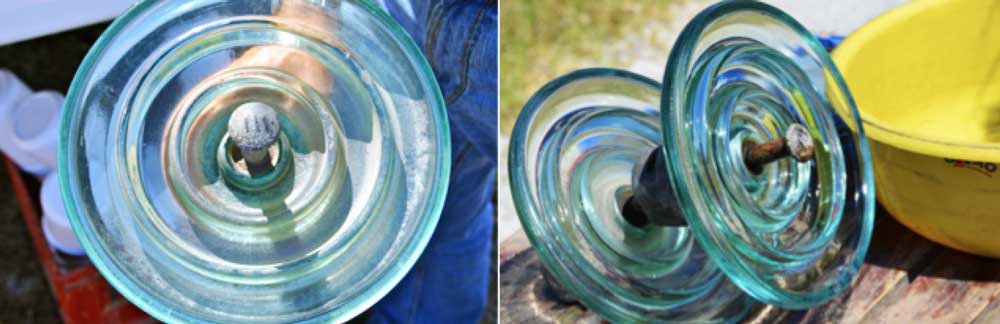
Another tool to monitor pollution exposure involves taking readings of contamination accumulating on the surfaces of reference insulator strings composed of 7 standard glass shells. Each disc in the string is analyzed at different time intervals with the top and bottom units serving only as ‘dummies’.
CLICK TO ENLARGE
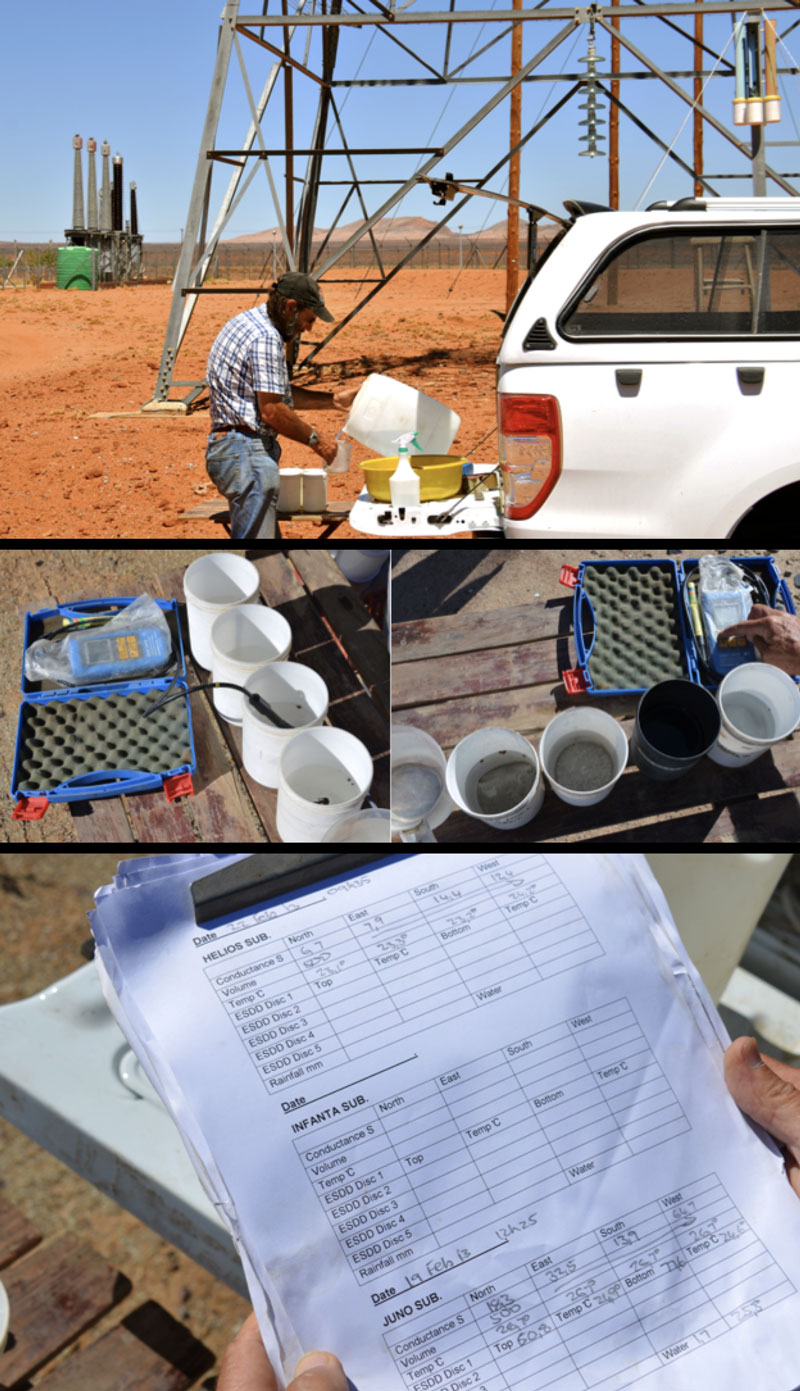
A measurement begins with wrapping the metal cap of the disc with tape to prevent its deposited contaminants from impacting the reading on the insulation surface. The glass is then washed thoroughly in a tub of de-mineralized water of constant one-liter volume before a meter reads conductivity of the resulting solution. Temperature of the water is also recorded to correct conductance values to a standard 20°C. Knowing the area of the glass disc (in this case 583.9 cm2 at the top and 704 cm2 at the bottom), associated ESDD values can be calculated for each. Readings are then averaged out and charted over time for every disc sampled from the string, along with information on rainfall to allow a complete picture of the real pollution scenario.
CLICK TO ENLARGE
ESDD readings for each disc typically vary by location in the string, with discs in certain positions more likely to accumulate pollution due to aerodynamic effects. Pollution data is then shared with central planning department staff as well as with individuals responsible for each substation as well as their supervisors.
CLICK TO ENLARGE
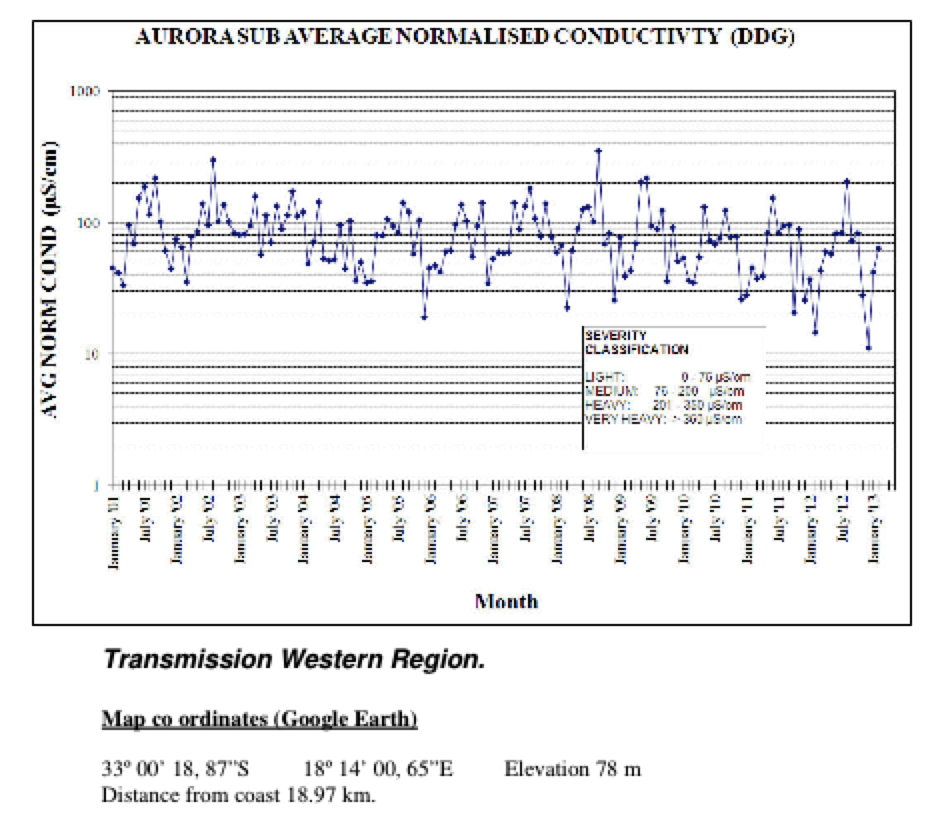
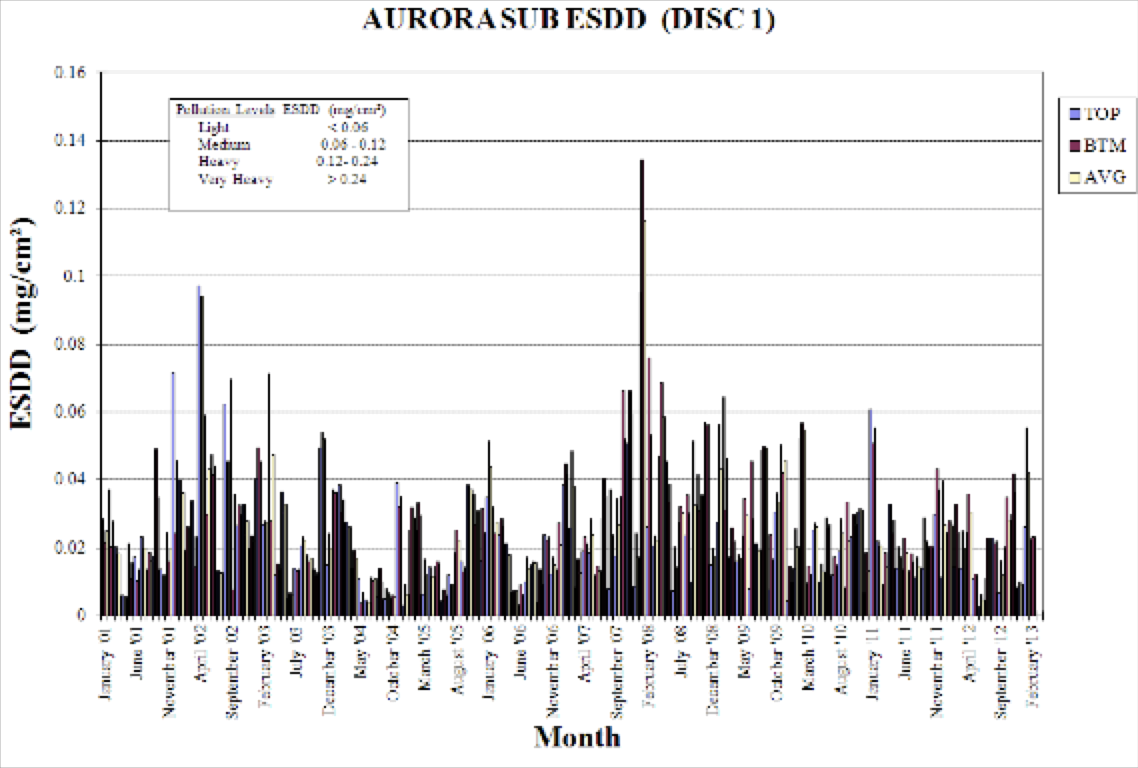
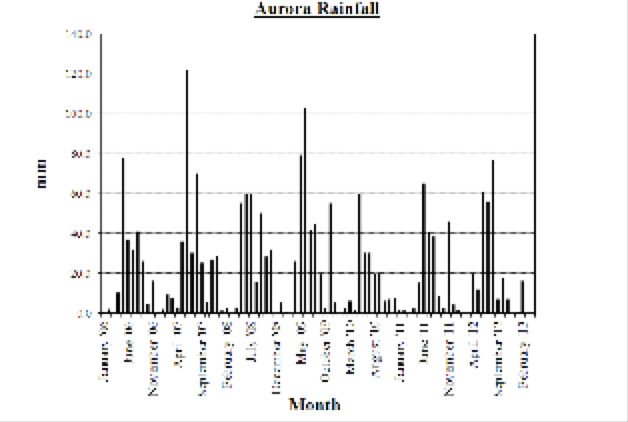
One of the DDDG and reference string sites that has formed part of Eskom’s pollution monitoring network has been the 400 kV Aurora Substation located north of Cape Town. Already about 50 years in service, the site is surrounded by mostly barren land but still classified as polluted due to nearby steel mills as well as the coastline.
CLICK TO ENLARGE
Results of DDDG Readings at Aurora Substation
Aurora Substation: Chart of Equivalent Salt Deposit Density
Aurora Substation: Rainfall
Not every DDDG and reference string site need be a substation. For example, Eskom also installed these in the Kalahari Desert bordering Namibia. The area is wildernesss with no major substations nearby but still considered important to monitor from a pollution standpoint since a new transmission line was planned to pass nearby. The specific location selected for the DDDG in this case was on the crest of a hill which experiences dust blown off a nearby dried salt lake bed.
CLICK TO ENLARGE
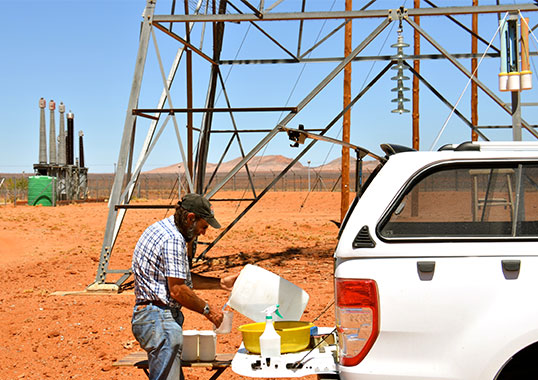
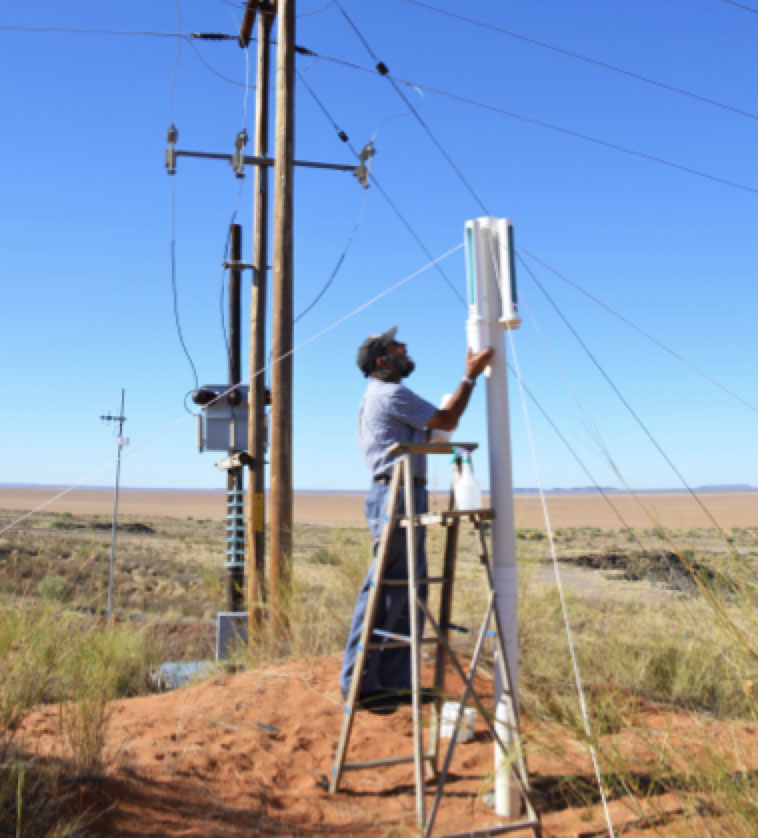
Another test location has been outside the northern city of Uppington, where a new solar generation facility was planned using concentrated sunlight to drive turbines. The site was also equipped with a full-scale meterological station enclosed in a shipping container.
CLICK TO ENLARGE
Engineers at Eskom state that data gathered over years of monitoring sites using DDDGs and reference strings has allowed better understanding pollution and how it impacts the network. Moreover, such data on natural ageing has also complemented whatever testing is done at laboratories since only by monitoring insulators in the field is the true story revealed of how they react to the natural environment. This allows adjusting laboratory tests so that these better simulate what is actually happening in service.
CLICK TO ENLARGE
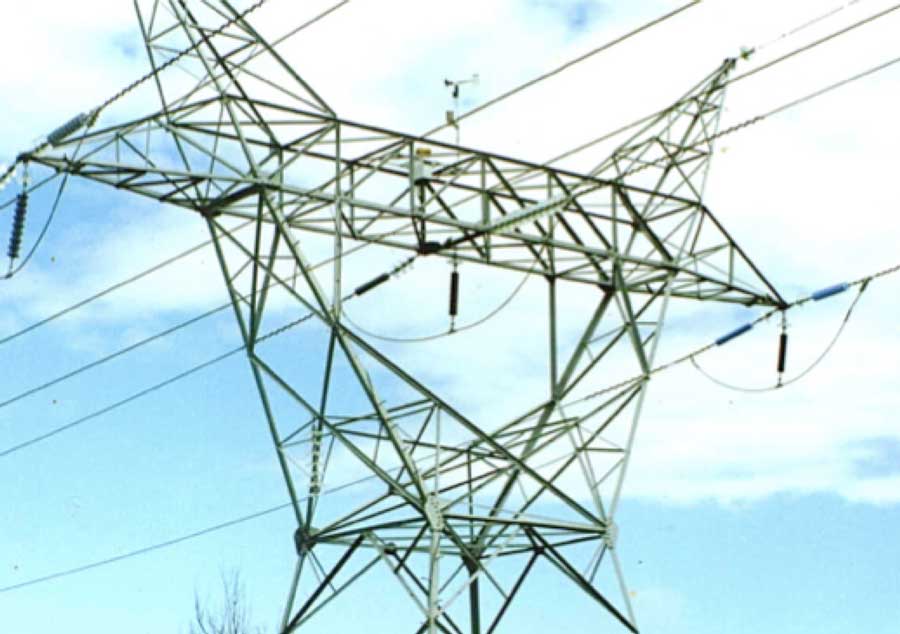
Another element in the process of monitoring and design for pollution is using test towers, such as have operated in South Africa and Namibia. These strain towers allow up to 9 test positions for different insulator designs, over and above those actually installed on the line. An on-line monitoring system and weather station were also installed and together provided data at 10 minute intervals on leakage currents, wind speed and direction, humidity, solar radiation and precipitation.

Data gathered and compiled using the network of DDDGs and reference string installations across South Africa has also helped identify which substations would be ideal for installing a new generation of montoring apparatus that energizes naturally polluted test insulators every 10 minutes to measure resistance and calculate ESDD. A leakage current recorder identifies the worst performing insulator profiles at that location and provides complete documentation on what is happening at any site from both a pollution and climate perspective.
CLICK TO ENLARGE
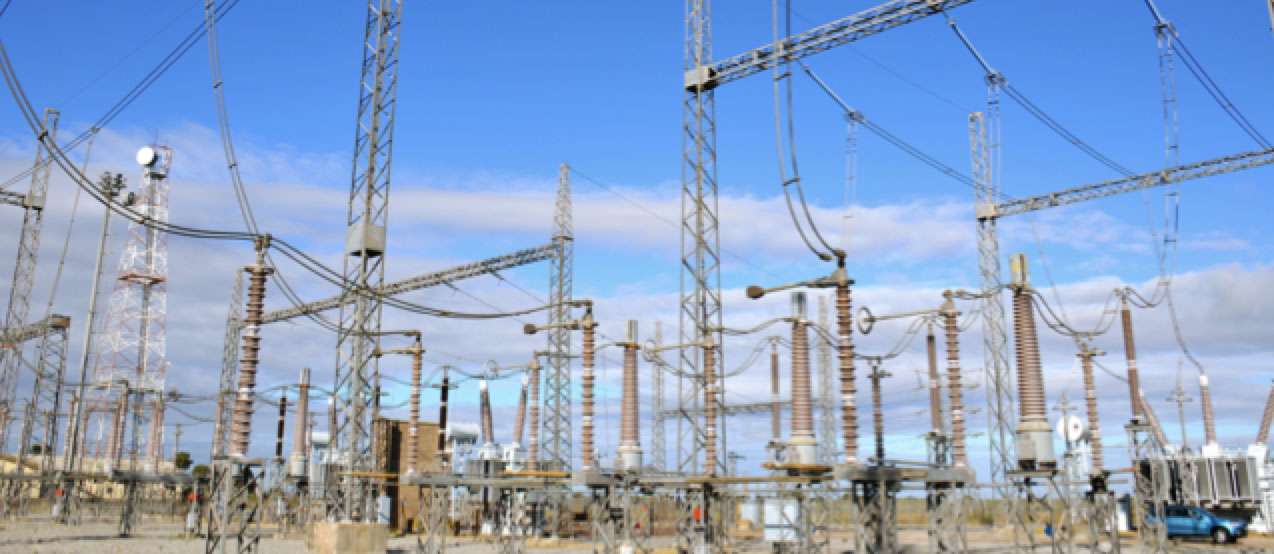
The important 765 kV Sterrekus Substation north of Cape Town offers an example of how pollution mapping using DDDGs and reference strings have contributed toward the design process. The station’s 31 mm/kV insulation was decided on as a direct result of years of monitoring and recording local pollution exposure.