Braced line posts (BLP) have been broadly accepted as a means to design compact high and extra high voltage transmission lines. This design sees a combination of two distinctly different types of insulators – a horizontal line post and a suspension insulator – in a triangular configuration with the supporting structure acting as the vertical member. However, in spite of their growing popularity, it has been left mainly to manufacturers to determine the most appropriate means to test such assemblies. From a mechanical standpoint, for example, there is no hard definition for the onset of elastic buckling for the line post member. A similar issue exists when electrical testing. While there are test standards for the suspension insulator and line post insulator as individual units, none exist for the combined BLP assembly.
This edited 2019 contribution to INMR by John Schonewolf, Design Engineering Supervisor and retired Principal Engineer, R. A. Bernstorf, at Hubbell Power Systems compared actual mechanical test data for a BLP design with analytic results obtained through finite element analysis (FEA). It also explored the impact on electrical values for line post and suspension insulators within the BLP assembly with unequal and approximately equal strike distances.
Mechanical Testing & FEA
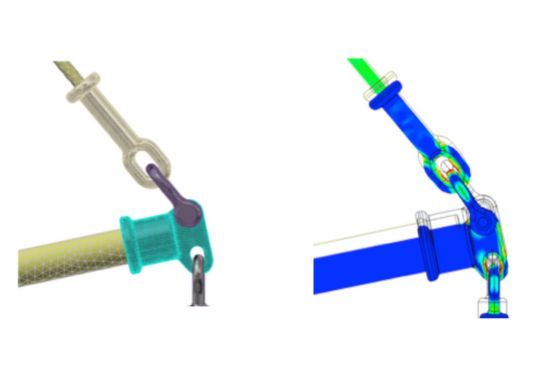
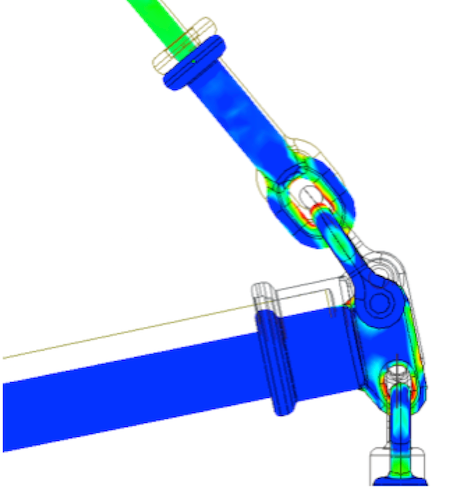
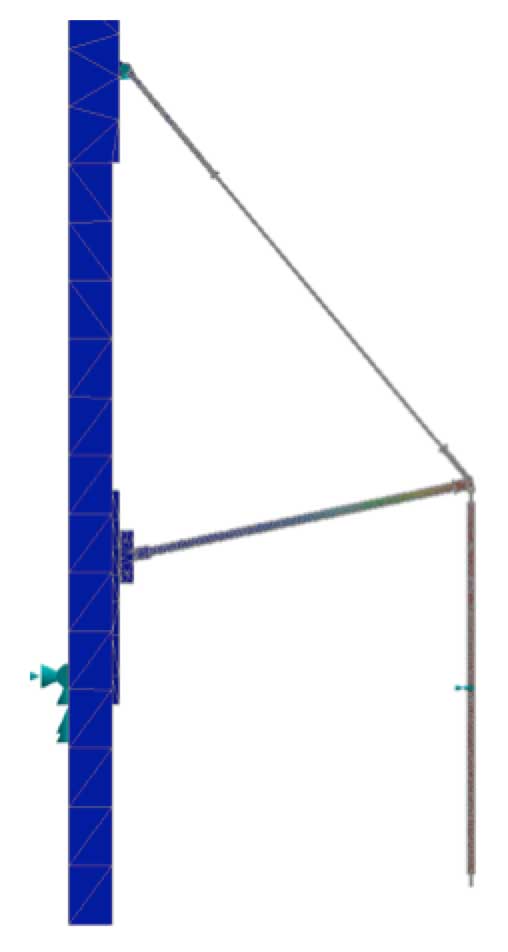
Finite element analysis has become a defining tool in mechanical system design and it is worth asking whether it could also be applied to accurately simulate and predict behavior of a BLP assembly. Answering that question requires understanding the material properties of such components as well as capable available software and actual results of physical testing. Since quality of FEA depends on good inputs to achieve good outputs, careful attention to detail is required to model 3D component geometry before applying the method. This ensures that the downstream operations of assembly, meshing and load application are efficient, without need for re-work loops. Fig. 1 shows level of detail of this process for a BLP assembly where the CAD is highly accurate compared to reality.
To further improve predictive results of FEA, proper analysis software and type of study should ideally be selected. In this case, AutoCAD Inventor 2018 Stress Analysis and the AutoCAD In-CAD Nastran 2018 FEA package were utilized to run static, buckling analysis as well as non-linear buckling analysis on the insulator system.
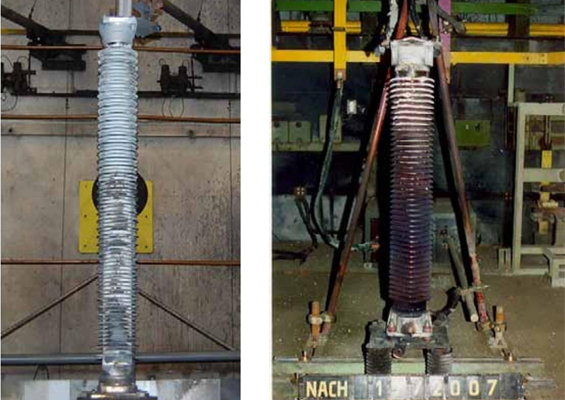
To advance design and understanding of braced line post assemblies, Hubbell Power Systems has for decades constructed equipment and developed methods to physically test BLP design variations. In 2018, for example, a vertical load test (M18-05-73) was performed to study the buckling characteristics of a braced line post comprised of a 98.5 in. section length post insulator and a 113 in. section length suspension insulator. Figs. 2 and 3 show the test set-up along with the detailed full-scale 3D model.
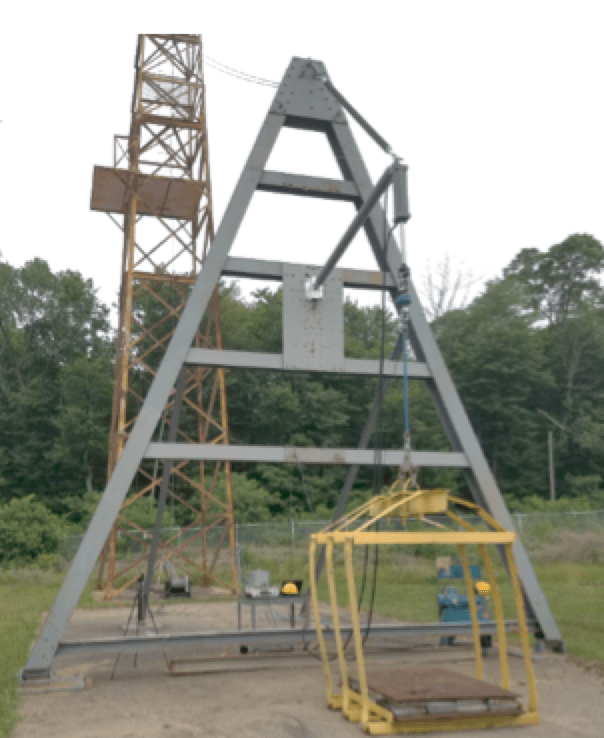
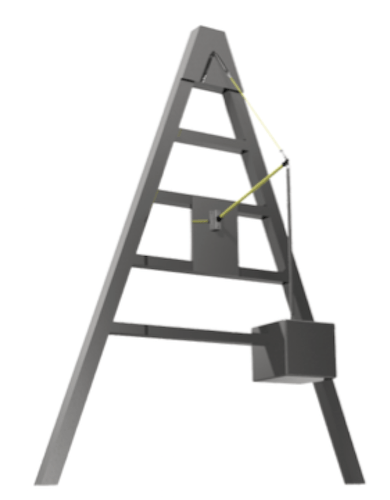
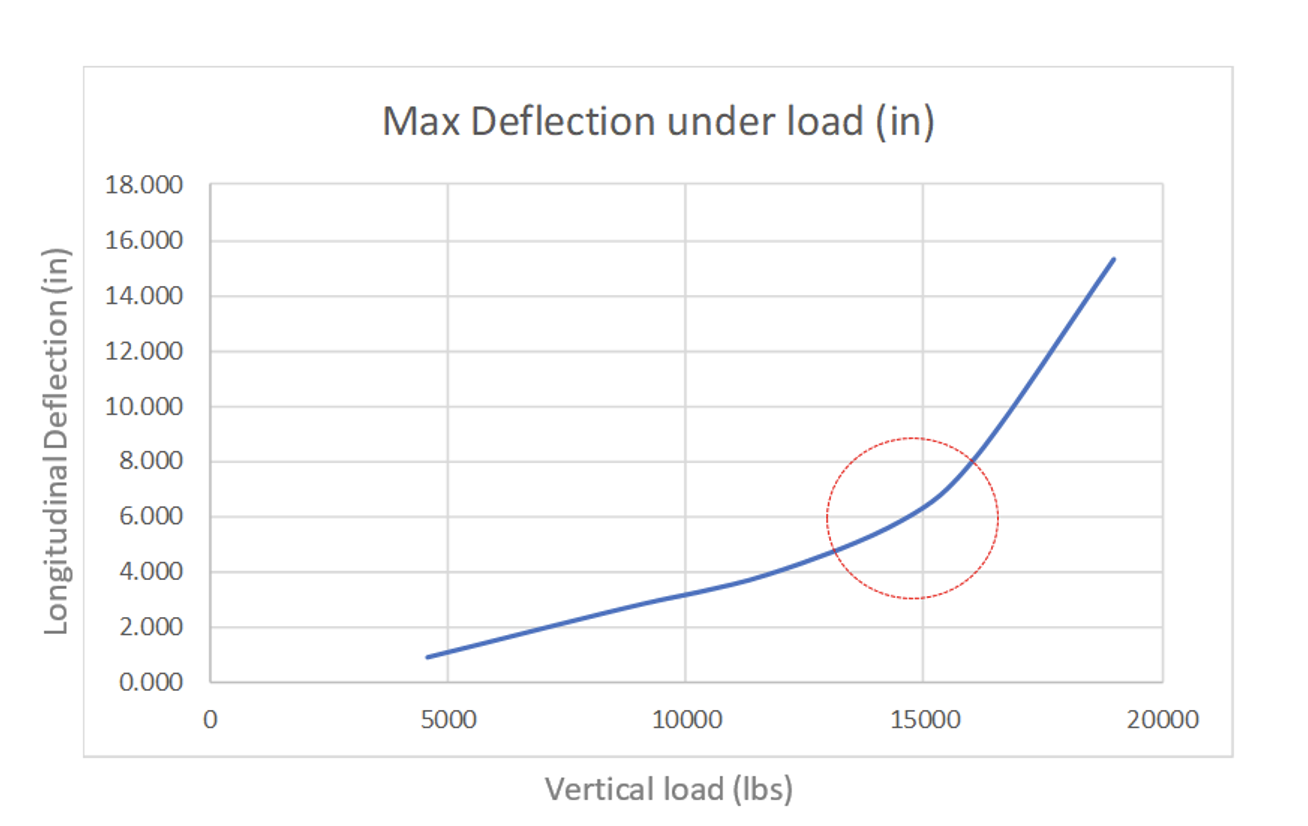
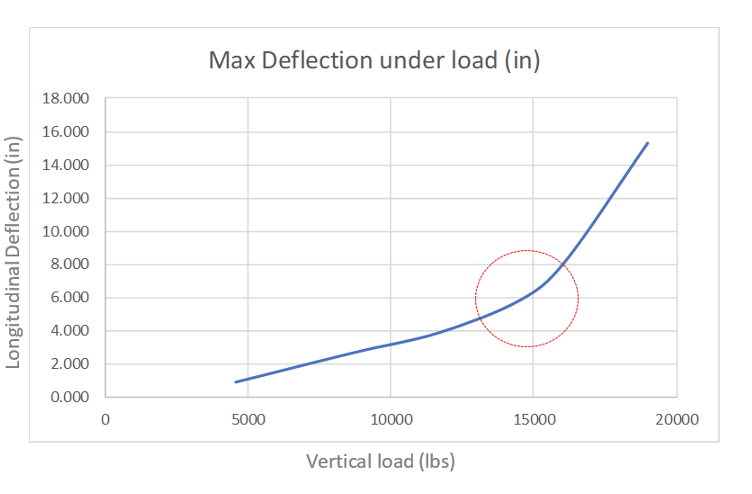
Based on length, diameter, mounting conditions and historical data, predicted onset of buckling of the line post insulator of length specified and 2.5 in core diameter was 10,080 lbs. (compression on post). Fig. 4 provides a graph of physical test results of deflection under vertical load. The change in slope is an indication of onset of buckling. At approximately 15,000 lbs, where this occurs, good correlation was shown since corresponding post compression load was calculated at 10,500 lbs. compared to the predicted 10,080 lbs. onset of buckling.

Details of FEA Method
Material Characteristics
As 3D models were created, each was assigned appropriate material properties consisting of high strength steel, ductile iron, aluminum and fiberglass rod. A key attribute of the rod was its Young’s Modulus, which was arrived at through empirical testing at a value of 6,000,000 psi. Another layer of detail is that a fiberglass rod is not isotropic in nature due to the uniform orientation of its glass fibers. Rather, it behaves as an orthotropic material.

Joint Characteristics
With a complex FEA consisting of multiple parts, the interface between components is critical to ensure the model has the freedom to move and interact appropriately. In the case of BLPs, this was achieved by a combination of constraints and contacts applied to each interfacing component.
Hardware Modeling
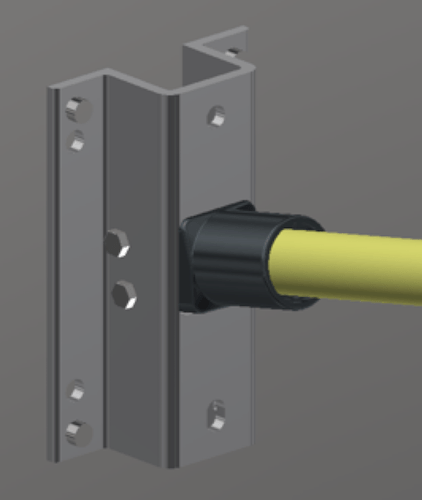
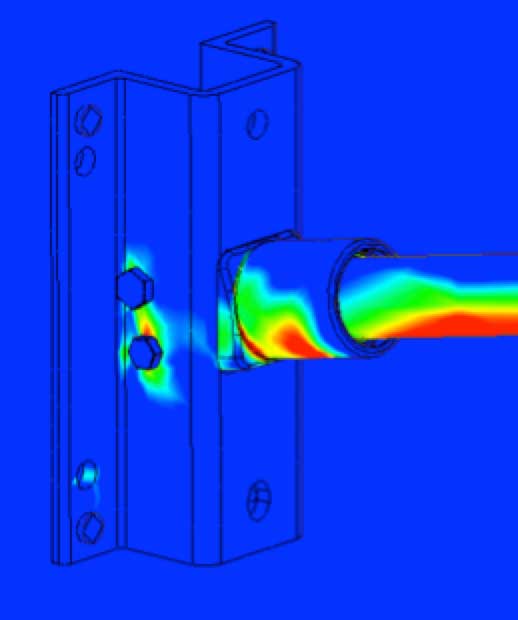
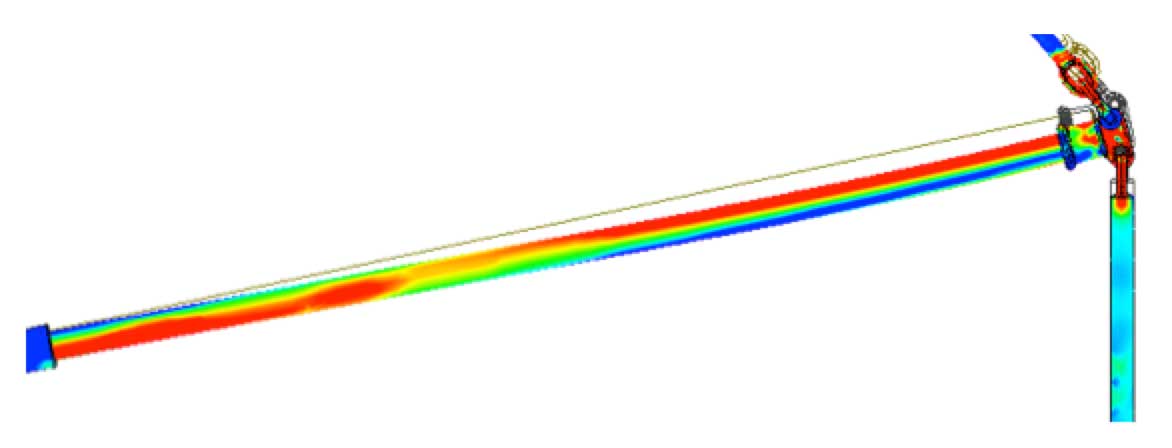
Detailed geometry and supporting hardware was modeled to study stress. This was done for an accurate view of the typical high stress area, as shown in Figs. 6 and 7.
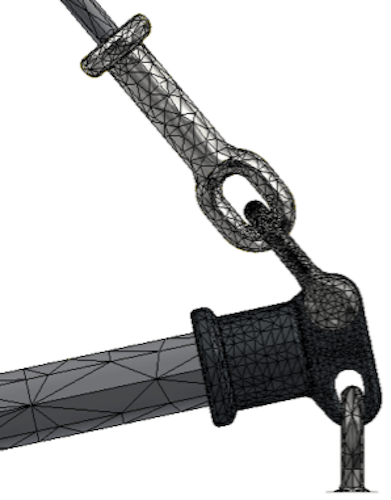
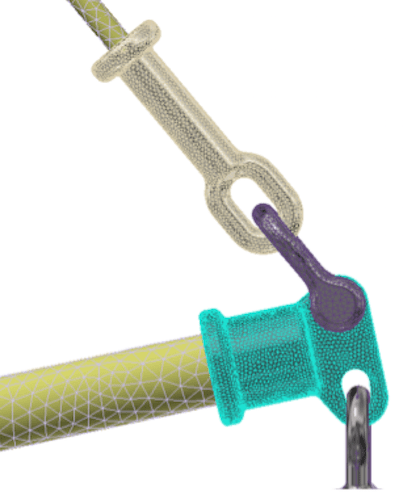
Mesh Information
Mesh sizing and FEA software processing time are highly correlated such that the more defined the mesh, the longer will be processing time. It is typical to start with a coarse mesh to ensure behavior of the model is accurate before implementing a more refined mesh. Moreover, local mesh controls can be added to certain regions to reduce overall processing time while still increasing level of accuracy needed in specific other areas of the system. In the BLP case, size of mesh varied for each study conducted. For example, a finer mesh was used for static analysis of stress levels to obtain more accurate stress values while, for analysis of non-linear buckling, a coarser mesh was deemed sufficient since here the study focused on behavior rather than on specific values. Non-linear analysis takes far longer for software to process versus a standard linear analysis due to the simulation iterations that occur but provides greater resolution and more graphical data. Figs. 8 and 9 illustrate the difference between a coarse and a refined mesh.
Loading & Degrees of Freedom
Multiple load cases were studied both in the static analysis and non-linear buckling analysis with the goal of studying stress and deflection compared to physical test results. The BLP linear static analysis method was utilized first and load cases were studied as follows:
• Vertical loading only;
• Vertical and transverse (post compression) loading;
• Vertical, transverse (post compression), and longitudinal loading;
• 2-degree tower offset, vertical loading only;
• 2-degree tower offset, vertical and transverse (post compression);
• 2-degree tower offset, vertical, transverse (post compression) and longitudinal loading.
In all described cases, the vertical load used was 18,971 lbs., matching the highest load case of non-destructive physical testing. As a note, at the time this was also the limit of the weight that could be applied safely to the test fixture. Based on BLP geometry, the post compression load was a calculated value from this vertical load around 13,800 lbs. Longitudinal loads applied were for reference only to study post deflection and behavior of the contacts and constraints.
Once AutoCAD Nastran In-CAD 2018 FEA software was employed, the ability to truly study buckling was enabled and only the following two non-linear scenarios were created:
• Vertical and transverse (post compression) loading;
• Vertical only loading;
• Vertical only – Fixed plane loading.
Vertical loads applied also matched the highest load case of physical testing. The vertical only loading for the non-linear scenario is described in detail below since it was the best answer to the question how accurately FEA can simulate BLP behavior. Lastly, the fixed plane method was considered to compare how restricting the degrees of freedom of load application would impact FEA results.
Results Compared to Test Data
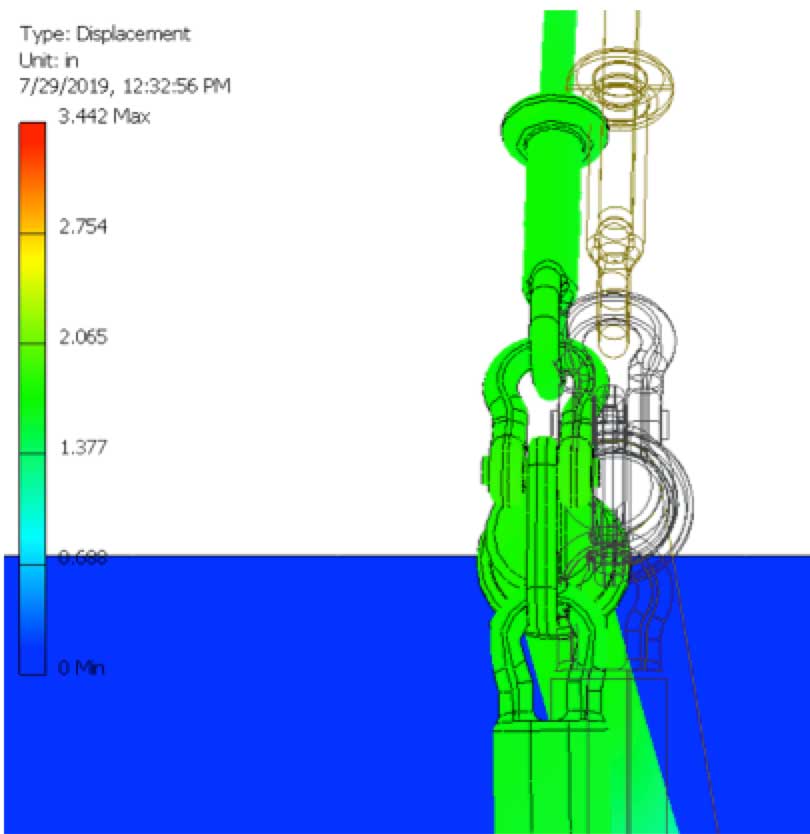
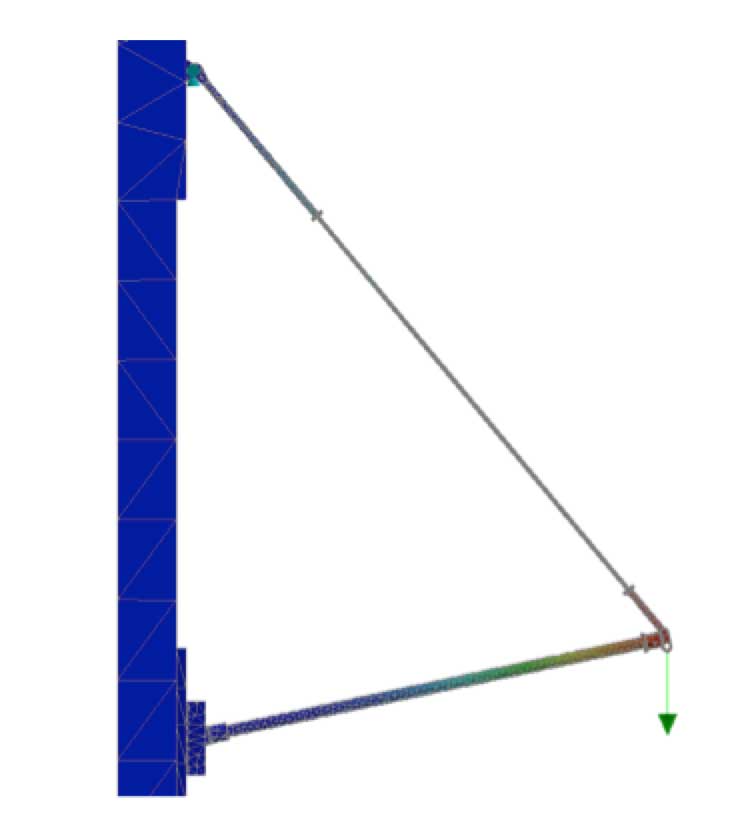
The static analysis and many iterations performed showed that, without artificially inducing longitudinal loads or tilting the assembly, deflection remained in a vertical plane and buckling of the line post insulator was not observed. The demonstrated stress in the system and the deflection behavior, other than buckling, did seem realistic, as shown below (Note: the color bar is set for reference of stressed areas and not necessarily set to material yield strength). The deflection can be observed from the movement relative to wireframe lines.
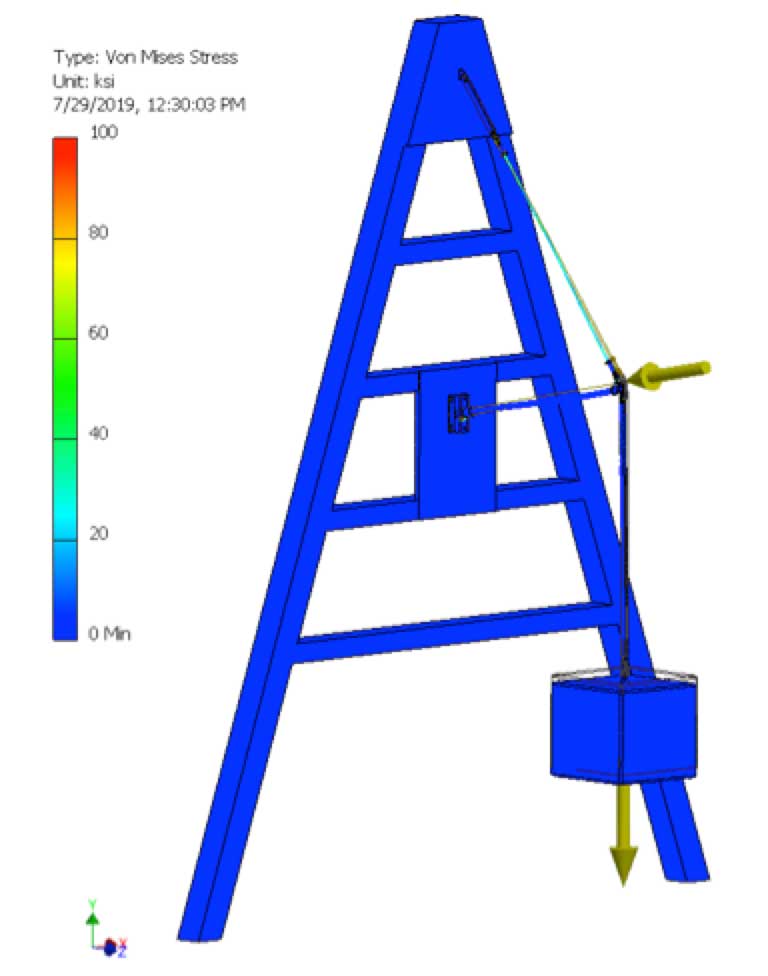
Even in cases where longitudinal loading and tower offsets were put in place to coerce the model into lateral deflection, buckling deflections were still not occurring to the levels of physical testing (see Fig. 13).
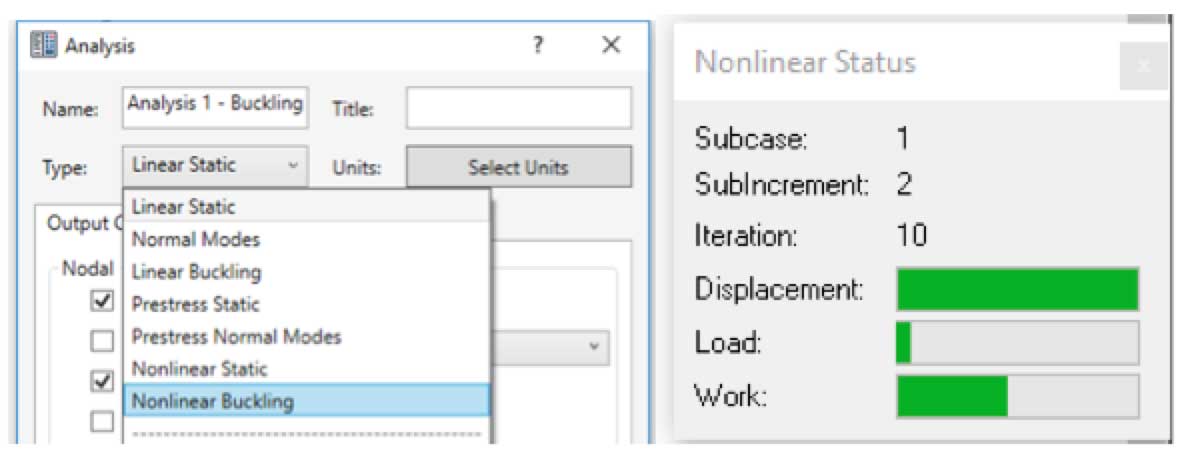
As expected, static analysis alone is insufficient in high load applications to accurately model BLP assembly behavior in FEA. Stress levels in certain areas may have correlation to physical testing but, without buckling capability, it would not be sufficient to fully analyze a BLP design. Therefore, AutoCAD Nastran In-CAD 2018 was utilized to further the investigation with additional capabilities, as shown in Fig. 14. The software enabled two types of buckling specific analysis that were useful for this study.
Linear buckling analysis was utilized first but the focus shifted to non-linear analysis, where more accurate results could be found with an iterative approach to load application. The software uses incremental increases to load application and documents results step-by-step, which enables visibility of behavior otherwise undetectable by other methods. To help offset long software processing times, coarser meshing was utilized along with some small simplifications of model geometry. The first study conducted was with vertical loading (18,971 lbs.) and a manually applied post compression transverse load. This was done to ensure the post would see load high enough to induce buckling. Results confirmed buckling had occurred and therefore the next analysis conducted was vertical loading only, which accurately represents physical testing. Fig. 15 shows the set-up.
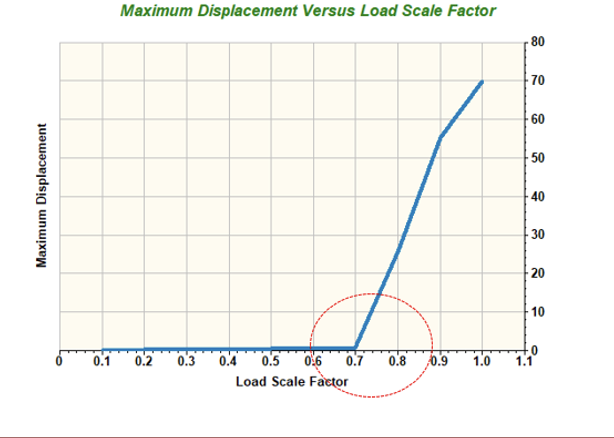
With a perfectly symmetrical 3D model and vertical only loading, one question was if this non-linear analysis could show where buckling would occur and, like physical testing, show deflection of the system in a lateral direction. With the long software processing time complete, the answer proved to be ‘Yes’. Reviewing each non-linear incremental load iteration, when loading reached 70 to 80% of the 18,971 lbs. applied value (0.7-0.8 scale factor) a rapid increase in deflection was observed, representing post insulator buckling. At 70 to 80%, this would equal vertical loading of 13,300-15,200 lbs., which was the same region of the physical testing graph where the slope began to change. Also, correlating this 70 to 80% vertical load value to post compression loading would equal 9,700 to 11,100 lbs., which corresponds well to the original prediction of 10,080 lbs. buckling value. The best representation of this correlation would be to compare graphs, as shown in Figs. 16 and 17. The non-linear buckling FEA result is also shown with an observed condition of buckling deflection. This was at 0.8 load factor and is shown as Fig. 18.
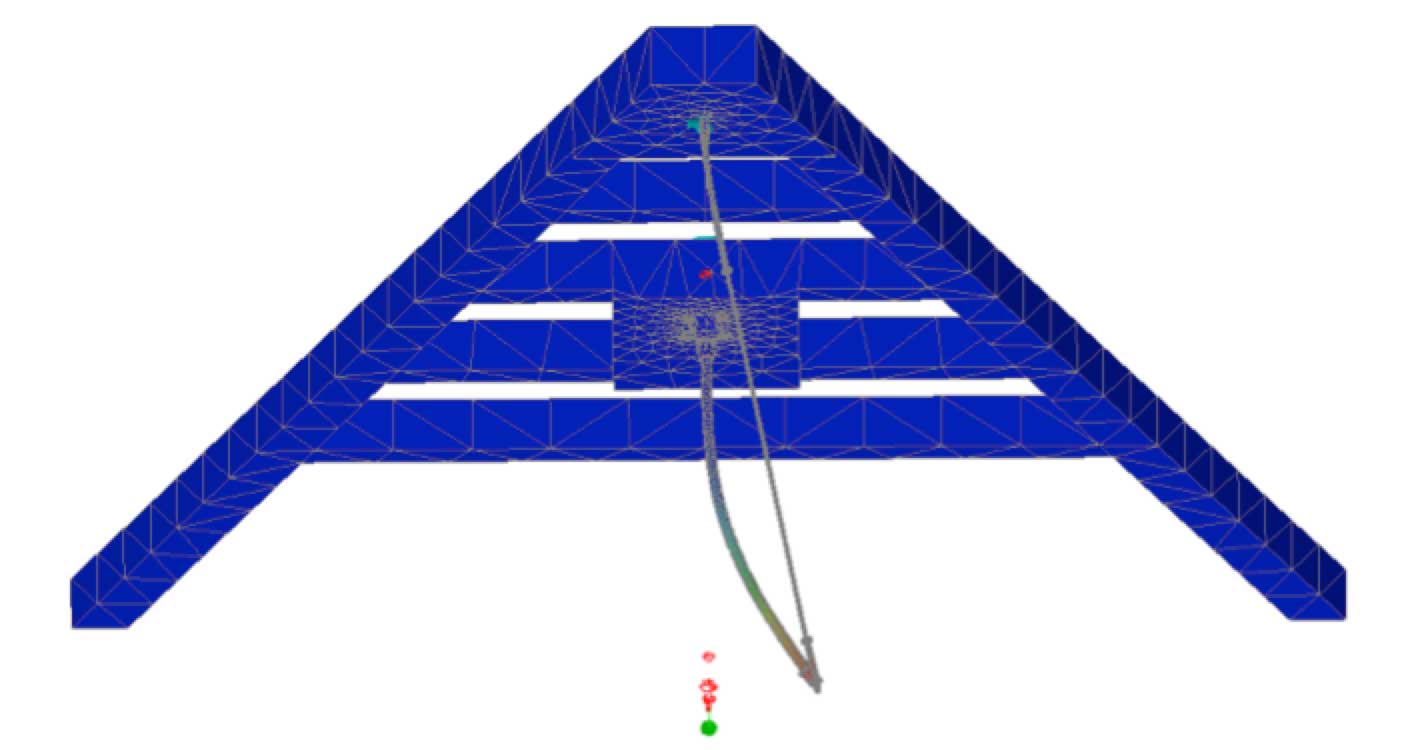
It was interesting to note that the original linear buckling model showed a buckling deflection to the left (viewed looking at the tower), whereas the last non-linear model showed a deflection to the right.
The last study was conducted on a restricted or fixed plane of load application to simulate an alternative method of load application that is not free to float. In the non-linear buckling analysis set-up, an additional member was added to the line end of the post insulator and given a constraint for vertical deflection only. This would represent loading generated from a fixed point. As expected, buckling of the post and any lateral deflection was restricted. The non-linear processing was interrupted with error messages at 50% of full load, likely due to inability to process the buckling that would have occurred. Fig. 19 shows the set-up. This method of load application will no longer be used since free weight load application is a more accurate representation of field installation and enables buckling to take place naturally as a potential limiting factor in rating the system.
Variances
Magnitude of deflection upon onset of buckling did show some variance to actual physical testing. This would be explained by several factors, including complexity of orthotropic material properties of the fiberglass rod. Other factors are mesh size and geometry simplifications made to the model for non-linear analysis run time. Since the intent in BLP design is to understand and avoid onset of buckling and not necessarily design for the magnitude of its occurrence, no additional FEA refinement was conducted to explore further.

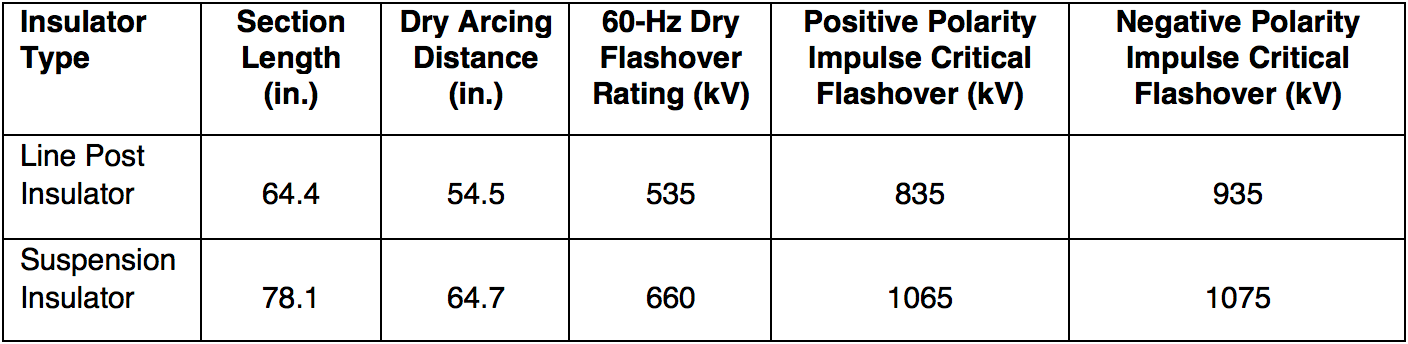
Electrical Testing
A low-frequency voltage dry flashover test and a critical impulse flashover test (positive and negative polarity) were also performed for the purposes of this research. Control tests were conducted on individual units followed by the braced line post assembly using equivalent test procedures. The individual units employed in the braced line post included a nominal 3 in. diameter core rod line post and a 25,000 lb. SML suspension insulator, whose respective ratings are listed in Table 1. Insulators were selected based upon relative difference in dry arcing distance. It was anticipated that the suspension insulator’s greater dry arcing distance would bias electrical discharges to occur over the shorter dry arcing distance of the line post insulator. Subsequent testing was performed with increments of the suspension insulator shunted with a wire from the ground end fitting. Low-frequency voltage dry flashover testing and critical impulse flashover testing were performed at each incremental change in dry arcing distance. Visual observations correlated the discharges over each insulator within each test series. For the purposes of this test, corrections to standard conditions of the flashover values were calculated based on the assembly being a line insulator.
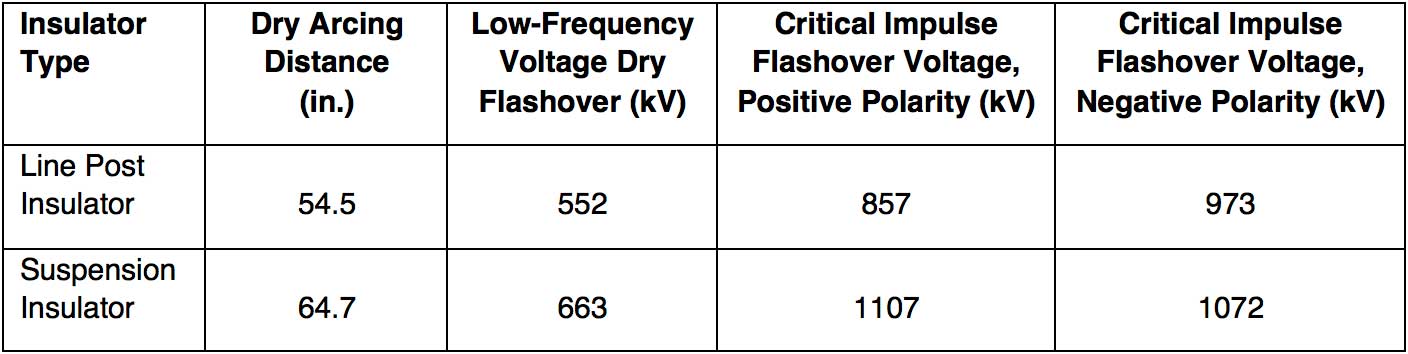
By successively reducing dry arcing distance of the suspension insulator and documenting over which insulator discharge occurred, flashover values should reflect all statistical effects. In other words, when the statistical probability of flashover is equal for either insulator, would there be an approximately equal distribution of discharges across individual insulators? Also, would there be a reduction in flashover values and, if so, by how much? The low-frequency voltage dry flashover test and the impulse flashover voltage test were performed according to ANSI C29.11-2012 (American National Standard Composite Insulators – Test Methods). Table 2 presents the results.
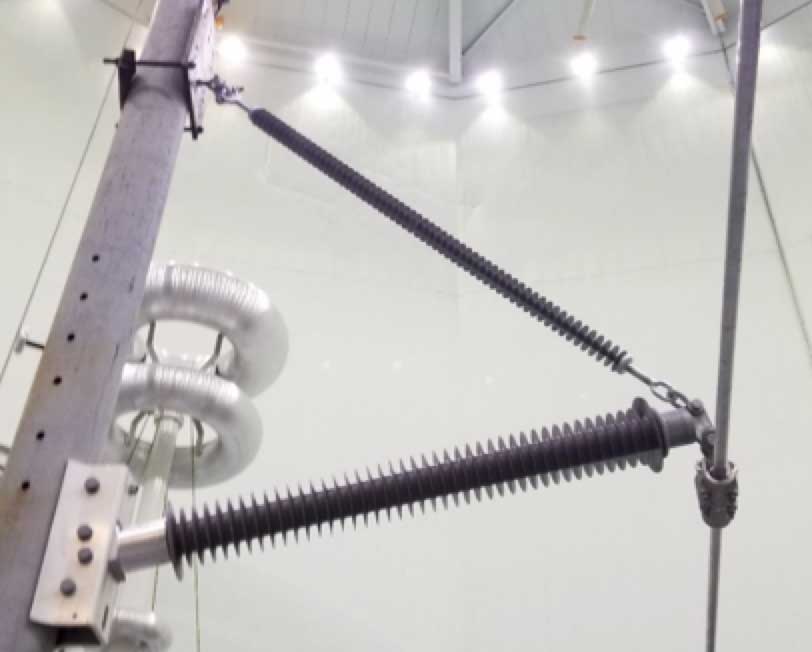
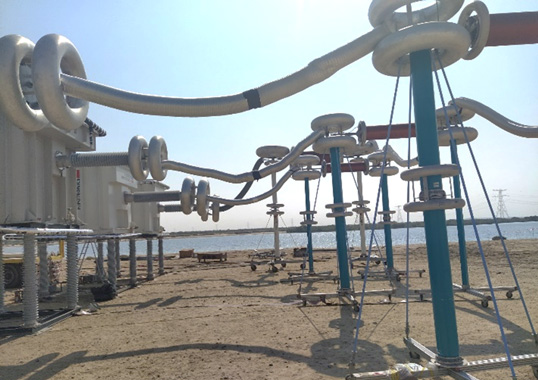
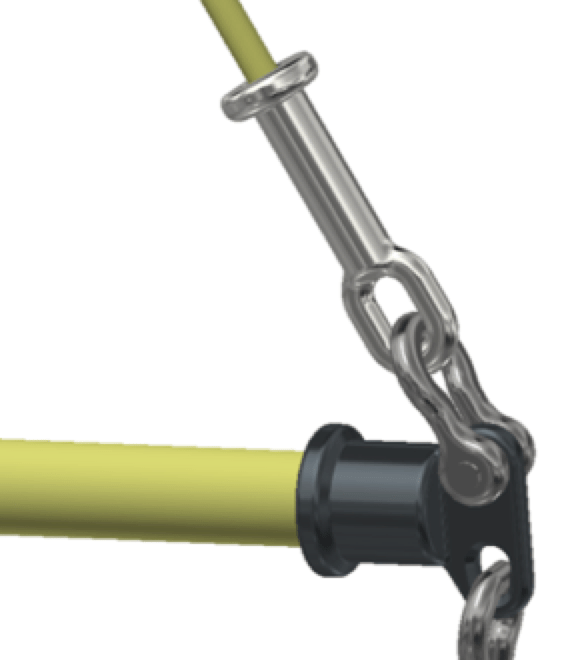
The braced line post assembly was set-up on a vertical steel pole. The suspension was installed via two 3.5 in. long shackles directly to the face of the steel pole (see Fig. 20). The angle between the suspension insulator and the line post created a dry arcing distance of 53.0 in. from the line end fitting of the suspension insulator to the base of the post. The path from the upper edge of the line end fitting of the suspension insulator to the ground end of the line post became the preferred path of discharge as long as the suspension insulator’s dry arcing distance exceeded that value. During the low-frequency voltage dry flashover test, discharges were primarily across the line post insulator and at values consistent with but higher than those of the line post alone – until the suspension insulator’s dry arcing distance was less than 52.7 in. Below that, measured flashovers began to drop in value and discharges began to transition from the line post insulator to the suspension insulator. Fig. 21 shows a representation of this data.
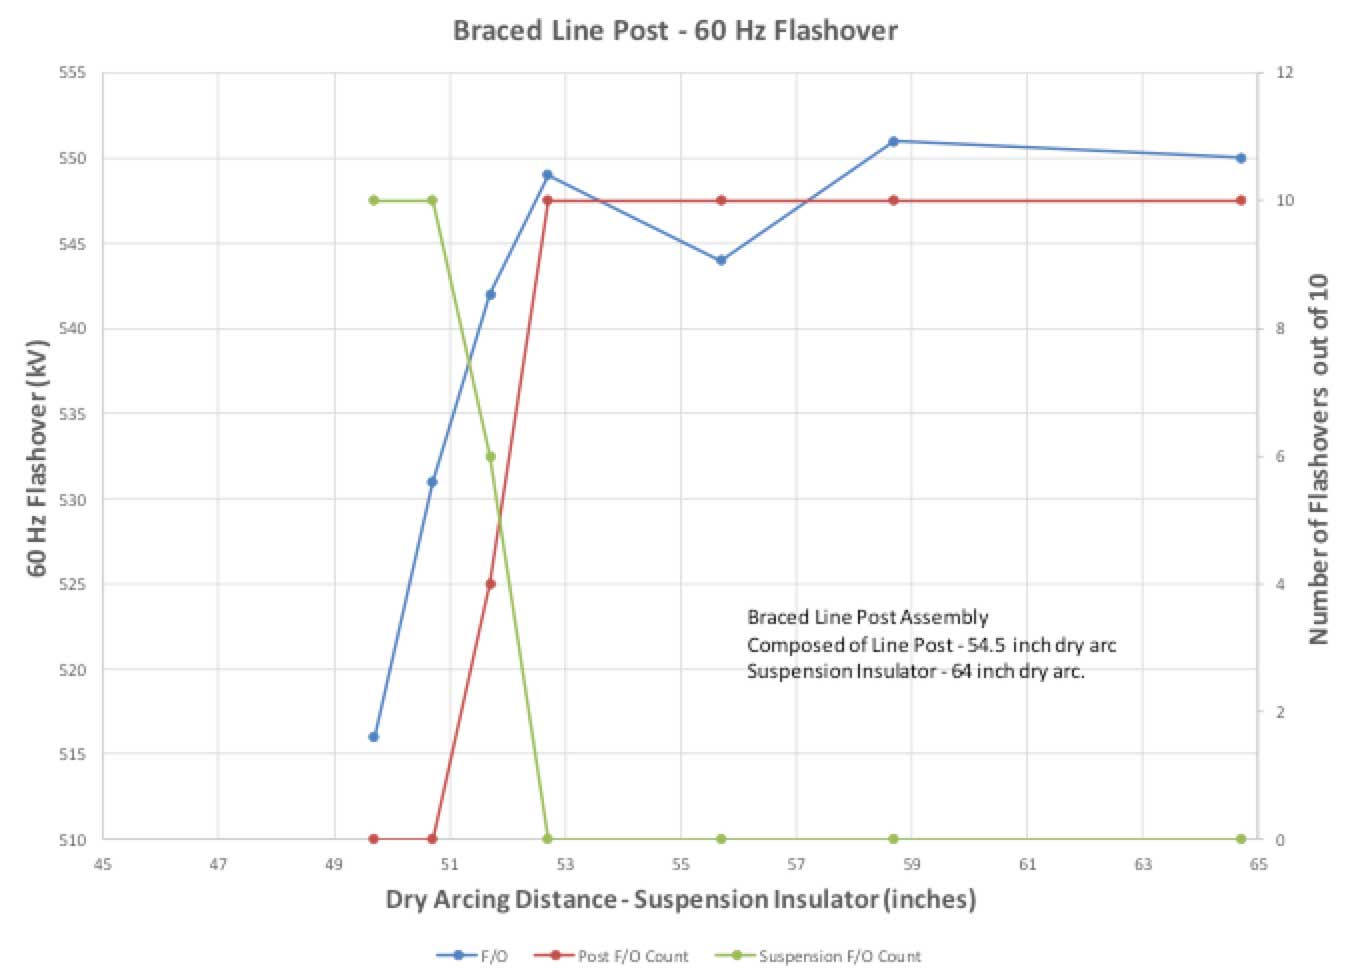
The crossover point of discharges from the post to the suspension insulator occurred at approximately 52 in. Low-frequency voltage flashover value was about 543 kV, representing a circa 1.6% reduction in performance over the line post insulator’s low-frequency voltage dry flashover (well within the precision of the measuring equipment).
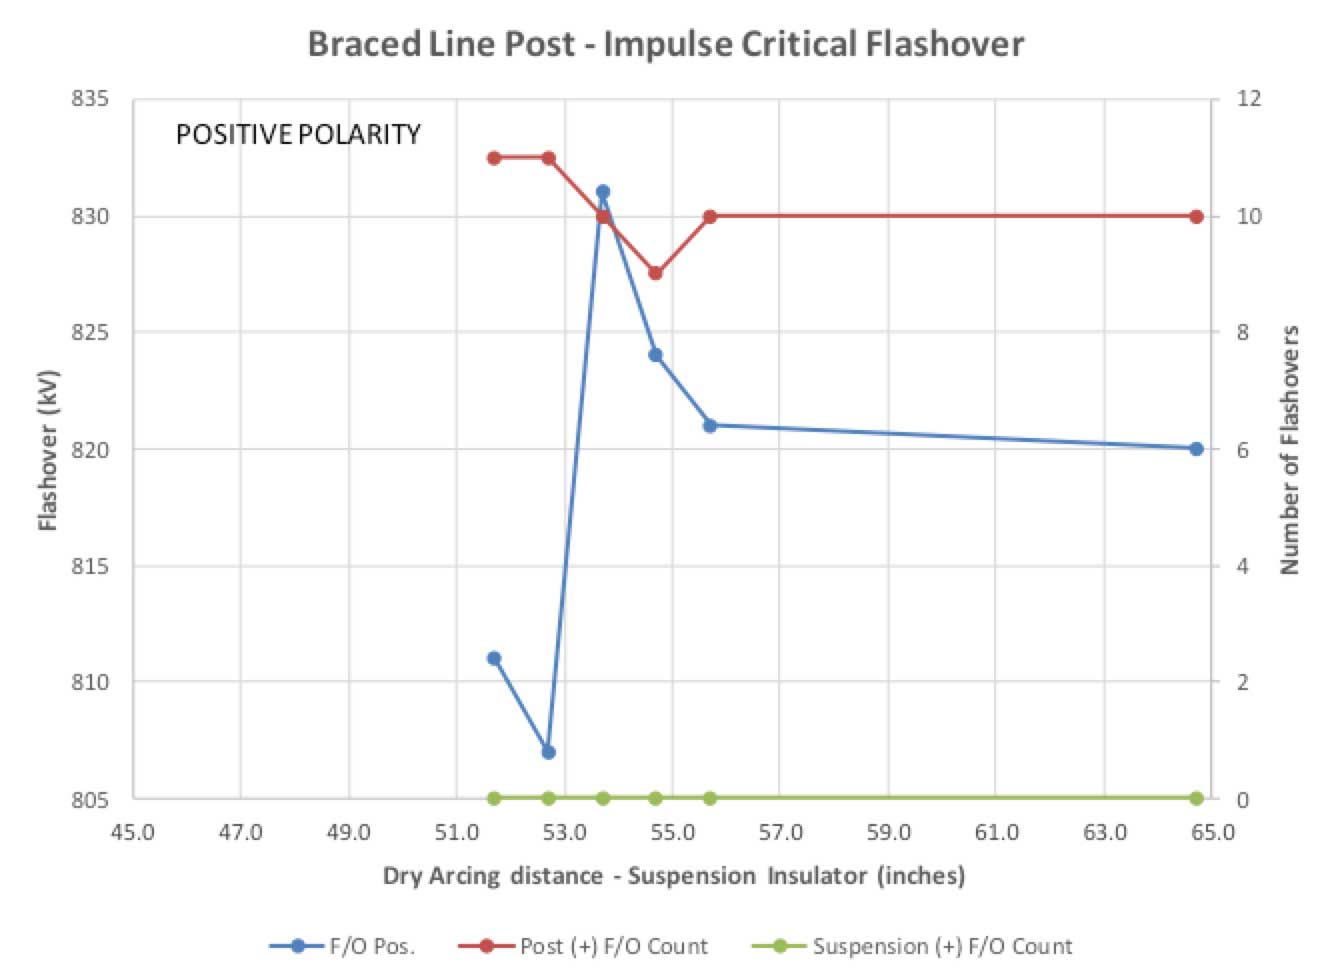
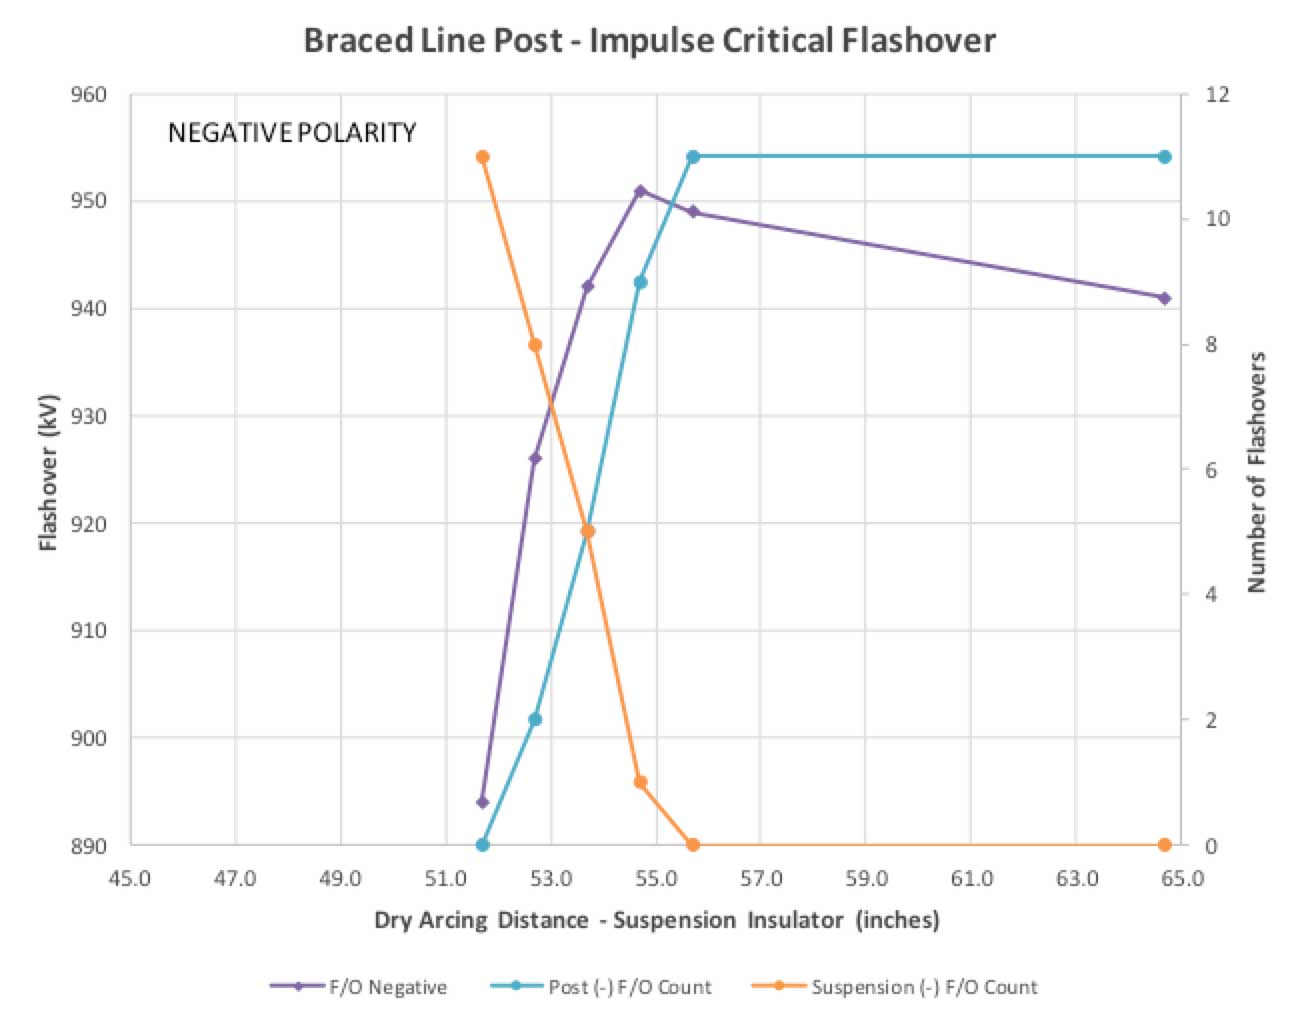
The impulse flashover testing yielded different results. Under positive polarity and within the range of reduction in dry arcing distance, no discharges could be induced across the suspension insulator (see Fig. 22). Critical flashover values exhibited a decrease when the dry arcing distance of the suspension insulator was less than 53.7 in. Negative polarity impulse flashover testing followed more predictable lines. Discharges over the suspension insulator and the line post insulator occurred at 53.7 in. dry arcing distance for the suspension insulator or the approximate equivalence point for dry arcing distance on the two insulators (see Fig. 23). When the dry arcing distance of the suspension insulator became less than 53.7 in., measured critical flashover values were reduced.
Discussion
Mechanical Testing
Utilizing software and simulation in design engineering will continue to expand since it can be used to develop optimized solutions without need for iterative physical testing. Remaining studies could be conducted to introduce more complex load scenarios, such as additional longitudinal or transverse loads. Some of these scenarios might include load cases that are too difficult to test physically but that become possible with a calibrated FEA model. For example: how would a system with multiple post insulators behave?; what if these are designed in parallel versus 45°? More complex brace line post assemblies could be 3D modeled and studied using these methods.

Electrical Testing
In regard to electrical testing of a BLP assembly, the discharge path from the line end suspension insulator end fitting to the ground fitting of the line post insulator was 1.5 in. shorter than for the post alone. With that reduction in dry arcing distance, the low-frequency voltage dry flashover should have been lower than for the line post insulator alone. Yet the low-frequency dry flashover values for the BLP assembly were equivalent to those of the line post insulator alone. While there appeared to be a reduction in low-frequency dry flashover voltage at about equal dry arcing distance for the suspension and line post insulators, this was within the precision of measurement.
The impulse critical flashover values (both positive and negative polarity) were less than those of the line post by a value commensurate with reduction in dry arcing distance of the braced line post assembly versus that of the line post. Negative polarity impulse critical flashovers exhibited a discharge distribution that confirmed with expectations of the test protocol. The positive polarity impulse critical flashovers, however, did not perform as expected. Based upon the values obtained, it appeared prudent to employ insulators with different dry arcing distances.
Conclusions
Mechanical FEA Simulation
After utilizing multiple finite element methods to attempt to replicate post insulator buckling in a BLP assembly, it was determined that static analysis is not adequate. While the linear buckling analysis method gave improved results, best results were found utilizing a non-linear buckling analysis method. Nastran In-CAD software was successful in demonstrating onset of buckling due to vertical loading in a braced line post assembly and that correlated with physical test results. For field applications and safety factors, no load scenarios should be designed to approach buckling limits. Typically, both suppliers and users keep safety factors in place to prevent this. However, this information is still valuable when designing systems and establishing accurate maximum ratings.

Electrical Testing
Based on the data compiled from electrical tests, reduction in flashover values within the realm of equal dry arcing distance for the suspension insulator and the line post insulator could not be documented. While some variations were observed, these were all within the realm of experimental error. With that understanding, electrical ratings for braced line post assemblies should be based solely on the shortest dry arcing distance available for the assembly.
Bibliography
[1] R.A. Bernstorf. Composite BLP – Mechanical Considerations- INMR 2011, Hubbell Power Systems
[2] R. A. Bernstorf. “Braced Line Post Ratings”. Presented at the 2008 IEEE-PES Transmission and Distribution Conference and Exposition, Chicago, IL, April 21-24, IEEE Paper Number PESGM2006-000680.
[3] Software referenced: Autodesk Inventor Professional 2018 – English, Autodesk, Inc., Autodesk Nastran In-CAD 2018, Autodesk, Inc.