The 70 kV Parakan-Kadipaten OHL in Indonesia experiences a high frequency of disturbances. Although programs have been instituted to enhance its protection system, they have not been adequate in mitigating the severity of lightning disruptions. A Proof of Concept (POC) was therefore conducted in 2022 to evaluate the effectiveness of applying Externally Gapped Lightning Arresters (EGLAs), which are acknowledged in CIGRE TB 855 as a reliable solution in such cases.
This edited contribution to INMR by Rizally Priatmadja and other engineers at PT PLN (Persero) discusses the preparatory and design phases of this project and reviews the installation process. There is also an evaluation of performance spanning 5 months post-operation.
Background
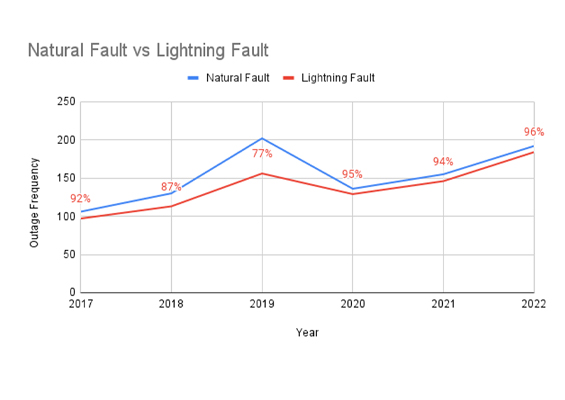
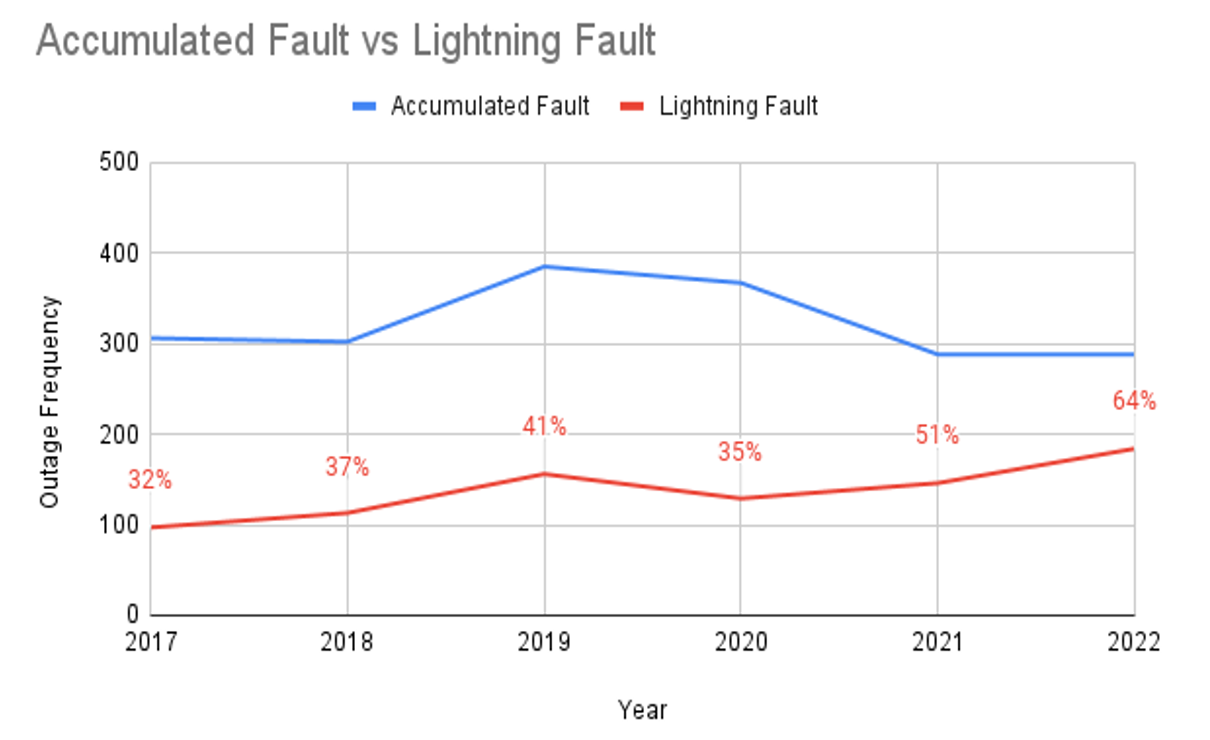
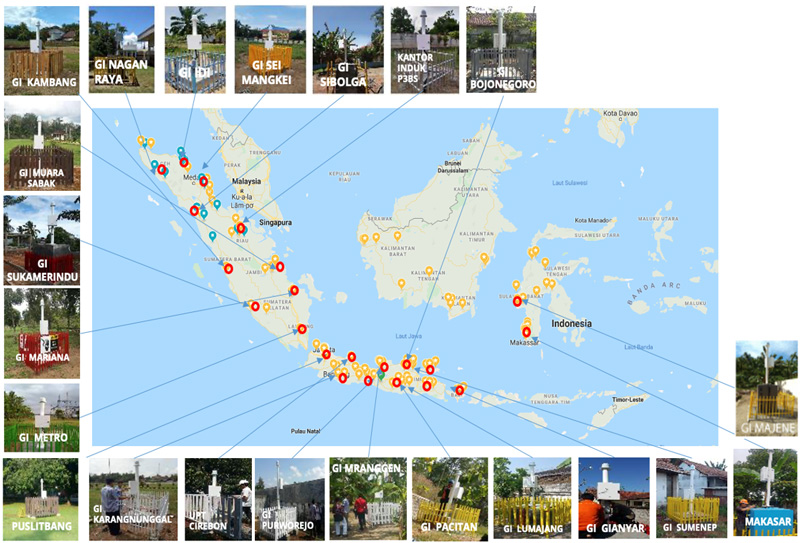
PLN UIT JBT manages a transmission network of nearly 13,000 kmc and 19,035 towers divided into 619 circuits covering Central and West Java. Most disturbances are dominated by lightning. Figs. 1 and 2, for example, show transmission line outage records between 2017 and 2022, accounting for an average of 43% of total cumulative disturbances and an average of 90% of total natural disturbances. Based on PLN’s Forced Outage Information System (FOIS) application record, 90% of lightning disturbances occur on 70 kV transmission lines and among those with the highest total cumulative outages is the Parakan-Kadipaten OHL.
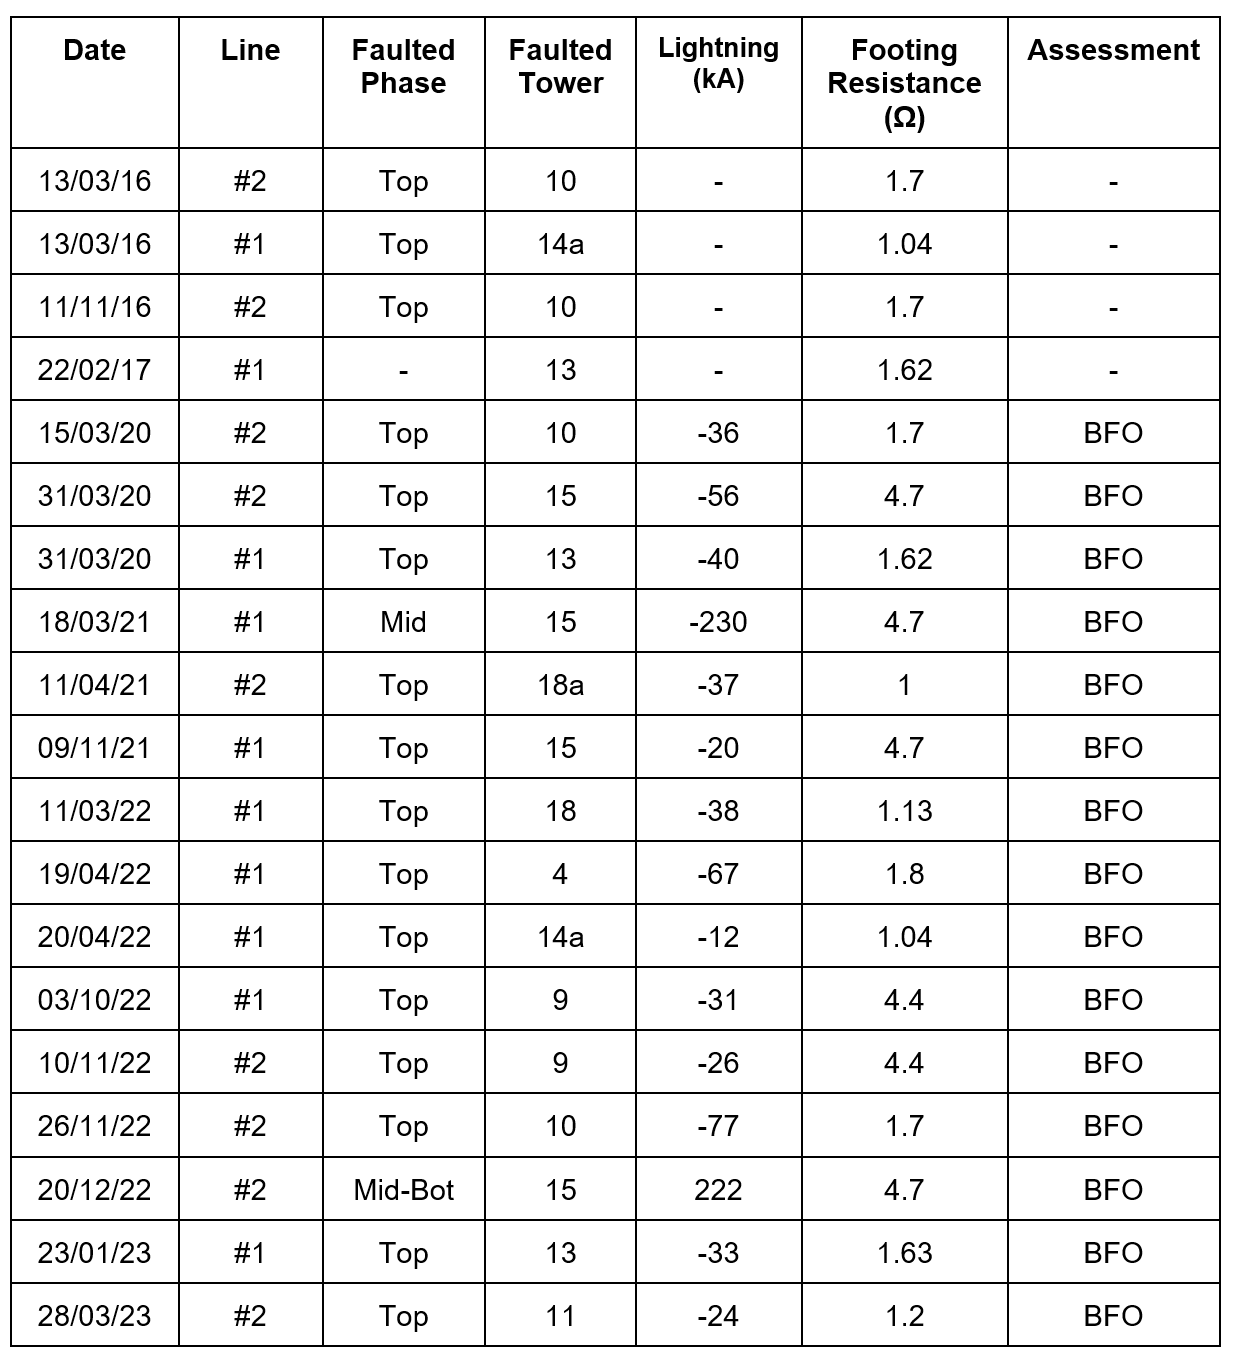
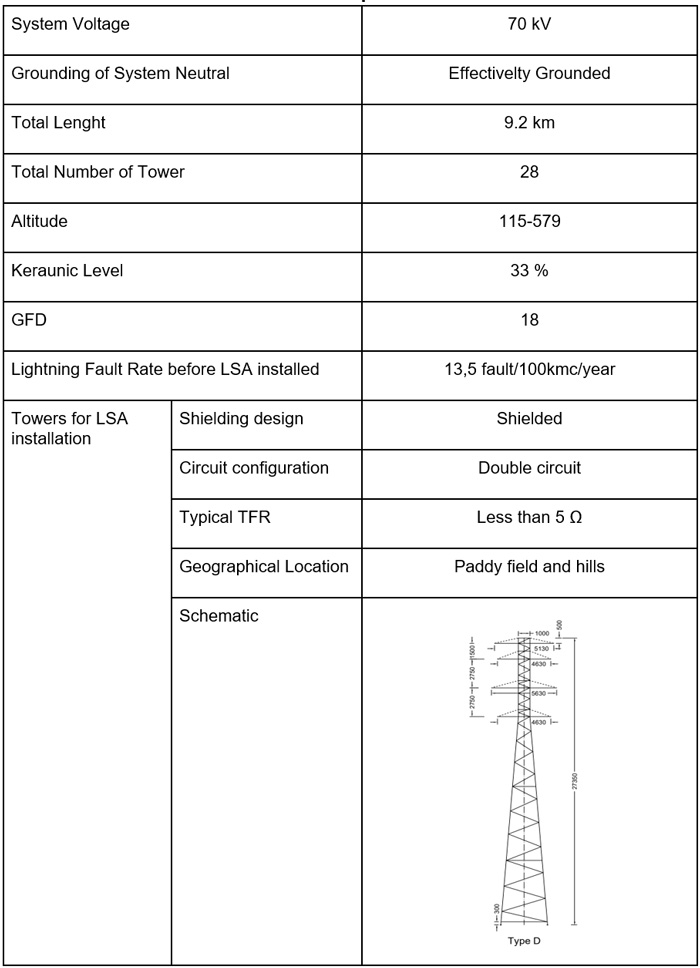
The 70 kV Parakan-Kadipaten OHL is in a region with isokeraunic levels ranging from 25 to 50 thunderstorm days per year. Table 1 provides FOIS fault records and for the 70 kV Parakan-Kadipaten line, which between 2016 and June 2023 recorded 20 fault occurrences due to lightning. During the 7.5 year period, 7 towers were impacted by lightning strikes, making this the most prevalent incident. Various measures were undertaken to decrease frequency of outages, including implementing a multi-rod grounding (MRG) system and reducing tower inductance. Nevertheless, there was a notable rise in fault incidents during the following several years.

In response to these issues, at the end of 2022, PT PLN (Persero) started co-operation with an EGLA supplier to evaluate and improve the lightning performance of transmission lines. Starting Dec. 9, 2022, approximately 79 EGLAs were installed in specific configrations along the transmission line with poor lightning performance. Subsequently, from Dec. 9, 2022 on, only 3 outages due to lightning were recorded on this line, confirming the effectiveness of this protection system.
Below are details the transmission line lightning performance studies and evaluation carried out in this partnership project. Methods are presented to select arrester characteristics and define the quantity and the optimized arrester locations along the line. Field experience obtained during the first 6 months and line performance/reliability of the system after EGLA application are compared with performance before arrester installation.

Literature Review
1. Shielding Failure Analysis
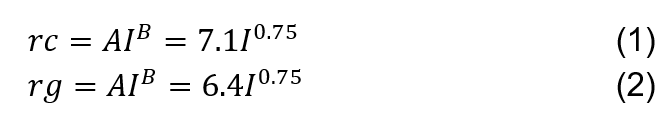
In order to investigate preventive measures such as shield wires, it is important to analyze the parameters of striking distance and exposure radius. To ensure protection of the OHL, it is imperative that exposure radius does not surpass the striking distance. Fig. 1 depicts the conventional electromagnetic model (EGM) of conductors and shield wires. The variable rg, denotes radius of the lightning strike from the point of contact with the Earth, while Dc represents the distance at which shielding failure occurs. In addition, rc represents the radius of a lightning strike of a specific magnitude on the phase conductor and shield wire. A number of striking distance equations were identified and present study utilizes Brown-Whitehead constants, outlined below.
Ng is ground flash density whereas yearly flash incidence, NL, is a measure of flash occurrences on shield wires per 100 km.
![]()
The variable, b, represents distance between shield wires and outermost phase conductors whereas the variable, h, represents height of the tower. In order to approximate annual occurrence of flash incidents on each phase conductor, the shielding failure rate (SFR) is utilized..
![]()
In this context, the variable “l” represents the length of the line, “IMSF” is maximum lightning current that can occur before shielding failure and “f(I)” represents probability of corrence of peak lightning current. Moreover, considering that Ic represents crucial stroke current in kiloamperes (kA), total rate of shielding failure flashover (SFFOR) to the phase conductor can be determined as follows.

When a flashover is triggered by a lightning strike, the voltage at the highest point of the transmission tower will reach its maximum value at the peak of the lightning current. Therefore, the voltage at the top of the tower (VTT) can be expressed in terms of the lightning current, I(t).
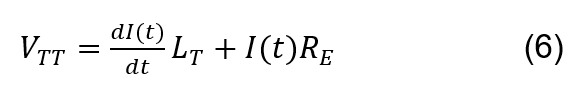
(dI(t))/dt is a measure of lightning steepness, LT represents inductance of the tower and RE signifies tower footing resistance. To compute LT, it is necessary to obtain the values of the tower surge impedance, ZT, tower height, HT, and the speed of light, c.
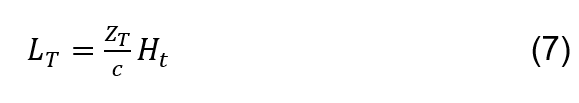
Moreover, the tower, functioning as a variable-impedance transmission line, partitions the tower section into a series of parts with distinct surge impedance values that correspond to the height and average radius. Hence, overall surge impedance, ZT, of the tower can be determined by summing the surge impedance ZT of each individual part of the tower.
2. Back-Flashover Analysis
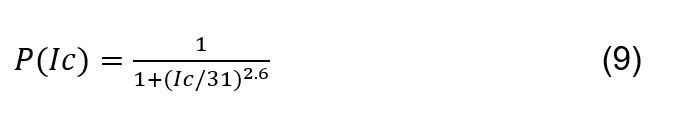
Implementation of effective shield wire protection measures has the potential to result in an inadvertent discharge towards the phase conductor. Occurrence of a lightning strike on the shield wire or tower structure results in substantial potential differences across the line insulator. Consequently, when this potential surpasses insulation strength, backflashover occurs. Anticipated annual backflashover rate (BFOR) per 100 kilometres is calculated as follows:
![]()
Probability, denoted as Ic, of the initial stroke current surpassing the critical current, Ic, can be approximated as:

SUTT 70 kV Parakan-Kadipaten Profile
The 70 kV Parakan-Kadipaten OHL line has operated for 50 years, delivering energy from the Parakan Hydropower Plant with a total capacity of 10 MW. Initially, the conductor was operated with a voltage level of 30 kV but in 1973, the line’s voltage level increased to 70 kV. Average distributed load is 113.25 Amperes, with a maximum capacity of 380 amperes. To monitor the line’s performance against potential lightning disturbances, PLN has four LDS sensors installed at several locations on the island of Java.
One of the reasons for choosing this transmission line in this proof of concept project was ease and flexibility of line shutdown during the installation process. Since a special placement study process did not accompany initial installation, possible future placement optimization could be carried out flexibly.
Lightning Characteristics & Statistics
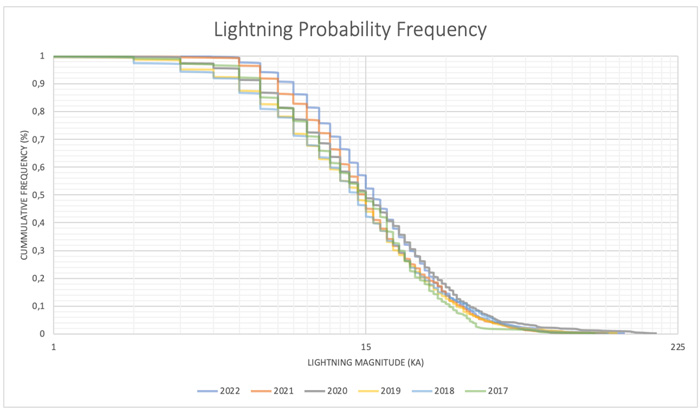
Lightning characteristics were studied across the sub-transmission line for the period from 2017 to 2022, including peak current data, flash density and periodic flash distribution. Over the past 6 years, there were a total of 2691 lightning occurrences along the 70 kV Parakan-Kadipaten OHL, with 92.87% being negative in polarity. Fig. 5 depicts the distribution of peak current frequency for both negative and positive polarities of lightning flashes along the line from 2017 to 2022. As can be seen, most currents fell between 10 and 22 kA.
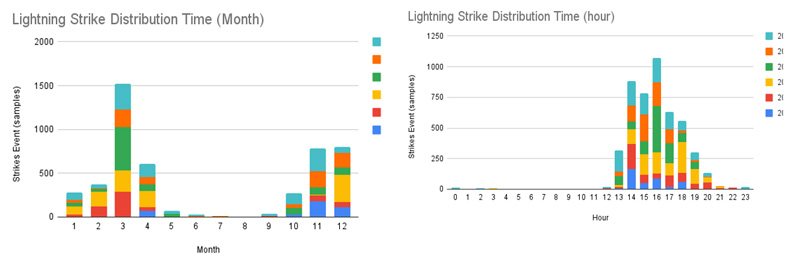
(a) monthly distribution (b) hourly distribution.
In general, cumulative data over the years 2017 to 2022 showed that lightning strikes to the Parakan-Kadipaten line peaked in March. The time these strikes occurred between 1 pm and 12 pm with the highest number of strikes falling from 2 pm to 4 pm.

Lightning Performance Review
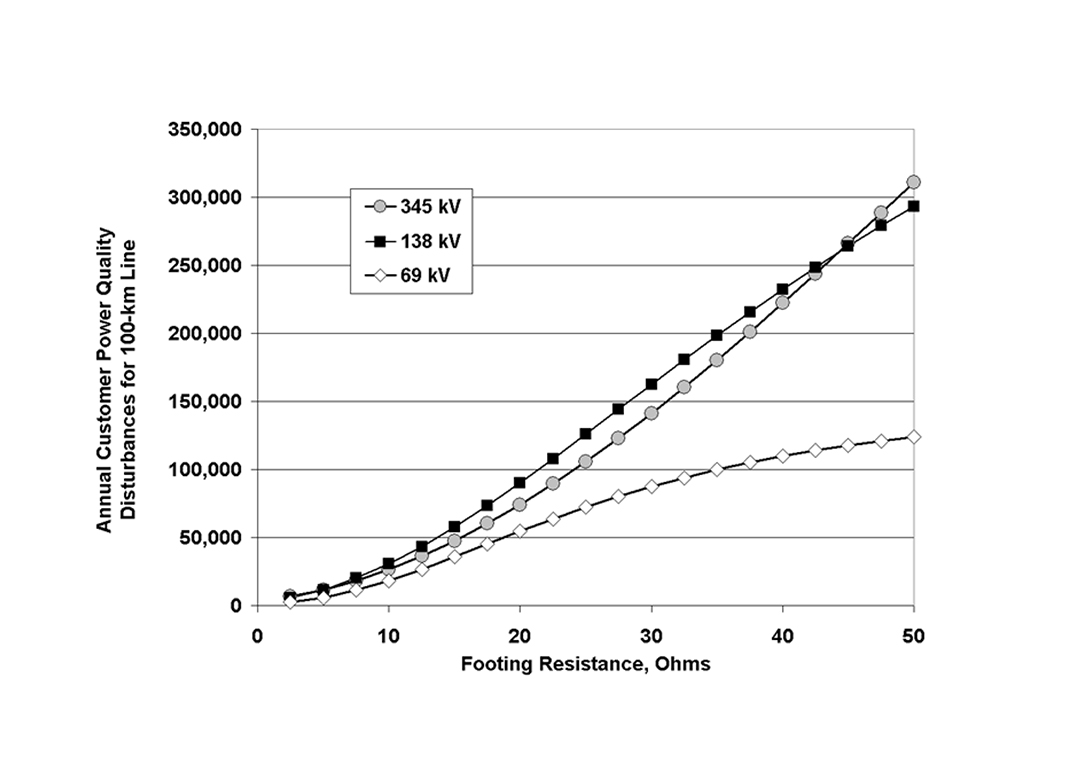
Two approaches were used to assess the impact of frequent disturbances in the Parakan-Kadipaten 70 kV SUTT area. The first was the value of tower leg grounding in that section. Grounding resistance of tower legs plays a significant role in providing lightning protection when a backflashover occurs.
Results of tower foot grounding measurements in this area are shown below:
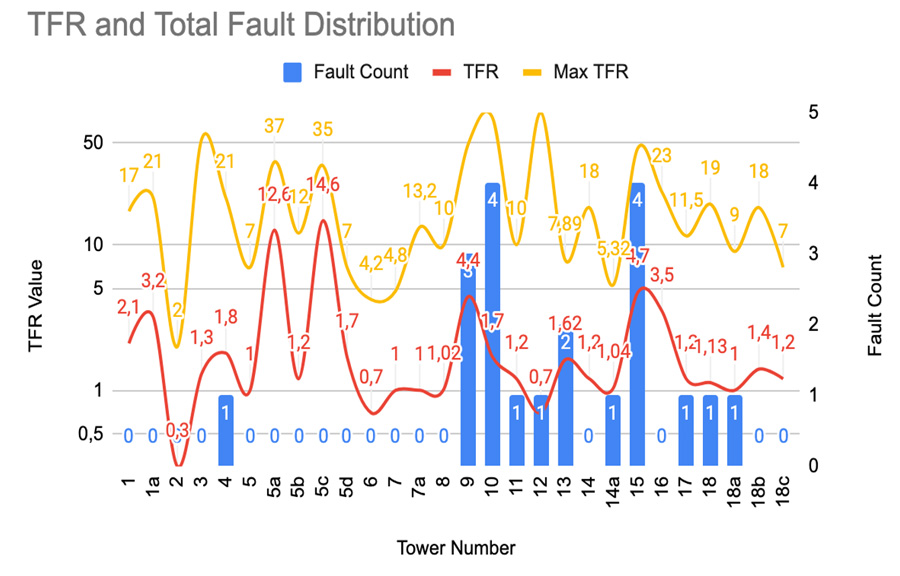
Additionally, the current methodology relies on historical strike data from PLN’s Lightning Detection System (LDS) program. Lightning strike data utilized in this study covered the period from 2017 to 2022. The next step involved acquiring disturbance history data and disseminating post-disturbance inquiry findings to illustrate the areas impacted. Utilizing the data provided, it became possible to analyze features of lightning disturbances, specifically on the 70 kV OHL of Parakan-Kadipaten segment.
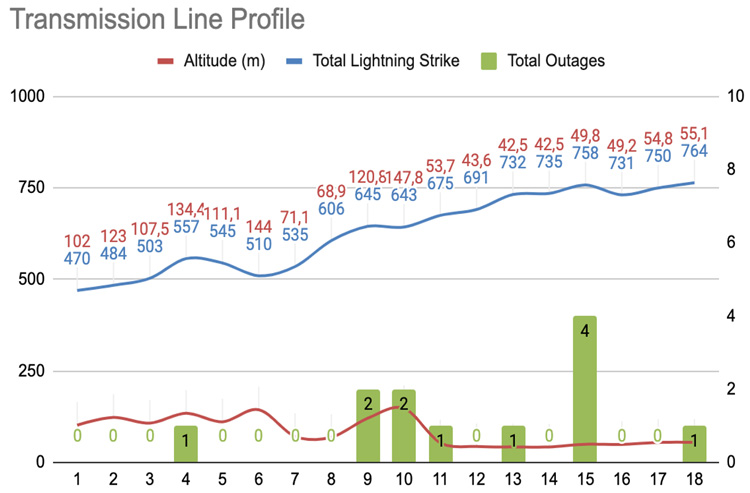
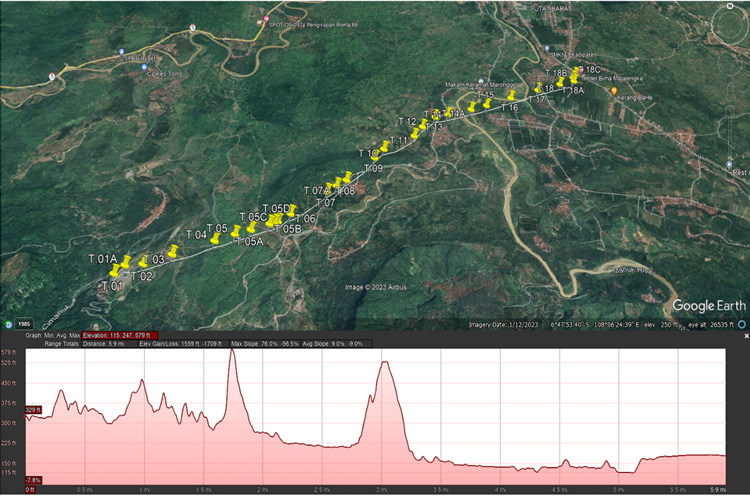
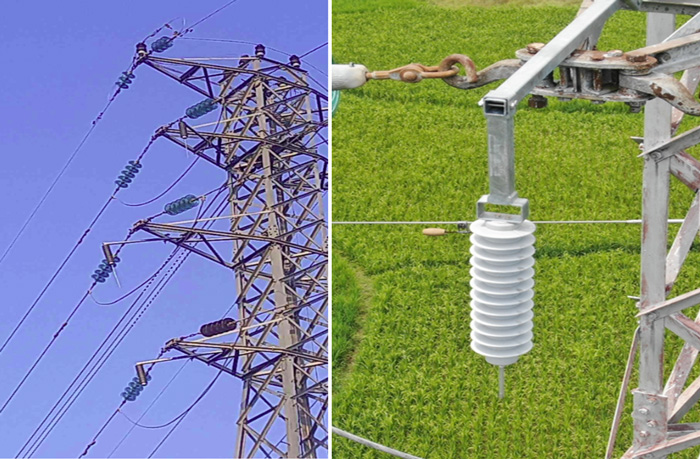
The relationship between altitude of transmission towers and occurrence of disturbances was found not to be directly influenced by geographic conditions nor by the intensity of lightning strikes in a line section. Disruptions experienced from 2018 to 2023 had direct correlation with elevated frequency of lightning strikes observed on each individual tower, i.e. the higher the frequency of lightning strikes, the greater the likelihood of disturbances. Rice fields, for example, are typically characterized by a greater incidence of lightning strikes and a higher prevalence of lightning disturbances in terms of geographic distribution.

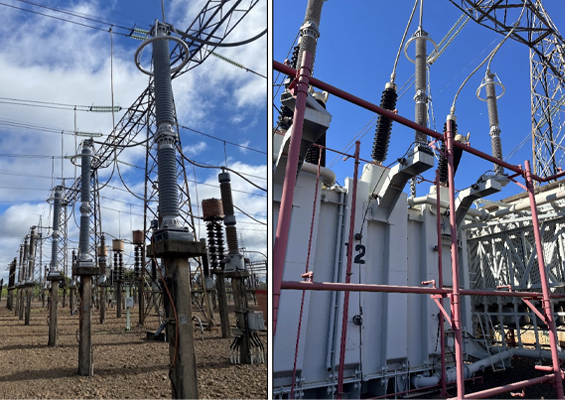
Pilot Project of EGLA Application on 70 kV Parakan-Kadipaten OHL
a. Transmission Line Lightning Arresters
One of the reasons for choosing EGLAs in this project was cost savings. In addition, EGLAs have a longer lifetime than NGLAs because there is no ageing from exposure to continuous leakage currents. The spark gap is designed to function below the insulator basic insulation level.
Installation on the line is carried out by removing the arcing horn to ensure the EGLA performs properly and fulfil the requirement, EGLAfo < LIWLinsul. The gap on the EGLA must be appropriately designed only to work against lightning overvoltage. When the gap discharge requirements are met at switching overvoltage, should there be damage to the SVU, the line will potentially trip during the energizing process. As such, EGLAs are not recommended to be installed stand-alone on EHV systems because there is the need to prevent overvoltage switching. Thus, EGLAs are most suitable and most effectively installed in systems up to 150 kV. Table 3 provides the specifications of the EGLAs installed on the 70 kV Parakan-Kadipaten OHL.
[caption id="attachment_59151" align="aligncenter" width="560"]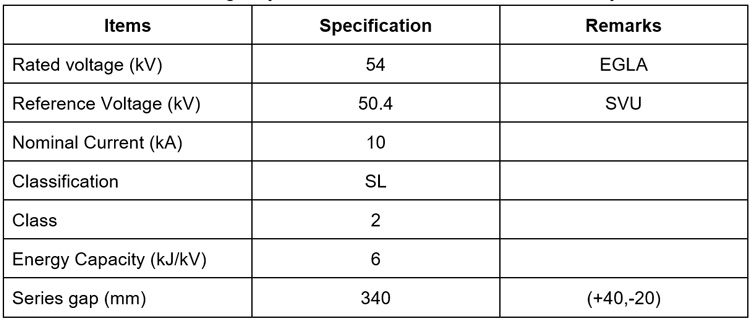 Table 3: EGLA Design Specification[/caption]
A total of 80 EGLA sets were planned to be installed alternately on 28 towers of the Parakan-Kadipaten line with the configuration shown in Table 4. Installation considerations were based on past experience by the supplier on 20 kV systems and also on tower construction in the field.
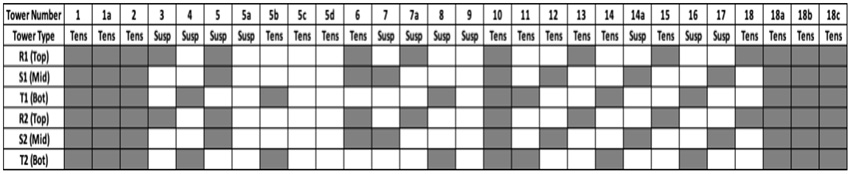
Lightning surge arresters (LSAs) were prioritized for installation in locations with the following criteria:
• high value of footing resistance;
• shielding angle of earth wire;
• towers often struck by lightning.
In cases where there is no budget constraint and in order to realize the best possible performance, LSAs are applied on every phase.

Review of EGLA Implementation
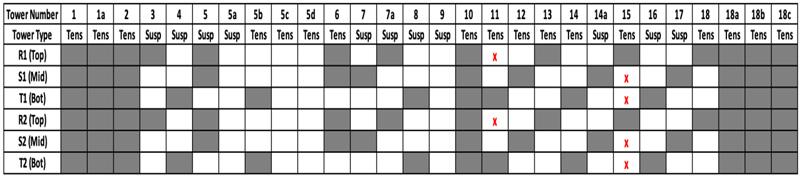
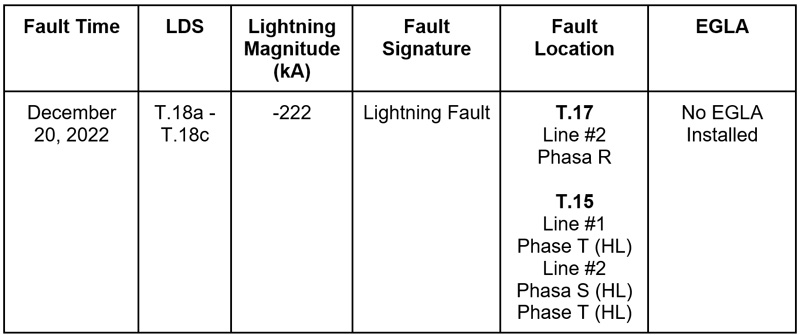
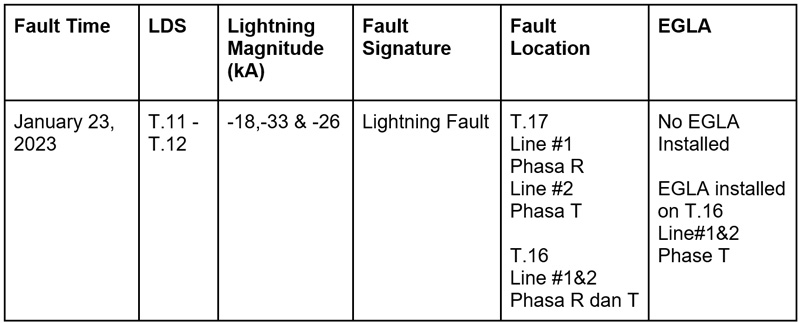
Starting Dec. 2022, when EGLAs were first installed, until Nov. 2023, there have been a total of 3 disturbances caused by lightning. All occured on the Parakan-Kadipaten line and were triggered by short-circuit of insulators. As seen in Table 5, most occurred on insulators without an EGLA installed. CIGRE TB 855 explains that in cases where the lightning surge travels along the line from the stroke point, the lightning fault can be transferred to adjacent towers having no LSAs – either by the OHGW given successful shielding or via power line conductors if there has been shielding failure. This suggests the advisability of installing LSAs on adjacent towers beyond the high lightning risk target section. Note that LSAs may not protect an insulator assembly on the next tower, given the traveling time of a lightning surge across the span between towers.
Case 1
Disturbance that occurred on the transmission line Parakan-Kadipaten #1-2 caused reclosing at both the Parakan Substation and the Kadipaten Substation, indicating that the relay worked. The distance relay functioned in all three phases, R-S-T, Zone 1. The chart from the Disturbance Fault Recorder at both side substations described a significant increase in current in phases R-S-T-N. There were voltage defects in all three phases, which means disturbance caused by active system from a lightning surge. Climbing inspection revealed that several sets of insulators had flashed over, as shown in Table 6.
Case 2
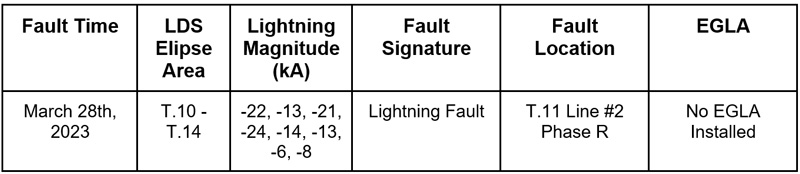
The second case was a disturbance that occurred on transmission line Parakan-Kadipaten #1, which caused reclosure at the Parakan Substation and the Kadipaten Substation, indicating that the relay worked. It was a distance relay that worked in phase R-N, Zone 1. Based on the Disturbance Fault Recorder at Kadipaten Substation, there was a voltage drop in phase R from 38 kV into 5.6 kV and increasing current from 29A into 248A. Morteover, the Disturbance Fault Recorder at Parakan Substation recorded that there was a voltage drop in phase R from 39 kV into 10.1 kV and increasing current from 28A to 592A. The DFR chart showed that disturbance was caused by a lightning surg.
Case 3
A disturbance that occurred on transmission line Parakan-Kadipaten #2 caused reclosing at the Parakan Substation and the Kadipaten Substation, again indicating that the relay worked. This was a distance relay working in phase R-N, Zone 1. Based on the Disturbance Fault Recorder at the Kadipaten Substation, there was a voltage drop in phase R from 38.6 kV into 4 kV and current increasing from 30A to 273A. A Disturbance Fault Recorder at the Parakan Substation recorded that there was a voltage drop in phase R from 39 kV to 12.7 kV and increasing current from 27.6A to 596A. The chart from the DFR showed that the disturbance was caused by a lightning surge.
Discussion
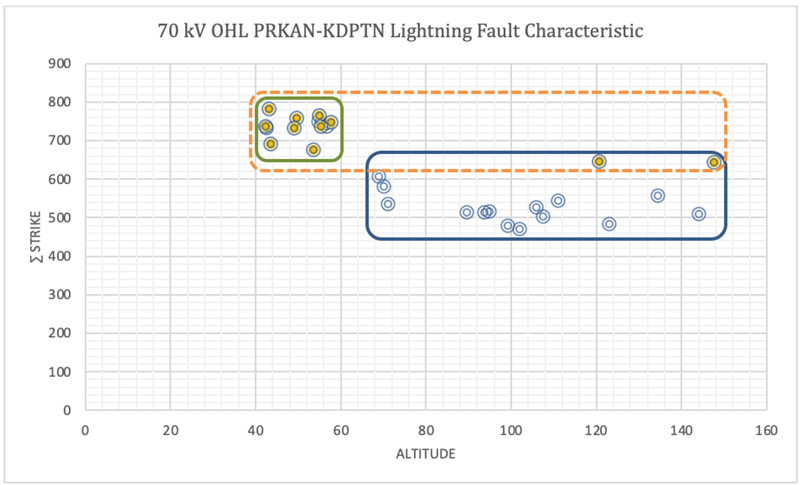
There has been a history of disturbances caused by lightning surges on the Parakan-Kadipaten transmission line between 2018 and 2023, i.e. 20 cases of disturbances caused by lightning surges. Of these, 17 occurred before installation of EGLAs and only 3 after installation. As shown in Fig. 10, the Parakan-Kadipaten Line can be divided into 2 categories: Cluster A (green rectangle) and cluster B (blue rectangle). Cluster A defines towers sited near rice fields while cluster B defines those in hilly areas.
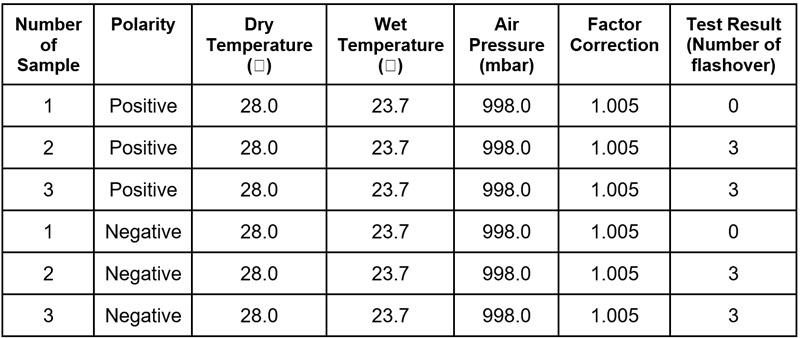
As many as 18 disturbances with 2 times happened in sequence or equal to 90% incident, the disturbance occured in the cluster A area. Towers in rice field have higher vulnerability to being struck by lightning since there are no other structures which can be struck. Disturbances that occurred after installation of EGLAs occurred on Towers #17, 15,16 and 11. According to further investigation, the discharge that occurred was marked by flashover of the insulator. Most flashovers occurred where EGLAs were not installed. Apart from EGLA installation, ageing of insulators has become one of factors in the protection system of a transmission line that is not performing optimally. This is confirmed by the test result of the dry impulse test. The test result in Table 8 stated that dry impulse test failed because maximum flashover that allowed is 2 times.
To obtain optimal lightning protection performance on transmission line, towers that have high critical level need EGLA installation using top-bottom configuration.
This can be achieved through options such as:
1. Adding installations of EGLAs to achieve top-bottom. For example, these can be installed in Cluster A which has high criticality;
2. Relocating EGLAs installed in Cluster B and maintaining towers in Cluster B with minimum configuration while looking to maintain low footing resistance (i.e. <10 ohm);
3. Replacing ageing insulators to obtain optimal results from the protection system against lightning surges.
Conclusions
The 70 kV Parakan-Kadipaten Line was selected for application of EGLAs to test their effectiveness with a particular installation design. Over the period from Dec. 9, 2022, to Aug. 2023, there have been 3 disturbances that resulted in short circuits to insulators that were not equipped with EGLAs.
Based on observations during Qtr 1, 2023, after installation of the EGLAs there was a 33% decrease compared to Qtr 1, 2022 under conditions of all lightning strikes, which also decreased from 625 to 435.
Lightning performance calculations using Sigma SLP software show that the existing configurations do not significantly reduce disturbances on the 70 kV Parakan-Kadipaten Line. By retaining existing numbers, installing EGLAs in a new configuration may end up providing more significant improvements.
References
[1] CIGRE WG C4, Procedures for Estimating the Lightning Performance of Transmission Lines – New Aspects, no. June. Paris: CIGRE, 2021.
[2] PT.PLN (Persero), “70 kV OHL of Parakan-Kadipaten Lightning Detection System Report,” Cirebon, 2023.
[3] CIGRE 855, Effectiveness of line surge arrester for lightning protection of overhead transmission line, no. December. 2021.
[4] IEEE, Guide for Improving the lightning performance of Transmission Lines. 1997.
[5] R. Bhattarai, R. Rashedin, S. Venkatesan, A. Haddad, H. Griffiths, and N. Harid, “Lightning performance of 275 kV transmission lines,” Proc. Univ. Power Eng. Conf., pp. 2–6, 2008, doi: 10.1109/UPEC.2008.4651622.