This edited past contribution to INMR by Rogerio Verdolin of Verdolin Solutions in Canada investigated dielectric performance of circuit breakers during a zero current interruption process.
Transient Recovery Voltage (TRV) of a circuit breaker is voltage difference measured between each side of the circuit breaker to ground. The most severe TRV from an amplitude point of view follows interruption of the first phase to clear an ungrounded three-phase fault. The shift in system neutral results in high amplitude TRV. While the probability of this fault is low, it is a basis for rating a circuit breaker’s TRV capability.
TRV should be measured across the terminals of all circuit breakers in the substation under study and three-phase ungrounded (LLL) fault, three-phase grounded (LLLG), and short line faults (SLF) should be applied near the breakers. There should be several fault locations to find out the worst system TRV on the breakers in order to test breaker TRV capabilities. Short line faults should be applied on transmission lines near the substation under study, with the basis for these being a single line-to-ground fault (SLG). N, N-1 and N-2 conditions should be applied in these studies.
A circuit breaker clearing a capacitor bank is also prone to restrike due to TRV. Transmission lines and equipment connected to the station busbar impact the TRV for the three-phase ungrounded fault test. When studying transient recovery voltage, it is necessary to ensure that all suitable lines, transformers and bus equipment are represented in the transient simulation. It is a good idea to include a lumped capacitor to ground on each phase of the station busbar to encompass all bushing, winding and stray capacitances that might exist at the station. The value used will be an approximation, depending on number of transformers and other equipment connected to the busbar.
Simulation Studies
Selecting System Parameters
The system study simulator should estimate capacitances in the substation. Transformer capacitance (HG, LG and HL) and lump remaining capacitances on the bus as a capacitance to ground should be represented. Capacitor voltage transformers (CVTs) and buswork are the dominant capacitance to ground. Apply different types of faults on the line side of the breaker. Open the breaker. Observe the voltage built up across the breaker terminals (on the first phase to open). Compute the dV/dt and compare against the breaker TRV ratings. Plot the voltage across the breaker and ensure it is below the breaker TRV withstand voltage. IEEE or IEC standards should be used as reference.
Opening a breaker on the transmission line coming into a station, the worst case is if there are only transformers connected to the bus. If there are any other lines, consider opening them and performing the study under contingency conditions to obtain the worst case. Also, check if there is a grading capacitor across the breaker terminals and, if so, include it in the model. Select a system time step such that it would be possible to get multiple points in the initial rate of rise of breaker TRV voltage.
A good portion of this work consists of developing system models (frequency dependent line models, transformers with saturation and proper transformer connections and grounding).
Time Step & Simulation Time
Accuracy of the digital simulation can be affected by use of a time step that is too large or too small. Time step selection depends on steepness of the transient recovery voltage.
Range of time step = 0.5 to 10μs; typical = 0.5μs
Range of simulation length = .20 to .50 seconds; typical = 0.25 seconds.

Guidelines for TRV Studies
A. Transmission Lines
Transmission lines and cables in electric power systems are non-linear in nature due to frequency dependency in conductors (skin effect) and the ground and earth return path. A frequency dependent model should be used in simulation studies. Dimensions and data are required for each transmission line represented in the network diagram. This can be given at the tower and should include conductor sag. Shield wire dimensions and resistance should also be provided. For some short lines where the electromagnetic wave traveling times are small compared to the simulation time step, a lumped pi-circuits representation is to be used. For longer lines with larger wave traveling times, the distributed parameter line model is used.
B. Power Transformers
Simulation of transformers requires an understanding of some of their basic properties involving both core and winding configurations. This is complicated by the fact the core of the transformer is prone to saturation leading to the phenomena of inrush current, remanence, geomagnetic current effects and ferroresonance. Saturation representation of the transformer should be included in the simulation. The transformer model should have provision for a tap changer. Transformer coupling capacitances (HG, LG, and HL) should be represented.
Each transformer connected to the station busbar under study has strong influence on TRV due to the dominant bushing and winding capacitances. The magnetic coupling and winding inductance should be included in TRV studies. The overvoltage transfer through a transformer is a function of transformer stray capacitances. Thus, knowledge of transformer capacitances is required. By combining the bushing capacitance into the winding capacitances, the transformer model with two windings is represented by a winding inductance plus the equivalent circuit of three coupling capacitances: CH – capacitance of the high voltage side to ground; CL – capacitance of the low voltage to ground; and CHL – capacitance of the high voltage side to the low voltage side.
C. Circuit Breakers
Breakers are modelled as simple time controlled switches in electromagnetic transient studies. Circuit breaker coupling capacitance should be represented.
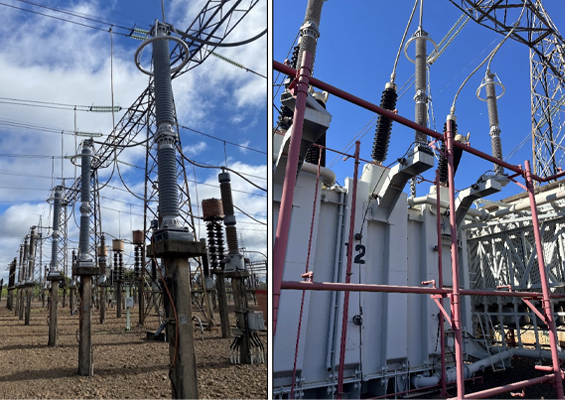
D. Substation Power System Modeling
The first step in performing a TRV study in digital simulation is to build up the power system model of the study subject. This requires detailed representation of the substation and nearby power system. The time varying voltages at the breakers in question will be computed and examined. An onsite visit to collect data of substation layout is recommended. Load flow raw data file in PSS/E data format should also be obtained. The raw file is useful to determine the equivalent circuit of the external power network. A special tool called E-TRAN is used to convert PSS/E power flow raw data file to PSCAD case file. It also does the system reduction and finds the equivalent circuit for a specified part of the power system.

E. Power System Description
The substation consists of two 138 kV transmission lines through two breakers to a common bus. Two transformers convert the 138 kV to 13.8 kV of distribution level and provide power supply for a residential area. The substation is connected to the power network through the 138 kV transmission systems. Networks further away from the substation are represented by equivalent circuits. The following sections give the details of data calculation and set-up of the study model.
Post Insulators & Air Switches Model
This equipment is represented by stray capacitance of 100 pF.
Capacitor Voltage Transformer (CVT) Model
The CVT is represented by CN = 8000 pF based on IEEE C37.011 standard.
25 kV Underground Cables Model
Cable Bergeron Model representation is used in the simulation. The Bergeron model is a simple, constant frequency model based on traveling waves and is useful for studies where it is important to obtain the correct steady state impedance/admittance of the line or cable at fundamental frequency.
Station Layout Model
A detailed station layout diagram is represented in the PSCAD/EMTDC, which contains the physical length of each busbar section between station equipment, circuit breakers, transformers, capacitive voltage transformer, lead length, and underground cables. The TRV waveform is measured with a voltage meter across the terminals of the breaker.
Surge Arrester Model
The voltage-current characteristics of metal-oxide surge arresters are a function of incoming surge steepness. Protective characteristics for surge arresters showing crest discharge voltage versus time-to-crest of discharge voltages are available from manufacturers. The arresters can be modeled as nonlinear resistors with 8 x 20μs maximum voltage-current characteristics.
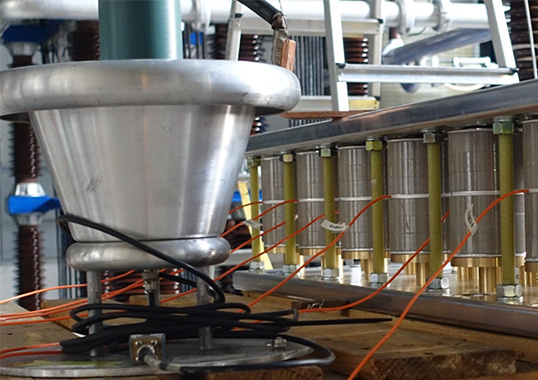
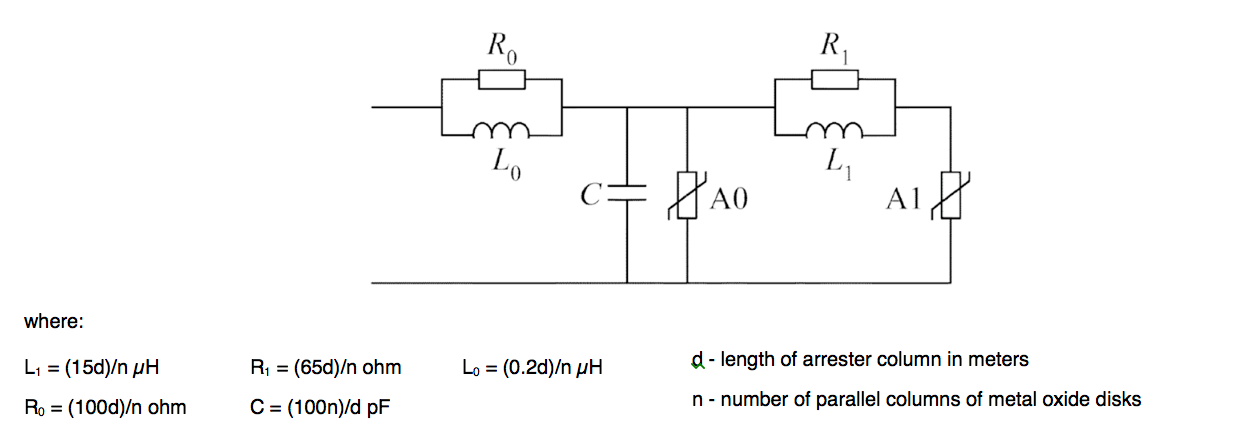
When TRV is to be investigated, the MOV surge arrester representation is significantly different from switching and temporary overvoltage studies. The surge arrester model recommended uses two sections of non-linear resistance designated as A0 and A1, separated by an R-L filter. The non-linear resistors, A0 and A1, can be modeled in PSCAD as a piecewise linear V-I curve with characteristics defined point-by-point. The number of points selected to represent the non-linear resistance depends on smoothness desired. The surge arrester model parameters are then further calibrated by comparing to voltage versus current (VxI) characteristic data from the arrester supplier. This method of arrester modeling is documented in IEEE and in the literature. Fig. 1 shows the representation of the model.

Equivalent Network
When transients are being studied, the whole network usually does not need to be modeled as it does in transient stability studies (where transients are much slower and can reach further into the network). Care is required in selecting the sources representing the short circuit impedance and where the source is located. Since electromagnetic transient programs are generally unable to solve very large networks (<3000 busses), the studies should be performed by introducing network equivalents in the client model system in order to represent the network outside of the study boundaries. The power system simulator should identify a portion of the network for a direct translation into the electromagnetic transient program model. The equivalent is a multi-port, which means that the representation will be correct for steady state as well as for open circuit and short circuit conditions, and contains voltage sources, to match PQ flow (net real and reactive power) and represent the generation in the equivalent network.
Case Studies – TRV Results
A. TRV Simulation Tests
TRV is measured across the terminals of the 145 kV and 15 kV circuit breakers. Three-phase ungrounded (LLL) faults and three-phase grounded (LLLG) faults are applied near the 145 kV and 15 kV breakers. Several fault locations are applied to find out the worst system TRV on the 145 kV and 15 kV breakers in order to test breakers TRV capabilities.
Plot the voltage across the breaker and ensure it is below the breaker TRV withstand voltage (envelope curve) as per IEEE and IEC standards.
Short line faults (SLF) are applied on the transmission lines with location a short distance out from the 145 kV breaker terminals. These SLFs are single line-to-ground faults (SLG).
The breaker is considered ‘PASSED’ if the TRV measured in the simulation does not exceed the TRV envelope curve. Otherwise. the breaker is considered ‘FAILED’ in the simulation. If the breaker does not pass, mitigation actions have to be taken.
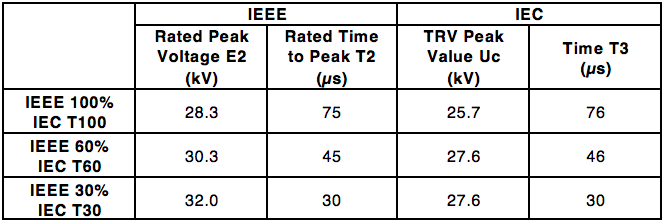
Different TRV envelope curves (100%, 60%, 30%) of the circuit breaker are selected based on short-circuit current measured during the fault.
B. Fault Locations
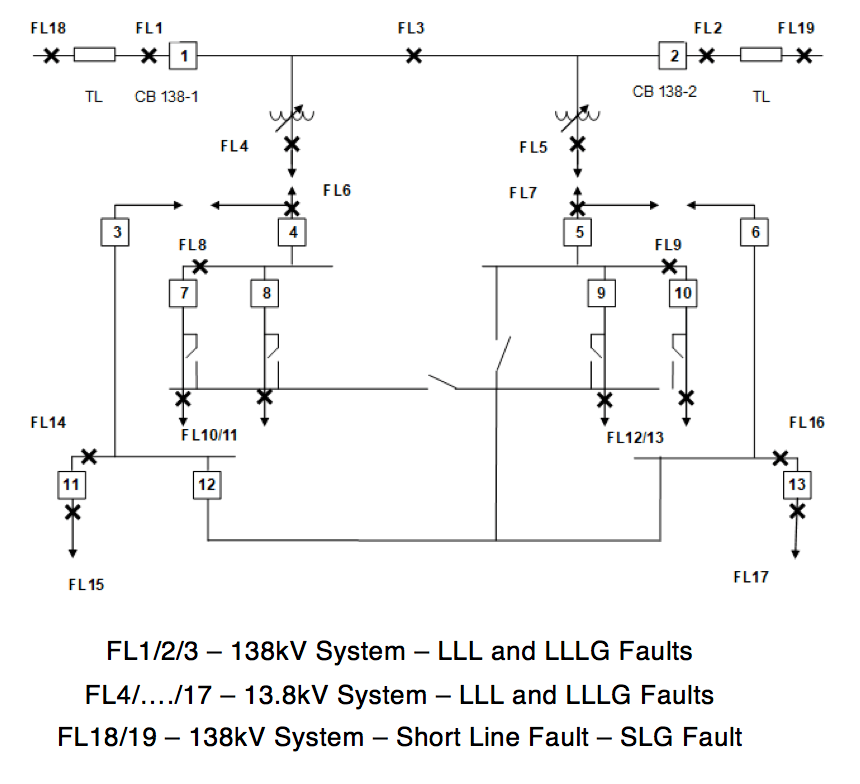
Fig. 2 shows fault locations of the TRV simulation studies.
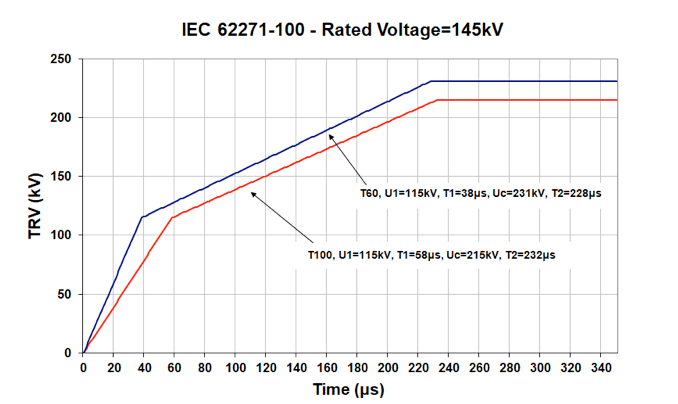
C. TRV Envelope Curves
IEC 62271-100 envelope curve is used in the simulation and compared with the TRV measured values across the terminals of the pole of the circuit breakers. Fig. 3 shows the IEC envelope curve and Table 1 provides IEEE and IEC TRV envelope data for 15 kV circuit breakers.

D. Mitigating TRV
According to IEEE C37.011, when the inherent TRV of the system exceeds standards, the user has three major alternatives outside of re-configuring the system:
a) Using a circuit breaker with higher voltage rating or a modified circuit breaker;
b) Adding capacitance to the circuit-breaker terminal(s) to reduce rate of rise of TRV;
c) Consulting the manufacturer concerning the application.
As long as a circuit breaker is applied within its symmetrical current and voltage ratings, one of these methods should result in a satisfactory application.
E. Alternative Mitigation Solution
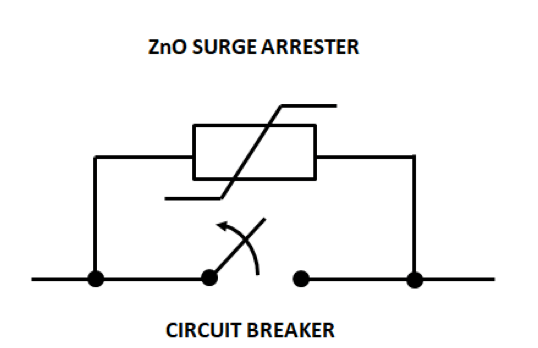
Placement of a zinc oxide surge arrester across the circuit breaker terminals is an alternative solution to reduce TRV, as shown in Fig. 4.
F. TRV Results
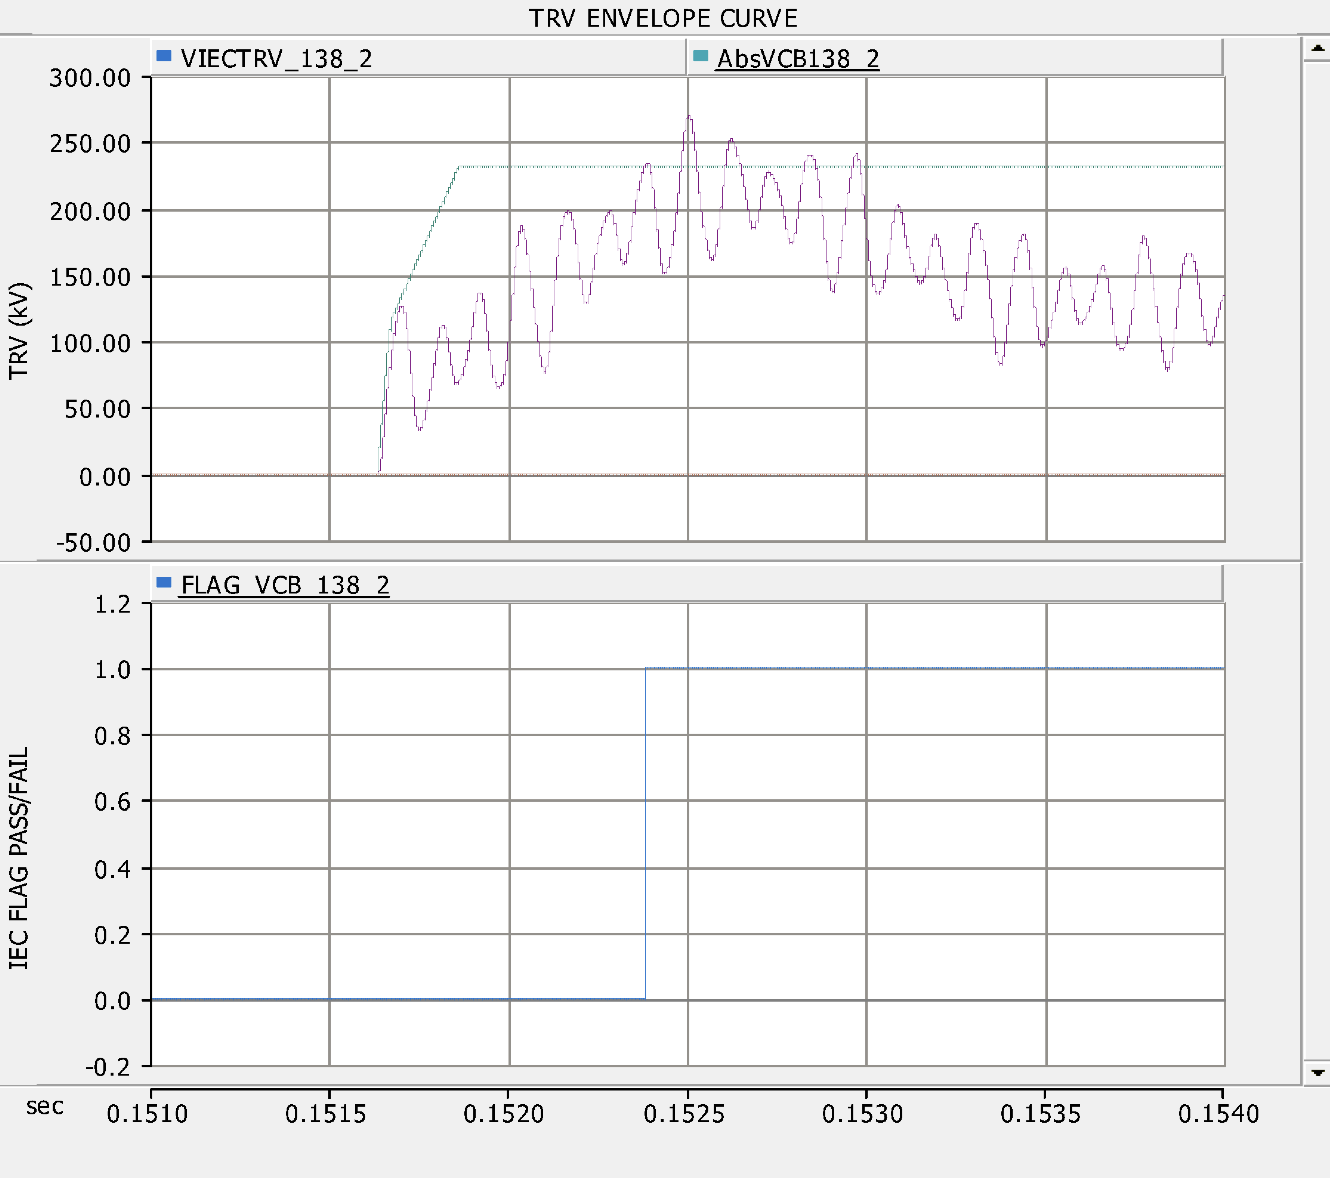
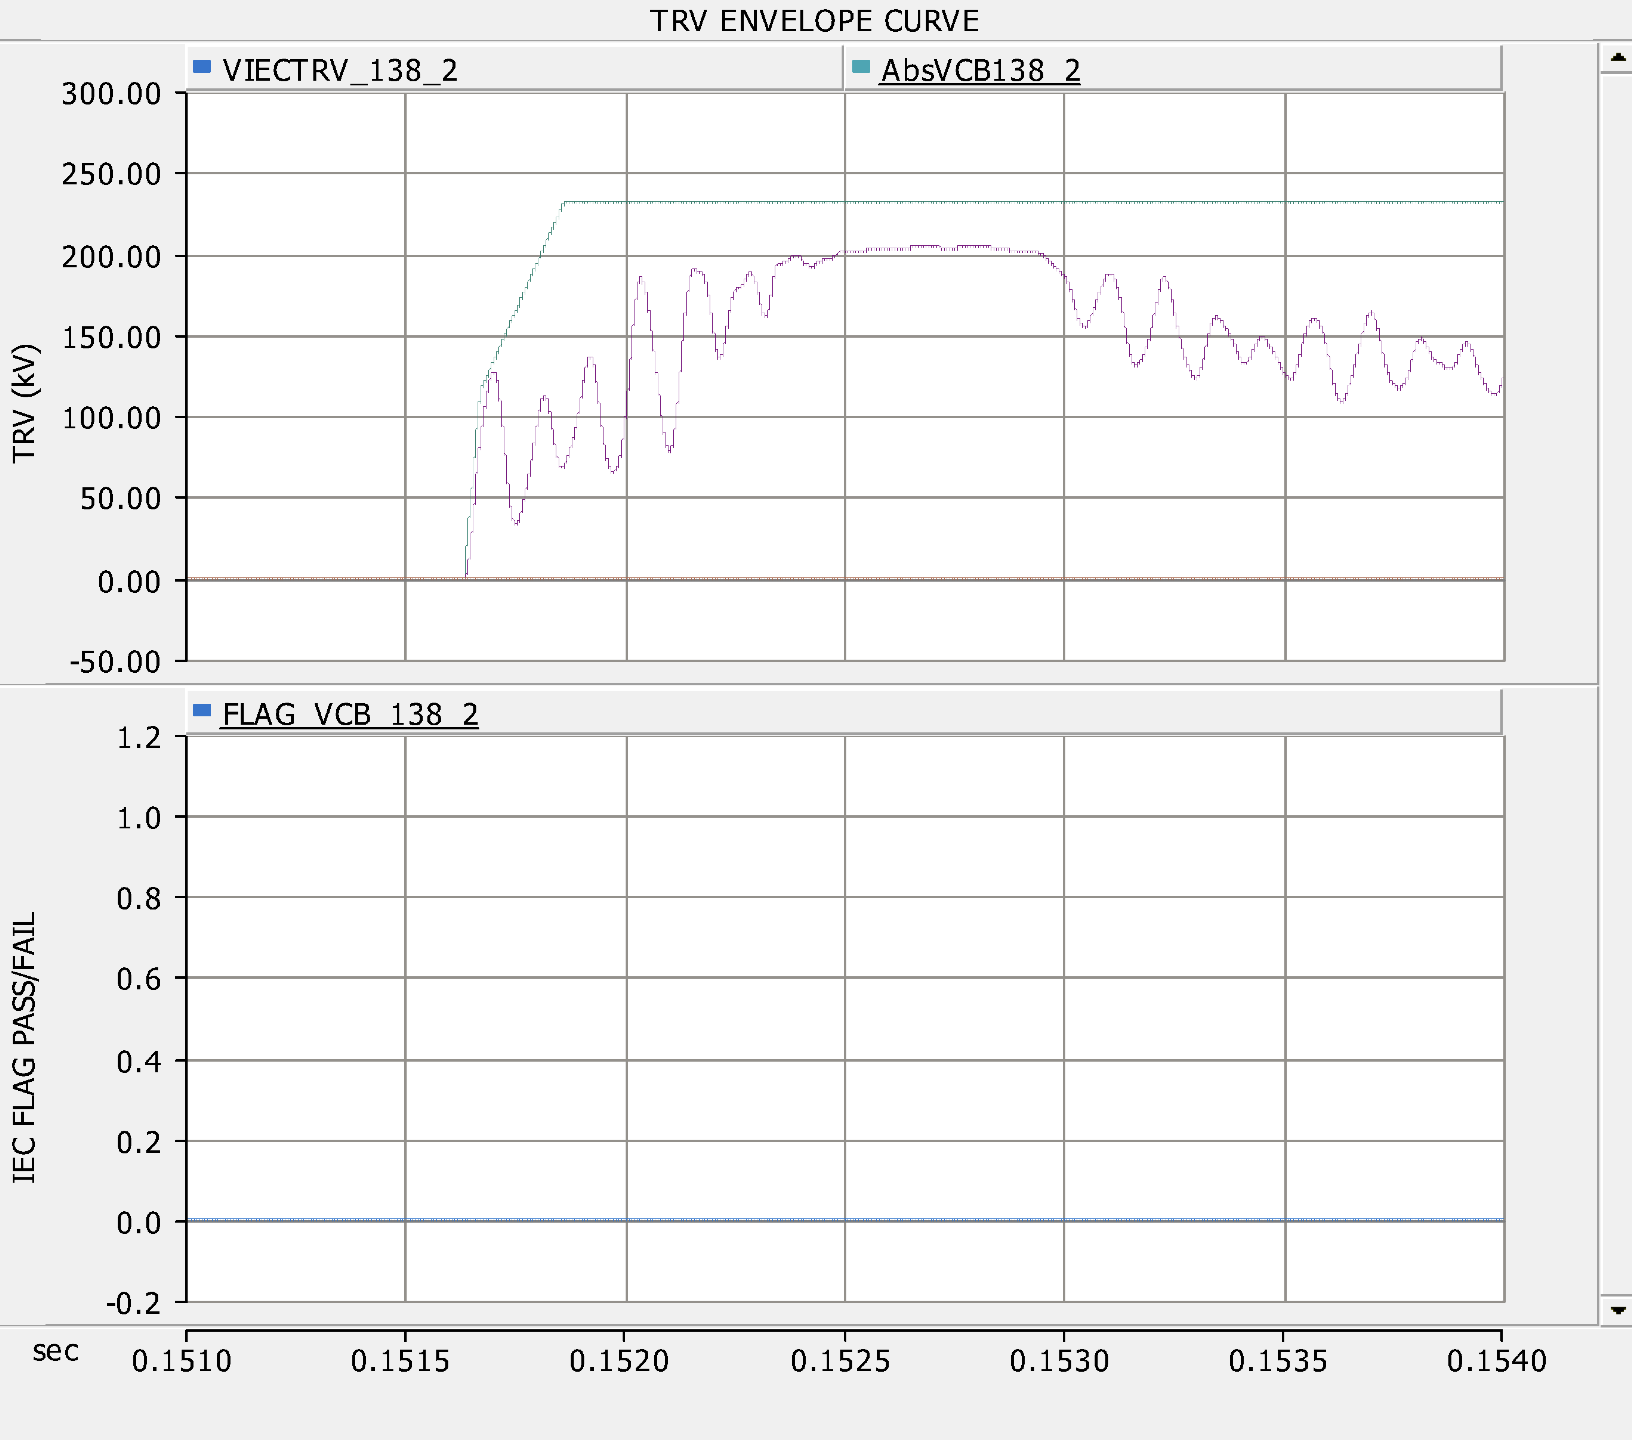
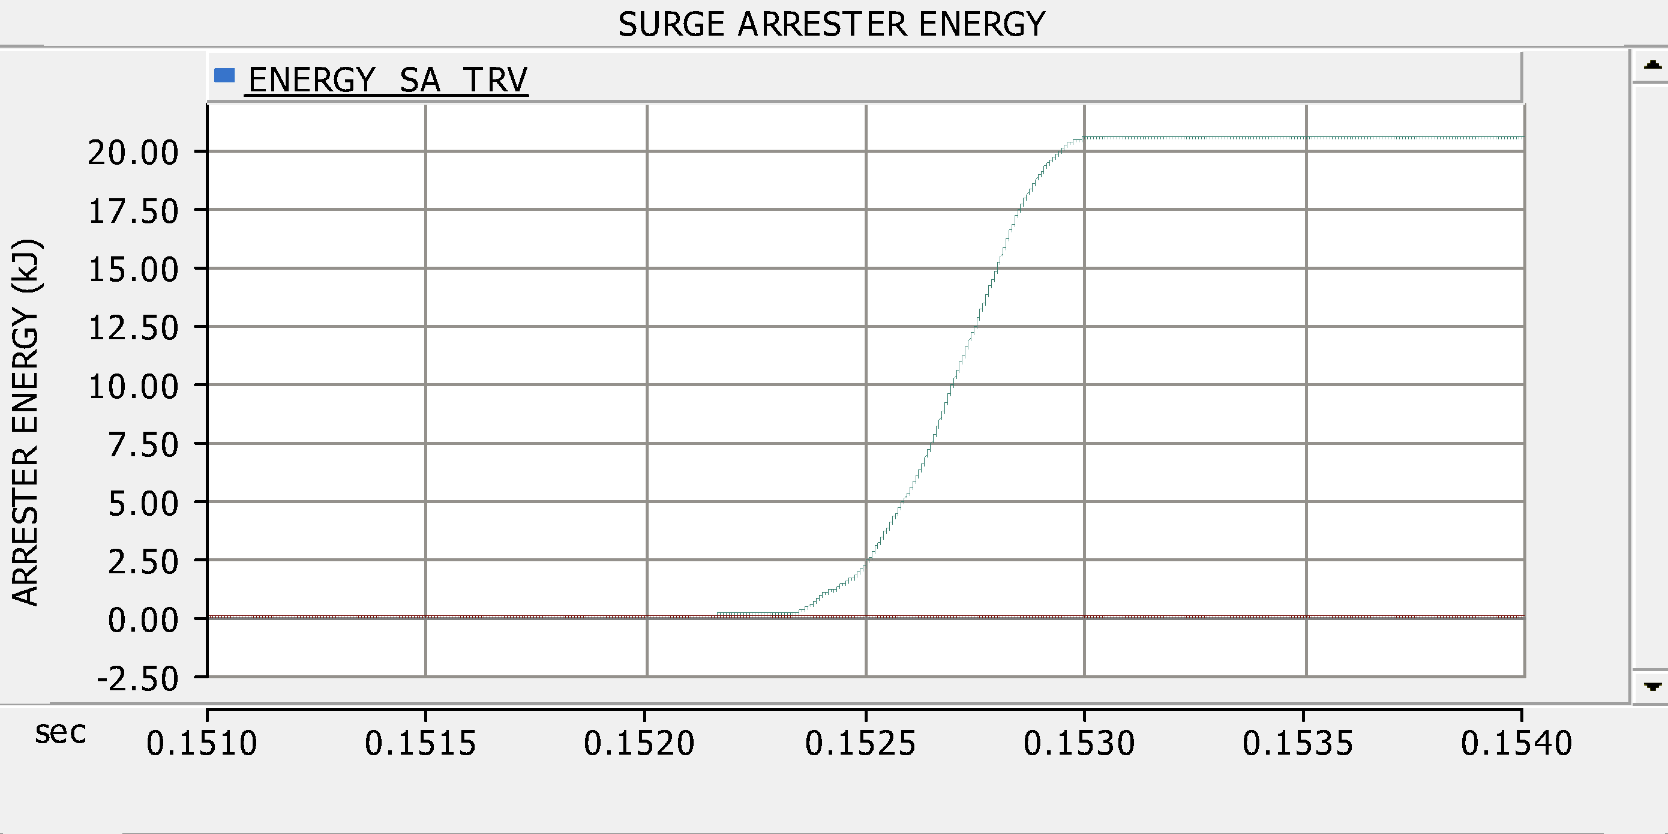
Several mitigation solutions are applied in order to reduce the TRV measured across the terminals of a pole of the circuit breakers under the N-1 condition. These include surge capacitors to ground, grading capacitors across the breaker contacts, surge arresters and smooth reactors. Simulations are applied with and without the surge arrester at the high voltage power transformers side. When the measured TRV exceeds the TRV envelope curve, a PSCAD/EMTDC component is modeled to show a ‘FAIL’ flag sign (no fail=0/fail=1). Figs. 5 and 6 show the result of a TRV simulation where a three-phase ungrounded fault (LLL), usually the most severe TRV condition, is applied near breaker CB 138-2 at the substation side, with CB 138-1 open – both without an arrester and with a 132 kV (106 MCOV) voltage rating surge arrester across the terminals respectively. Fig. 7 shows that the arrester absorbed energy curve of the TRV simulation (total of 20.5 kJ), which is small compared to its rated energy handling capability (i.e. 3.4 kJ/kV MCOV).

T60 envelope curve is used in the simulation when only one of the 138 kV transmission lines is connected to the substation (N-1 condition). The highest short circuit current in the simulations is lower than 15 kArms, which is lower than 60% of the breaker rated short circuit current (31.5 kA)
Conclusions from TRV Simulations
Critical factors in simulation of TRV include:
• capacitance on the bus; other transmission lines connected to the bus;
• selection and location of faults being cleared; and
• transformer inductances and stray capacitances.
These studies have represented the substation under study in detail – specifically a model generally used for lightning studies has been used (where individual buswork components, stray capacitance are represented) which is more accurate than simply adding up the total capacitance of all elements on the bus and lumping it into a single capacitance in the simulation. Data for critical elements (such as transformer capacitances and CVTs) is available and used in the studies. Also, a sufficiently small-time step is used so the rapid build-up of voltage can be observed. The data and simulation methods used in these studies are consistent with generally accepted practice.
TRV simulation results are directly compared to IEC/IEEE and breaker TRV curves. If the voltage across the breaker terminal exceeds the IEC envelope, a fail indicator is generated. TRV simulation failure is reported for several cases (clearing LLLG and LLL faults) when breaker voltage is compared to the allowable curve for clearing a fault with a short circuit current.
References
IEEE Std C37.011, IEEE application guide for transient recovery voltage for AC high-voltage circuit breakers rated on a symmetrical current basis.
IEC 62271-100, High-voltage switchgear and controlgear – Part 100: Alternating-current circuit-breakers
PSCAD Electromagnetic Transients User’s Guide.
IEEE WG 3.4.1 l, “Modeling of Metal Oxide Surge Arresters,” IEEE Transactions of Power Delivery, Vol. 7, No. 1, January 1992, pp 302-307.
Verdolin, R., “Modeling of ZnO Surge Arresters”, The University of Manitoba – Power Systems Transient Simulation, May 1992.
M. Nobre, W. L. A. Neve, B. A. de Souza, “An Alternative to Reduce Medium-Voltage Transient Recovery Voltage Peaks”.