Ultraviolet (UV) discharges and thermal hotspot activity are indicators of defects on high voltage components. Given this, being able to efficiently visualize their source has long been a goal of power engineers. Thermal imaging using infrared (IR) detectors has been used for years and enables location of high temperature problem areas or ‘hotspots’. But past methods of corona detection, including audible noise, were not able to pinpoint the source or location of discharge. The advent of modern corona imaging systems changed that since knowing that there is corona discharge present and finding its location and cause are different challenges. Often, the sources of hotspots and UV discharges are also different and this requires different technologies to visualize them. At the same time, it is easier to assess the severity of a problem if it can be seen and compared against visual results of the same defect.

Principles of UV Discharge Generation & Detection
Understanding the technology to visualize corona requires knowledge of the physical process of UV discharge generation as well as of the electro-optic principles for detection. UV discharges are generated by high electric field that surrounds HV equipment and ionizes nitrogen molecules in air. During the ionization and de-ionization process, photons are emitted to the surrounding air at a wavelength characteristic of the spectroscopic properties of nitrogen. The nitrogen molecules emit photons mainly in the ultraviolet region, with dominant peaks at 298 nm, 347 nm and 358 nm. Emissions at those short wavelengths are barely visible since receptors in the eye are sensitive only from 400 to 700 nm. Hence, shorter or longer wavelengths go undetected. Most commercial grade lenses in binoculars and camera lenses are poorly transparent for ultraviolet radiation and suppress any UV discharges that might be seen with such equipment.
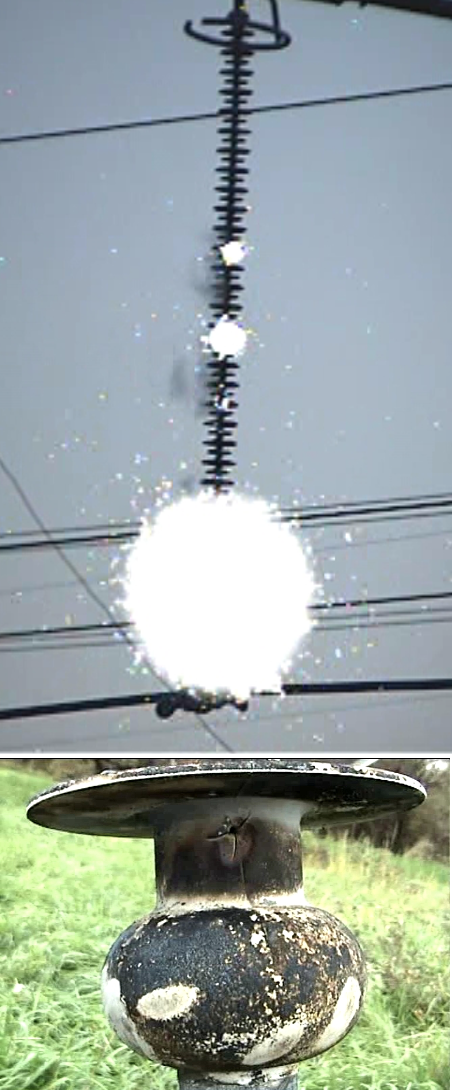
Acoustic detection of electrical discharges was the earliest technology to link lightning flashes and the associated sound of thunder. With the dawn of the electrical age, it became apparent that high voltage sparks in air produce acoustic emissions equivalent to lightning during a storm but on far reduced scale. As increasingly higher voltages came to be used, corona at highly stressed regions on electrical equipment and conductors could be seen by eye, in the dark, and their associated acoustic emissions heard. In the early days, the human ear served as a valuable discharge detector and locator of surprising sensitivity. Engineers are familiar with this phenomenon since the sound of corona can often be heard at HV substations and from transmission lines, particularly on wet or foggy days.
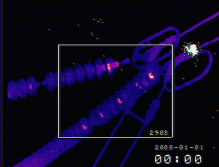
The primary method of problem detection of UV discharges used to be visual, assisted only by an optical device such as binoculars. Unfortunately, this had to be done at night to eliminate the overwhelming effect of the sun. Even then, only significant discharges on high voltage systems would be visible. Introduction of the first corona cameras began in the early 1990s, initially only for night-time, low light and indoor use. These allowed corona discharges to be seen in the UVa (320 to 400 nm) and UVb (280 to 320 nm) wavebands at its point of inception. Such systems provided a real-time image of the phenomenon. Progress was later made in this technology through more complex lens systems that yield greater light collection and sensitivity. These are still in use where manpower availability dictates against daylight surveys or where the survey is indoors, away from overpowering natural sunlight.
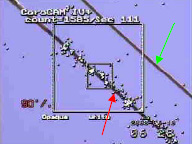
User need soon progressed to requiring cameras that could be used during daylight hours for greater efficiency and safety as well as improved background imaging via the visible channel. Development of the daylight solar-blind camera, although constrained by low levels of UVc corona emissions below 280 nm at which solar energy ceases, allowed inspection during the day as well as relative quantification of the number of UV photon events taking place. The next generation of daylight UV detection cameras offered a removable solar blind filter on the UV channel and near-IR filter on the visible channel. This allowed the same system to be used with greater sensitivity in indoor situations or under low light conditions.
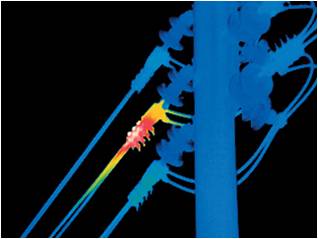
Due to the need to split the image entering the camera to allow the solar-blind filter to block solar radiation, these daylight systems are digital. The UV image is a series of pixels superimposed on the visible daylight image. This has the advantage that it allows ample processing and gives the user options in displaying the UV image to best advantage. These include image coloration to enable the UV to contrast with the background, frame integration to remove background noise, photon counting for UV quantification and high definition zoom to see the discharge location more clearly. Generally, the lower voltage limit for daylight detection of HV faults has been around 11 kV, depending on distance from the object and problem severity. This is reduced to around 3 kV when the solar-blind filter is removed.

Thermal Hotspot Visualization
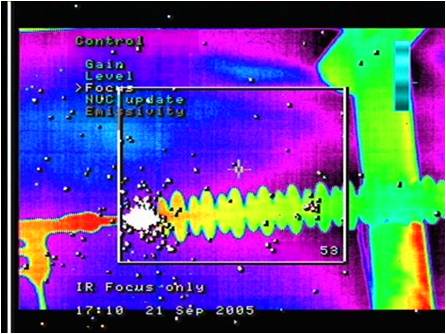
Infrared detection technology has been used much longer than UV visualization and is an accepted method to detect faults that could lead to failures on HV systems. A number of sophisticated and expensive systems are available. But IR tells only part of the story since it does not pick up surface discharges where heat is not generated but that relate to voltage differences, thereby indicating potential for flashover and outage. The opposite applies to UV detection, which does not pick up hidden or current related faults from which UV photons cannot escape but which may produce hotspots detectable by the IR imaging system. Both phenomena provide valuable information on the integrity of a power line and its associated hardware. As such, both visualization technologies are required to provide a complete picture. If this can be done using a single instrument, with the addition of a visible spectrum image as well, the inspection process become more efficient. It also ensures that the picture shows both phenomena under the same ambient conditions and settings, thereby eliminating variables when comparing findings from separate instruments taken at different times.
Visualization Applications
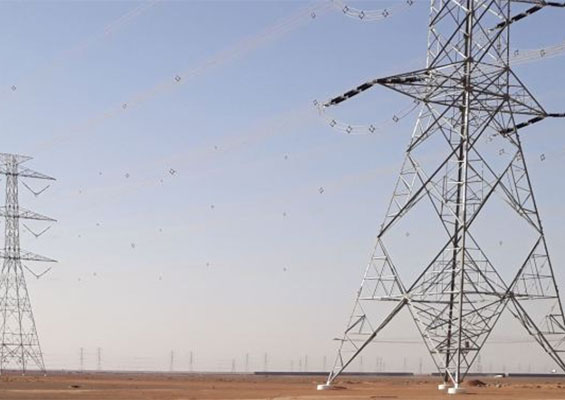
There are several ways to deploy visualization technologies, depending on application. For small areas such as substations, surveys on foot using portable systems are most suitable. For transmission and distribution line surveys, the detection/visualization system is best mounted onto a vehicle or in a helicopter for long lines or difficult terrain. Each system has advantages and drawbacks and careful selection is required for most efficient use of equipment and manpower. Use of helicopters has further options in that the visualization systems can be handheld, mounted within the helicopter or, better, in a gimbal under the helicopter and controlled from within. For all these options, it is preferable to have some automatic location system and essential to have a proper recording system so that faults detected during a survey can be analyzed and reported on. A recent refinement for low cost aerial inspections of relatively short distance is the unmanned aerial vehicle (UAV). Currently these are radio controlled by a ground-based operator but autonomous flight systems will soon be able to fly pre-programmed patterns along sections of line. A further use of visualization technology is in 24/7 surveys of fixed locations such as vulnerable areas within a substation. This can be done either with a fixed field of view camera or, more likely, one mounted on a pan and tilt mechanism that allows the operator to survey a larger area. This system can be used with image or pattern recognition software to alert operators to changes between successive sweeps that may indicate early onset of a problem.
Visualization is only part of the solution since interpreting the results is also needed. The first prerequisite is to have results in pictorial form. That means visualization systems must be capable of recording both still images and video clips. Low-light cameras generally only output recordable video streams. Daylight systems allow on-board image storage as well as video output, thus allowing more effective use of survey time. The following points are important when reviewing results from a UV or IR survey:
• Not all UV discharges or hotspots are a danger to equipment, even if they are an indication of some developing abnormality;
• Any UV discharge or hotspot indicates some loss of power, at the least;
• Individual UV and IR detection camera readings are not always conclusive and should ideally be used together, for comparison;
• Many HV equipment, environmental and instrument variables can affect UV photon or IR temperature readings;
• Any source/cause of UV discharges or hotspots must be understood before deciding on the best course of action.

Although daylight corona and infrared cameras have the respective functions of counting and displaying the number of photons or the temperature of a hotspot, this is not necessarily an absolute measurement of severity of discharge or hotspot. Nor can any specific conclusion be made from a single reading without also considering variables such as distance, weather, camera settings and HV equipment design parameters. Rather, these cameras should be used as data collection systems: to compare two equivalent pieces of HV equipment and highlight significant differences in UV discharge activity or hotspot temperature with the same camera settings; or to build up a picture, over time, of changes in behavior and UV discharge activity or hotspot temperature readings from specific equipment.
To determine what remedial actions should be taken, based on results from UV or IR surveys of equipment, it is necessary first to:
• Develop list of critical equipment to be monitored;
• Establish design criteria/safety factors for this equipment and thus potential failure modes;
• Develop a matrix for UV discharge/hotspot causes versus effects with appropriate actions for various situations;
• Build a set of criteria for visualization camera settings for taking consistent equipment monitoring readings;
• Build a database of UV discharge and/or IR hotspot values on critical equipment with the above criteria, including physical environment factors;
• Continually update the matrix and criteria as more data become available (e.g. photon/temperature readings versus actual physical inspection of equipment).

The final step is to create reports that can be used to highlight issues to management or to maintenance departments for action to be taken to rectify any problem areas. Software packages are available and most utilities have their own internal format for such reports. It is simple to create documents that summarize key aspects and include images taken by camera or grabbed from a video.
The next steps in the evolution of the visualization technology include incorporation of new sensor technologies from research programs in other fields. These will lead to more sensitive (earlier detection of even minor faults on low voltage systems), more compact and lighter systems with more features, powerful image processing capabilities and more user adaptable features. One challenge ahead in the aerial inspection field will be autonomous UAV systems as a way to reduce survey costs. Another will be fulfillment of user demands for instant analysis of results of a visualization process into a severity report and set of recommendations for remedial action. Over and above ongoing development of visualization techniques will be development of new technologies for non-destructive testing of equipment on which faults are found and visualized.

Listen and learn from experts on the role of diagnostics and condition monitoring for asset management under ageing, climate change and earthquake at the 2023 INMR WORLD CONGRESS in Bangkok.


[inline_ad_block]