![]() Leer artículo en español
Leer artículo en español ![]() 阅读本篇文章的中文版
阅读本篇文章的中文版
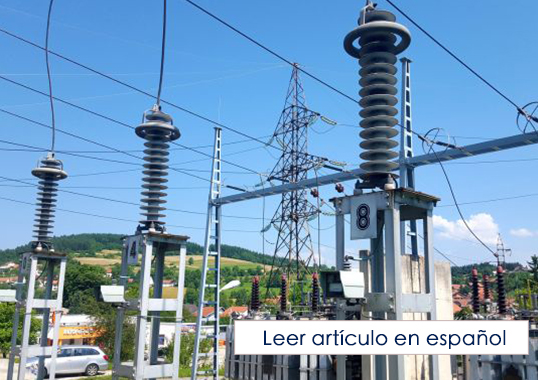
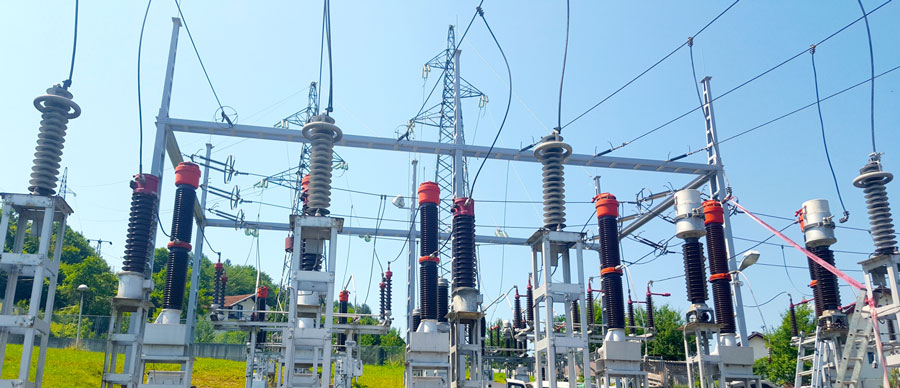
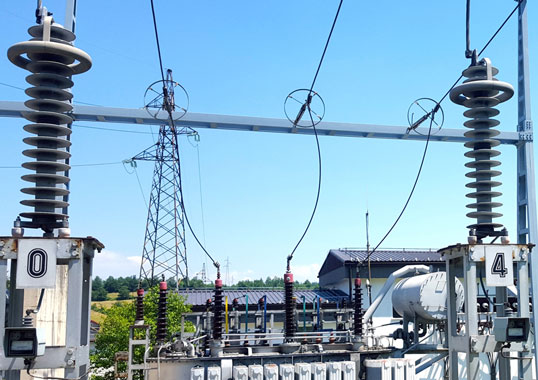
To protect expensive assets at its substations, the company operating the power system in Bosnia and Herzegovina began installing metal oxide (MO) surge arresters in each of its HV transformer bays about 35 years ago. This program saw virtually all the 110 kV, 220 kV and 400 kV transformer bays equipped with arresters over the years between 1996 and 2000. Although these arresters do not normally require maintenance, most users regard it necessary to monitor them periodically using a variety of methodologies.
Starting 2001, Elektroprenos began condition testing of its arrester fleet based on measurement of the resistive component of leakage current at system voltage, i.e. analysis of total leakage current with 3rd harmonic compensation.
This edited past contribution to INMR by Elektroprenos transmission engineers reviewed the rationale for and case histories from this testing program. It also mentions examples where significant increases in the resistive component of total leakage current were found and discussed the causes.
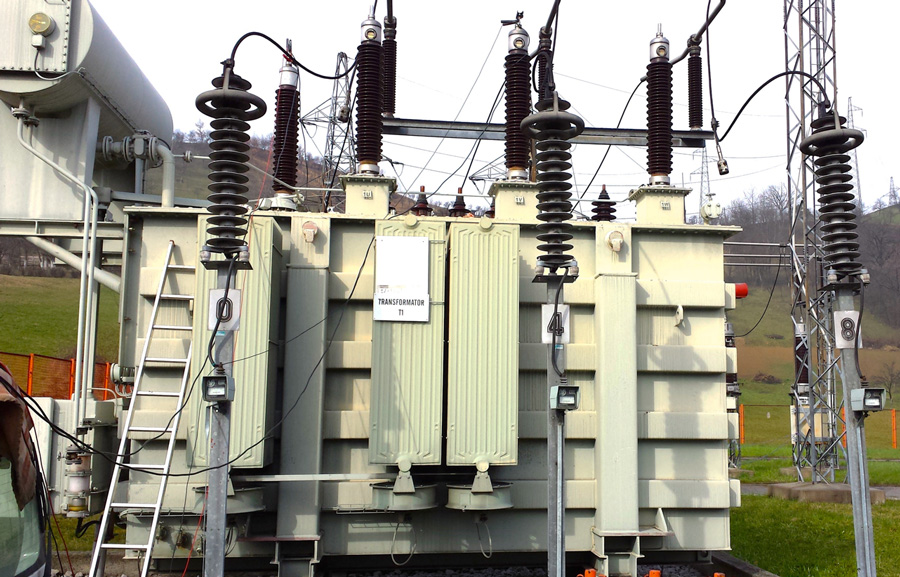
While the basic role of surge arresters is to protect electrical equipment against overvoltages, most of their service lives sees them function basically as insulators. Because of their unique structure (i.e. the MO discs have non-linear voltage/current characteristics and are connected in series), there is constant flow of current through the ground wire. Any deterioration in insulation characteristics will therefore be accompanied by increased total leakage current – especially its resistive component – at the applicable network voltage and ambient temperature. As a result, most diagnostic methods to monitor arrester condition are based on measurement of this parameter and Elektoprenos decided to also base its testing program on such an analysis. For practical and economic reasons, it was seen as desirable that testing be carried out under normal service conditions and special leakage current monitors (LCM) were purchased for this purpose.
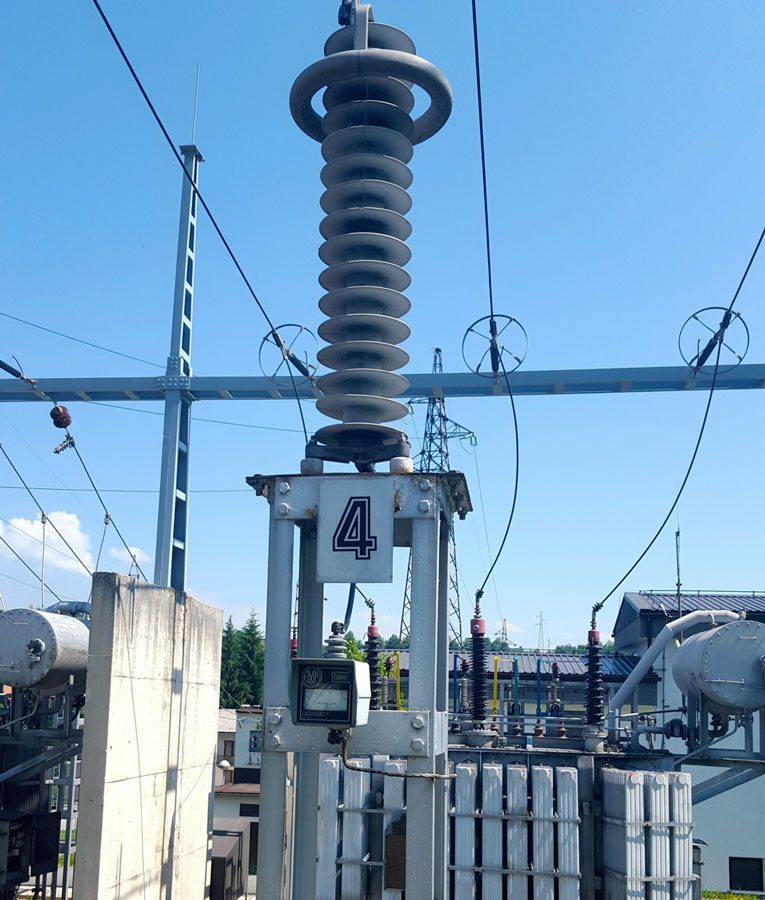
LCM Equipment: Basic Principles
When sinusoidal voltage is applied to an arrester, total leakage current contains higher harmonics due to the non-linear resistance of the MO discs. The amount of these harmonics depends on the amplitude of resistive leakage current and the degree of non-linearity in the resistance of the varistors (also dependent on system voltage and temperature). This explains why the harmonic content of leakage current serves as an effective indicator of level of resistive leakage current. Apart from the non-linear resistance of MO arresters, total content of leakage current harmonics also includes that originating from the transmission network itself. Capacitive leakage current harmonics generated by system voltage are of the same order of magnitude as leakage current harmonics generated by the non-linear resistance of arresters. For example, typical peak values of capacitive leakage current are about 1 mA and 1% of the 3rd harmonics contained in network voltage produce a peak capacitive current of about 30 mA. Therefore, it is necessary to compensate for (i.e. eliminate) harmonics in leakage current generated by the network voltage to avoid risk of large errors when testing arresters.
The LCM equipment used at Elektroprenos to monitor arrester condition consists of:
1. a control unit in which all data is processed;
2. a current probe that provides information on leakage current through the ground wire;and
3. a voltage probe positioned close to the insulating base that provides the information required to compensate for harmonics present in system voltage.
Correction & Analysis of Test Measurements
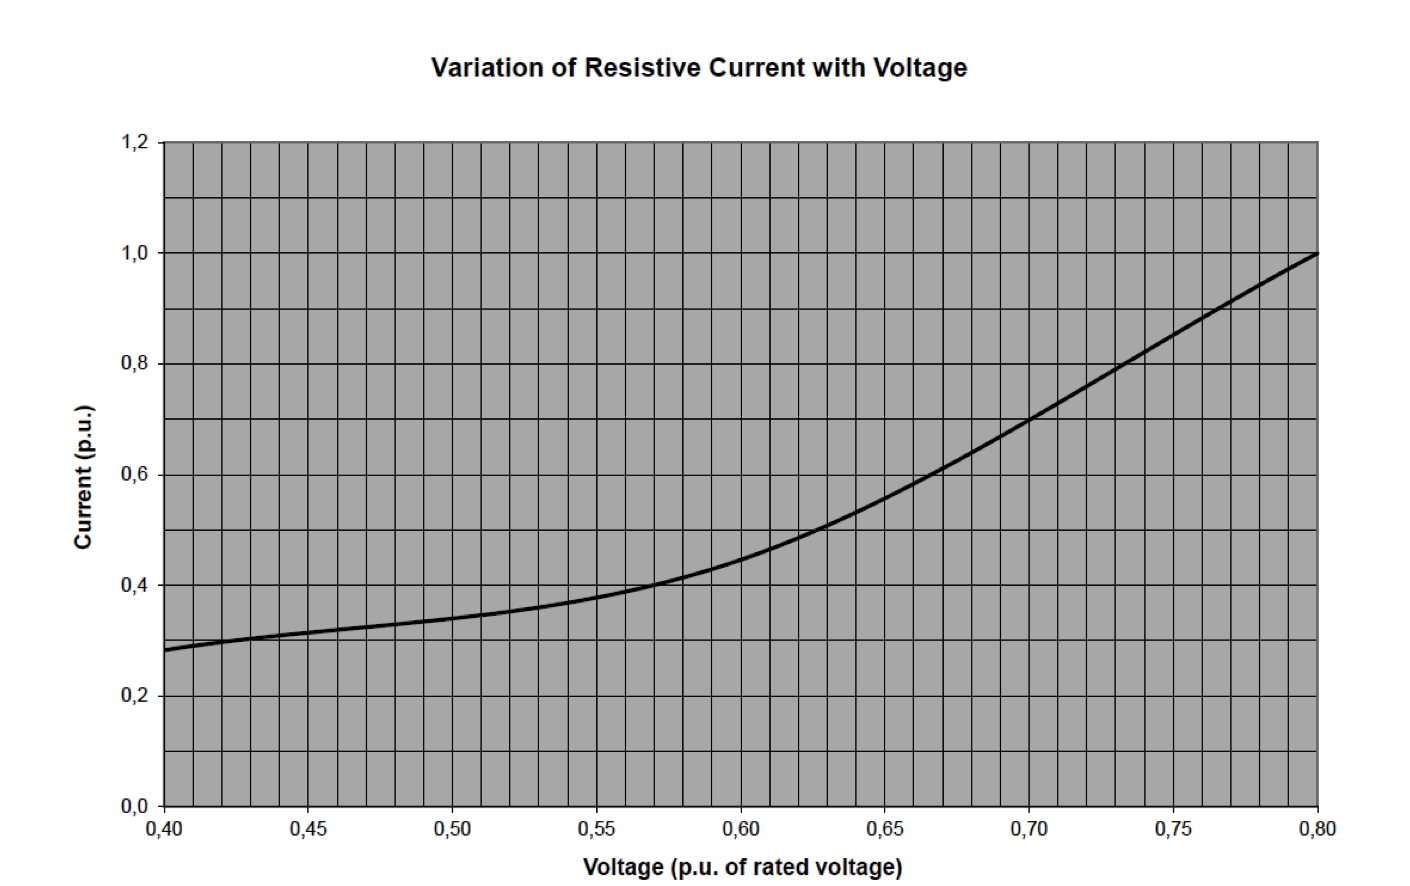
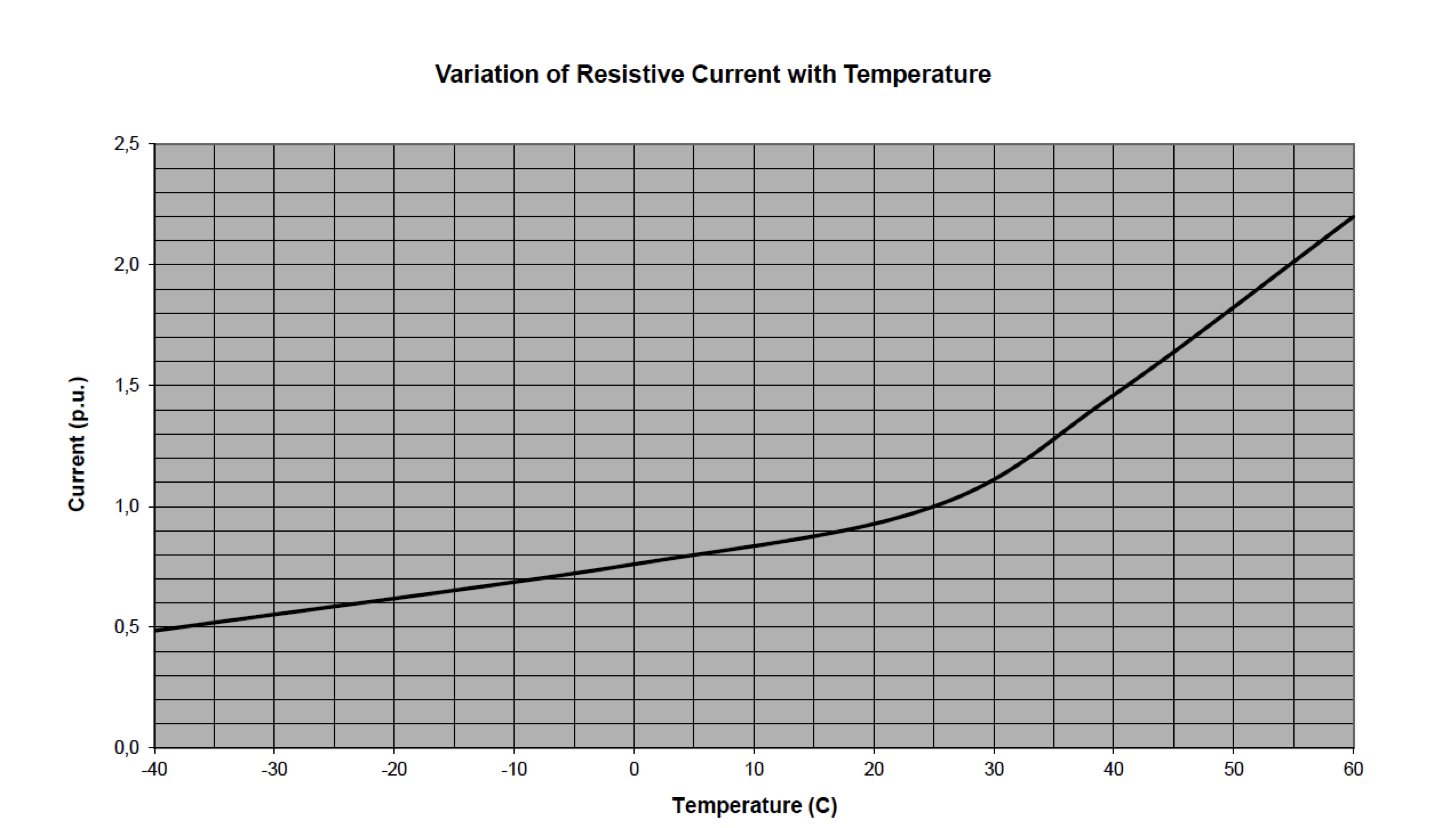
Measurements from LCM testing equipment are always shown as if a network voltage of 0.7 Un was being applied to the arrester and varistor temperature was maintained at 20°C. However, these conditions seldom occur during testing. That is why – having in mind that the relation between resistive leakage current and resistive leakage current 3rd harmonic vary with network voltage and temperature – a correction to the measurements must be performed. This correction is based on special curves provided by the manufacturer of the test equipment. The end result is resistive leakage current corrected to actual ambient temperature as well as actual network voltage applied to the arrester.
Analysis of resistive leakage current data is made by comparing the results from testing arresters of the same type, same year of production and similar serial number. Moreover, since ageing of the MO varistors leads to higher resistive leakage current, it is necessary to perform testing at regular intervals to record such increases. The specific relationship between resistive leakage current 3rd harmonic and total resistive leakage current in LCM testing equipment is determined for the arresters produced by one manufacturer. Therefore, measurements are only valid for that particular supplier’s arresters. However, LCM testing equipment can also be used for testing arresters manufactured by other suppliers if one takes into account that results will not be the actual value of resistive leakage. Fortunately, this does not have much impact on the analysis assuming measurements are made at equal time intervals, while also monitoring any increase in resistive leakage current between measurements. Using this approach, results can be classified into analysis of measurements performed on arresters from one supplier and a similar analysis conducted on arresters from other suppliers.
Measurements performed using the particular LCM equipment purchased by Elektroprenos were valid only for arresters made by a manufacturer associated with this equipment (Supplier 2). Therefore, when using it to test arresters from other manufacturers it was necessary to monitor any increase in resistive leakage current from the time each arrester was energized and then at specific time intervals. The manufacturer that supplied the majority of arresters installed on the Bosnian transmission network (Supplier 1) suggested that, if resistive leakage current increased more than 3 times initial value, additional testing would have to be performed. Alternatively, the manufacturer would have to be contacted and the arrester eventually replaced. This same philosophy would apply to arresters from other suppliers. Analysis of measurements made after arrester energization was done comparing data with results obtained on arresters of the same type, same year of production, same catalogue number and similar serial number. Also, all relevant operating conditions had to be taken into account (e.g. time in service, exposure to surges, number of surges registered on counter etc.).
Since resistive leakage current varies with temperature and system voltage, comparing results of two measurements on the same arrester or on an arrester of the same type requires performing a correction to the reference value. Usually, such a correction is made to 20°C and 0.7Un. Correction curves can be obtained from the arrester manufacturer. Figs. 1 and 2, for example, show examples of the variation in resistive leakage current with voltage and temperature for arresters from Supplier 1.
Testing Transmission Arresters
The arrester test program at Elektroprenos began when most of the installed units had already been in service for between 2 and 5 years. As such, it was not possible to know the resistive leakage current value at time of energization. Analysis was then performed by comparing measurements with those obtained on arresters of the same type, same year of production, same catalogue number and similar serial number.
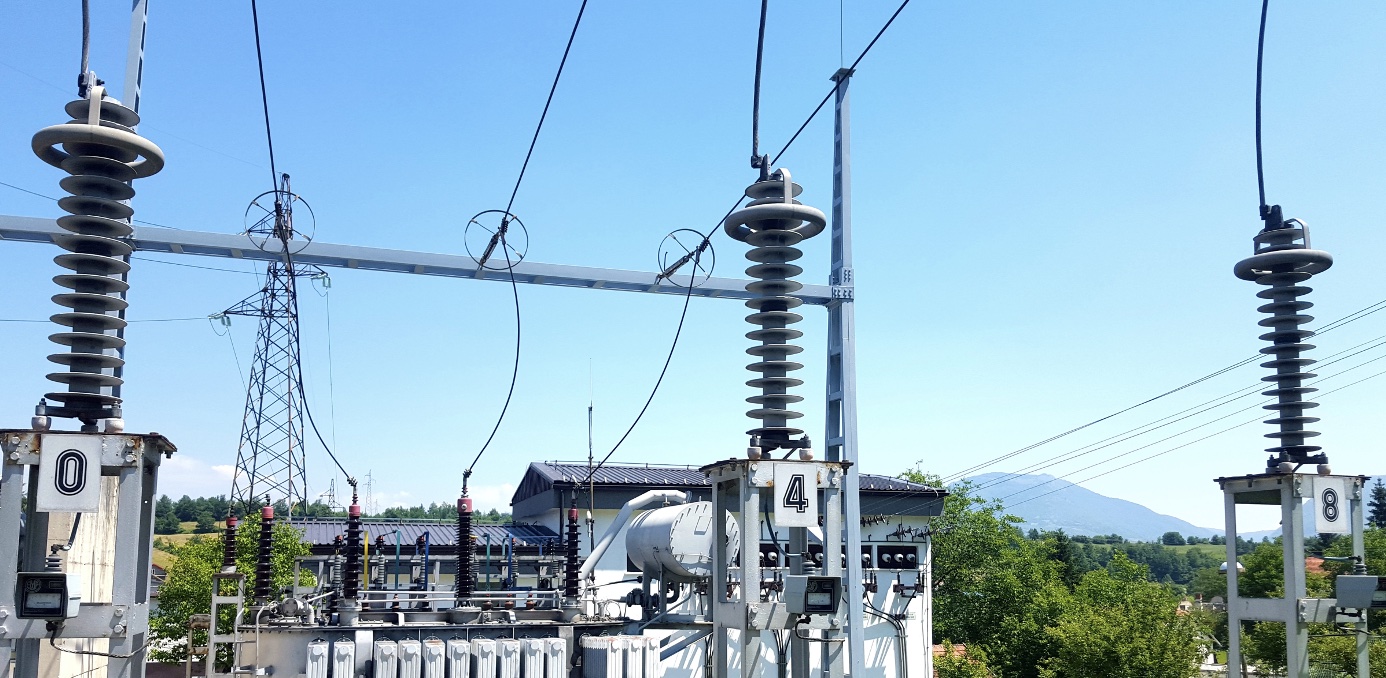
The highest numbers of arresters tested were installed on the 110 kV network and circa 80% of all arresters in the Elektroprenos network were produced by Supplier 1. Smaller numbers of arresters have come from a range of other manufacturers. Figs. 3 and 4 show data for an arrester manufactured by Supplier 1 after the first test campaign, which lasted 3 years. Measurements were provided for this type of arrester because their numbers were sufficiently large (165 in total) so as to be able to draw conclusions about expected resistive leakage current. During testing, it was noted that measurements obtained on the middle phase (‘4’) were 10% to 40% lower than the results obtained on the outer phases (‘0’ and ‘8’). Results obtained for this type of arrester are therefore shown in two different Figures.
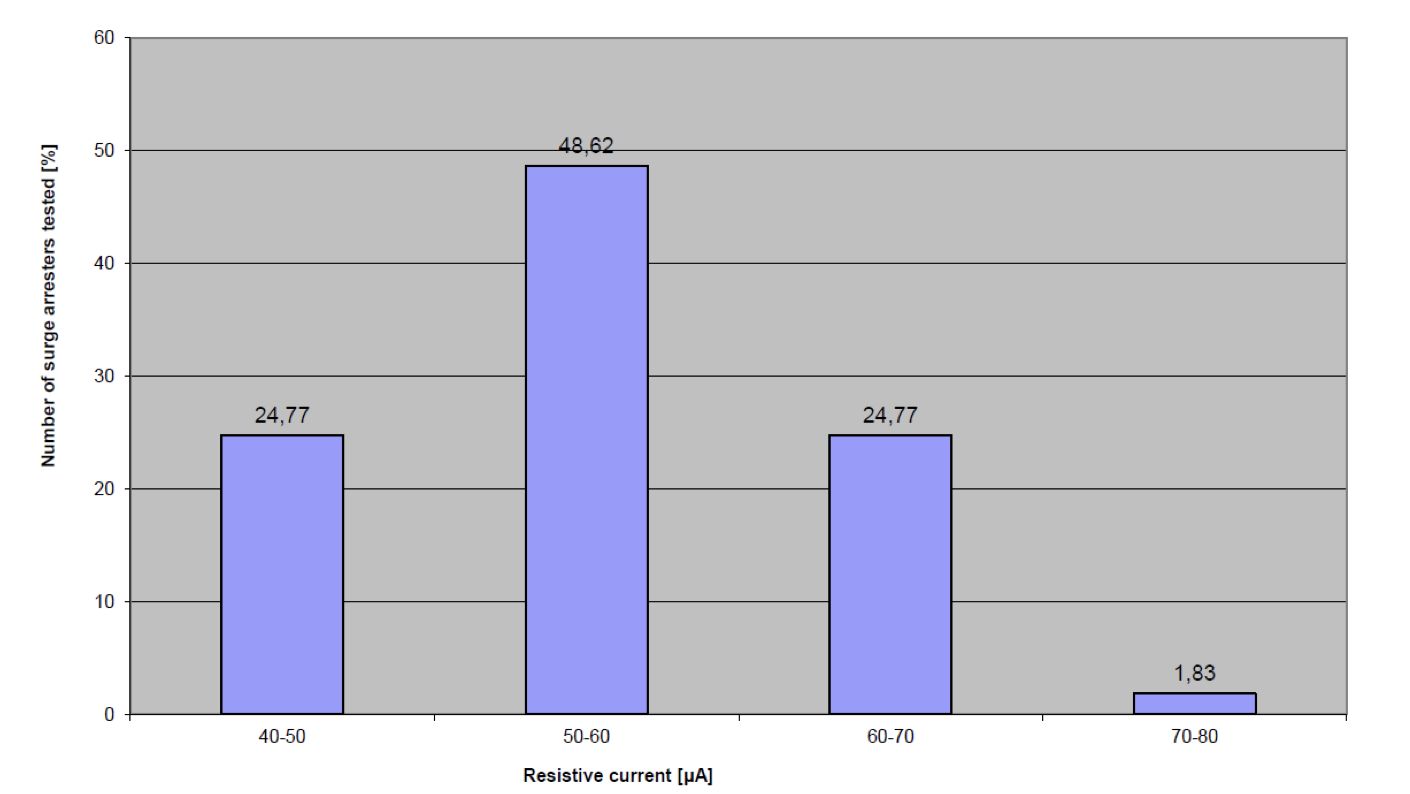
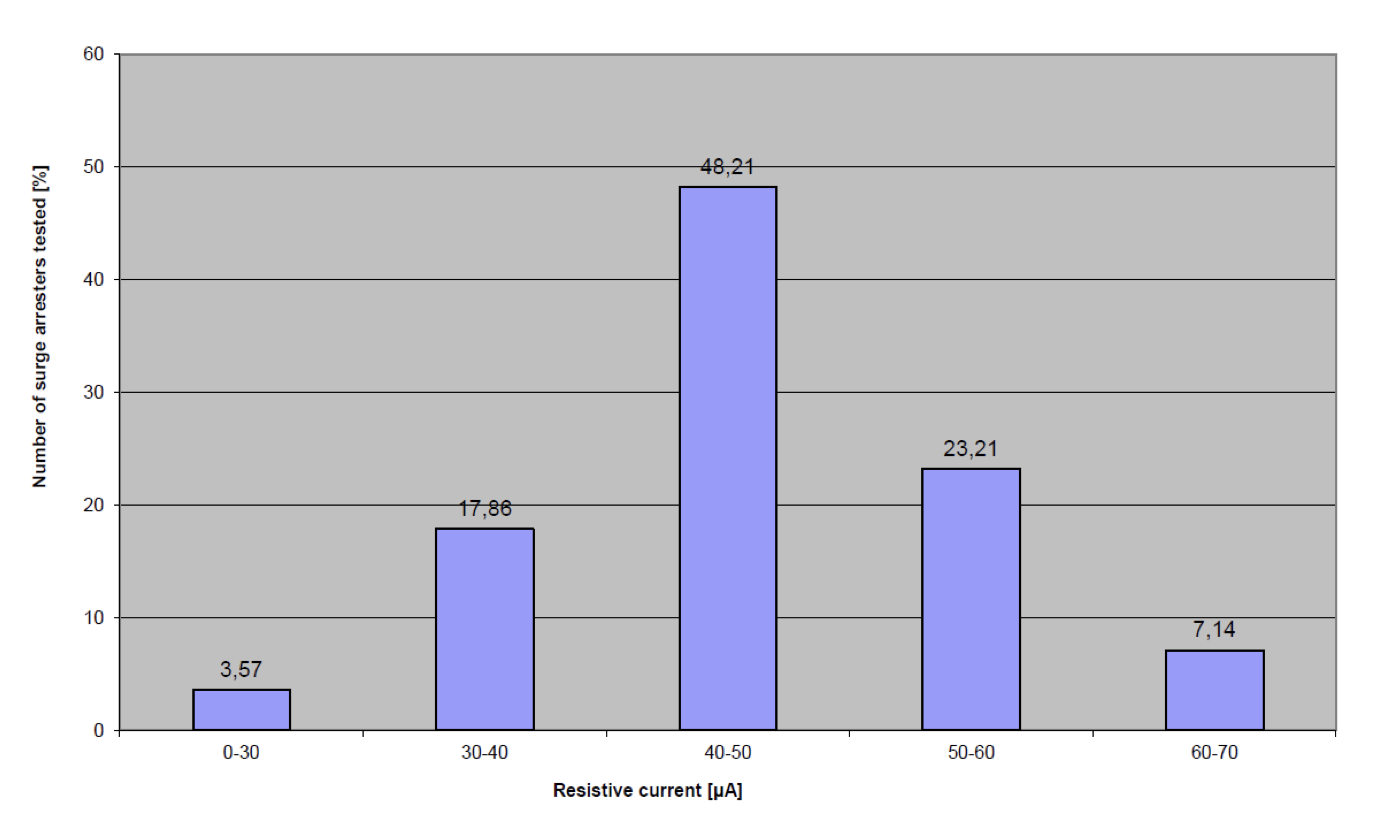
Fig. 3 shows that expected resistive leakage current for Supplier 1 arresters of a specific type installed in phases ‘0’ and ‘8’ is between 50 mA and 60 mA. while Fig. 4 shows that expected resistive leakage current for the same model of arresters installed in phase ‘4’ falls in the range of 40 mA to 50 mA. (Similar testing was performed on arresters from other manufacturers but their number was not sufficient to be able to draw conclusions about expected values.) After the initial campaign, subsequent testing of the MO arresters was conducted in cycles of every 3 years. For example, Figs. 5 and 6 provide results from testing these same arresters at the end of 2014.
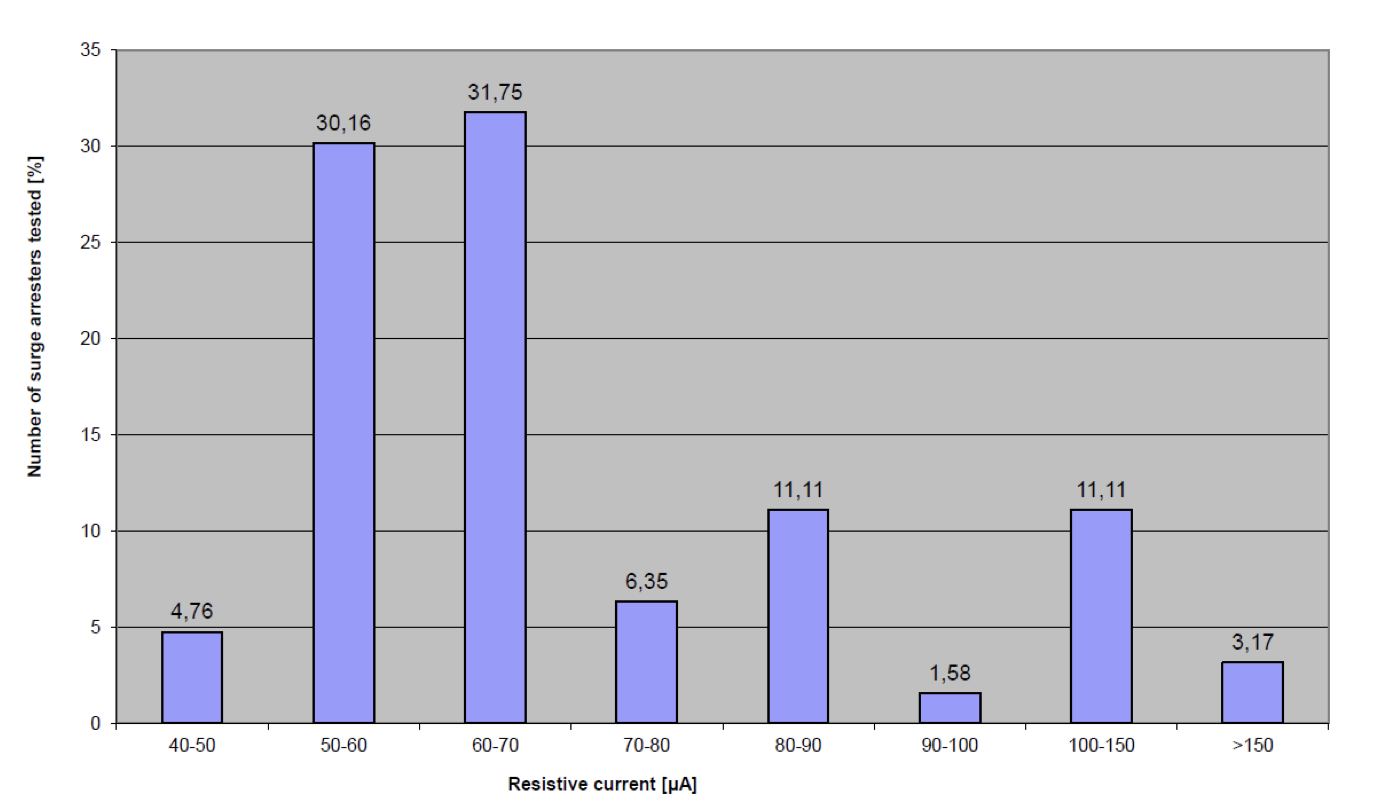
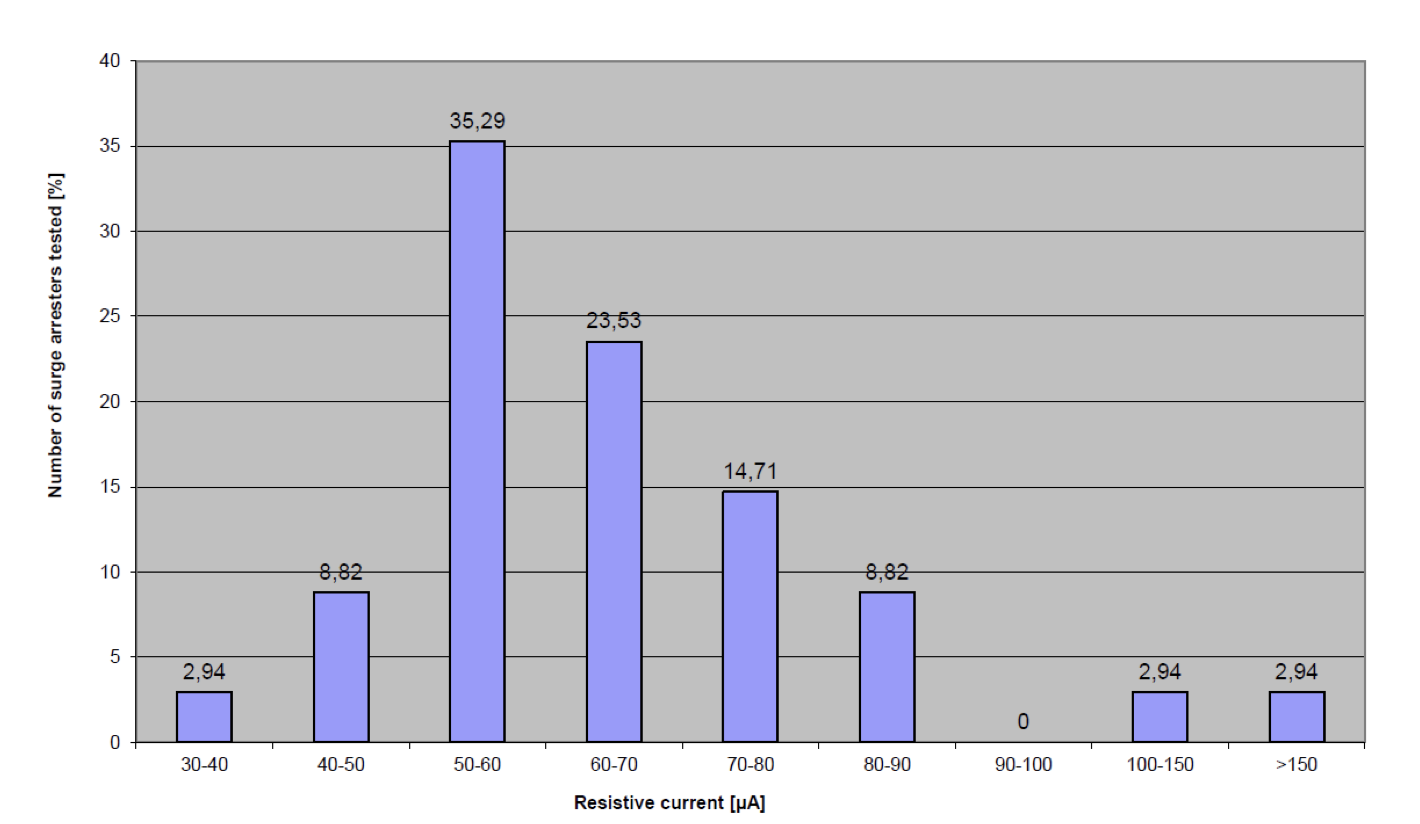
Results from the campaign of testing at the time showed an increase in resistive leakage current for most arresters. For those units where resistive leakage current increased by more than twice its expected value, subsequent test cycle interval was reduced from once every 3 years to once a year and the condition of these arresters was constantly monitored. Out of the total population of arresters tested over the period from 2001 to 2014, only 3 units were removed from service because their resistive leakage current was found to be significantly higher than expected.
Cases with Significant Increase in Resistive Leakage Current
During routine testing of two MO arresters installed in 110 kV transformer bays at different substations, it was discovered that resistive leakage current for each was over 10 times higher than the expected value. In both cases, in addition to testing these arresters, tests were also conducted on the current transformers (CT) by measuring insulation resistance, capacity and dielectric dissipation factor (tgδ). There was also analysis of dissolved gases in oil samples. Based on this investigation, significant weakening in their insulation was discovered and both CTs were taken out of service. Consequently, it was decided to also test the circuit breakers (single pole driving mechanism type) in these same 110 kV transformer bays. In the first case, testing showed that during the closing operation, one pole lagged the first by 260 ms while in the second case one pole was lagging the first by 140 ms. This happened to be the same pole where the increase in resistive leakage current was measured. Based on this, it was concluded that the reason for the increased resistive leakage current and the related weakening in insulation properties of both the arresters and the CTs was the appearance of overvoltages caused by the breaker poles lagging during switching operations on the unloaded transformer. Fig. 7 depicts simulation results (using EMTP software) of switching operation of unloaded transformer where breaker pole ‘a’ is closed at zero voltage (15 ms from the start of simulation). The other two breaker poles remain open until the end of simulation.
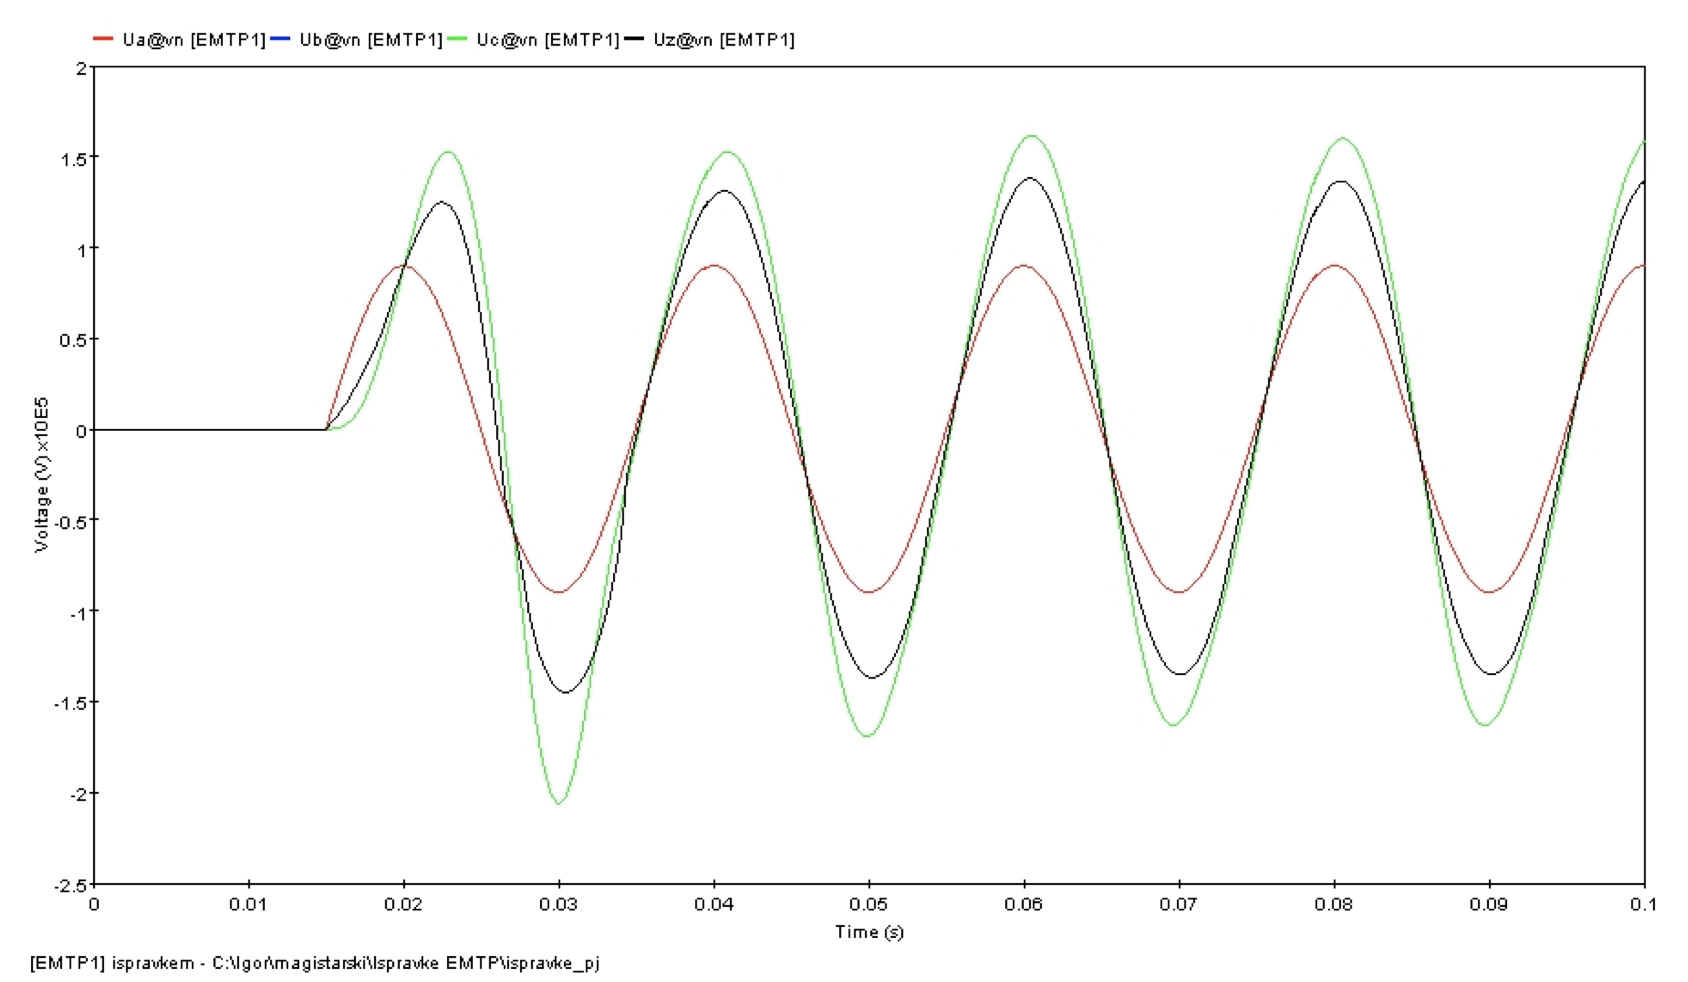
Closing breaker pole ‘a’ at zero voltage causes emergence of an overvoltage in the first cycle about 8 ms after switching and this overvoltage reaches a peak of about 160 kV. In the following voltage, maximum peak value rises to about 220 kV before decreasing again to about 160 kV. Due to its magnitude and frequency, the voltage in these two phases could be termed a temporary overvoltage of industrial frequency (50 Hz) and the reason for its emergence is the phenomenon of resonance between the inductance and the capacitance of the power transformer. Since the inductance of the transformer’s magnetizing branch is non-linear, this phenomenon is referred to as ferroresonance. From the literature, ferroresonance is caused by circuit breakers poles lagging during switching operations on an unloaded transformer and can occur on transformers with delta connected as well as star connected primary windings, where the primary side is isolated. It can also occur on a transformer with star connected primary windings where the primary side is grounded directly.
Power transformer ferroresonance can also occur when one phase of a power cable or transmission line supplying a low-loaded power transformer is opened. Overvoltages caused by ferroresonance on a power transformer can reach a peak that exceeds several times the peak nominal voltage (depending on network parameters) and can prove fatal to the insulation of apparatus in the transformer bay (i.e. breakers, CTs and arresters) and also to the insulation of the power transformer itself. MO surge arresters are especially susceptible to this type of overvoltage. This is because, in the case of a long duration overvoltage caused by ferroresonance on the power transformer, an arrester may not be able to dissipate all the accumulating energy. This will lead to deterioration in its insulation and possibly even thermal failure. Fig. 8 shows the results of a simulation of a closing operation on an unloaded transformer where breaker pole ‘a’ is closed at zero voltage and then poles ‘b’ and ‘c’ are closed at voltage maximum (after 15 ms).
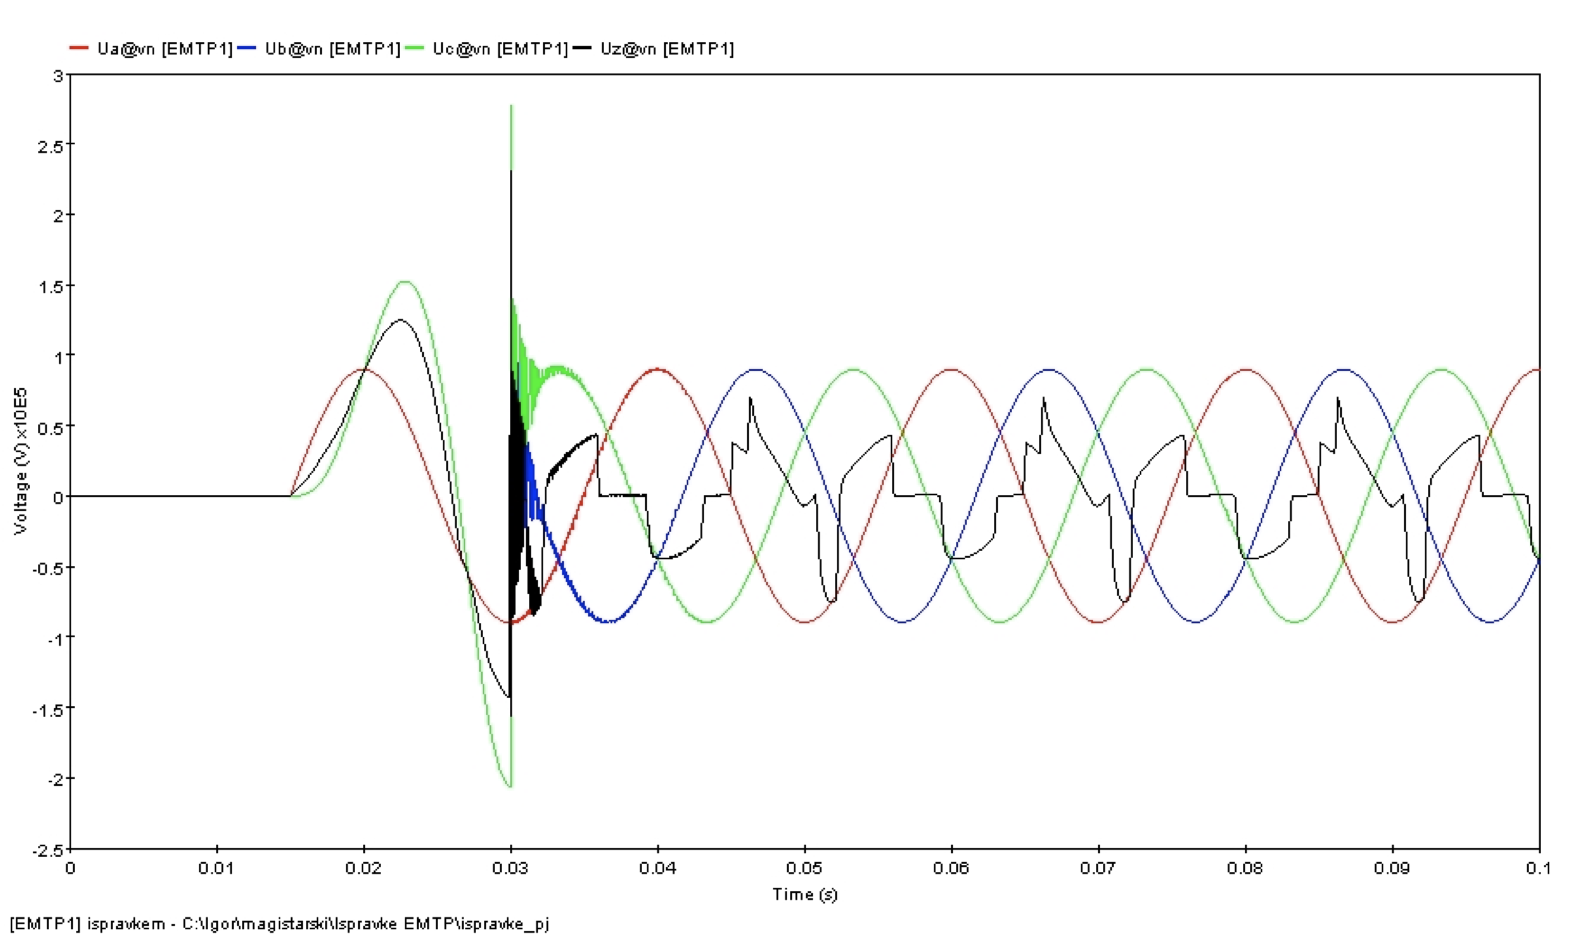
Simulation results showed that after emergence of a temporary overvoltage of industrial frequency (caused by ferroresonance on the power transformer at the moment of closing two poles that are lagging the first) another overvoltage occurs with a very steep increase in wave front – in the range of µs. The peak value of this overvoltage reached 270 kV and it is even possible to encounter a very steep change in voltage during energization of around 500 kV.
The important conclusion is that when two phases are lagging during closing operation of a breaker, two types of overvoltage can emerge:
1. overvoltage of industrial frequency caused by ferroresonance on the power transformer; and
2. switching overvoltage, with steep rise to peak values after the closing of the two circuit breaker poles that were lagging.
The effect of these two overvoltages can prove devastating for the insulation of apparatus installed in a transformer bay.
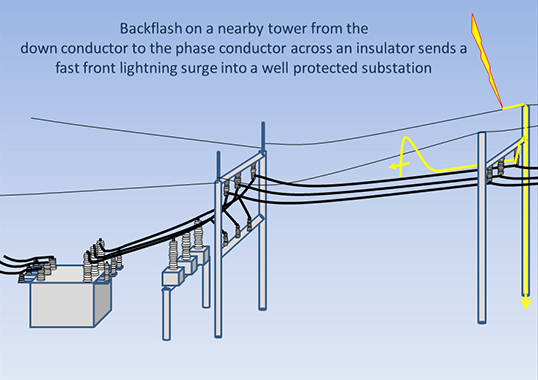
The third case where an arrester was found to have a resistive leakage current 10 times higher than the expected value was found to have been due to a much different cause. Here, a surge counter installed on the arrester registered about 70 surges over 10 years since the arrester had been installed in a substation where lightning surges are frequent during summer. In this case, the large number of lightning discharges caused the increase in resistive leakage current.
Conclusions
Due to the key role they play in power systems, MO arresters have become an important factor that affects reliability. It is therefore necessary to monitor them to determine their condition and this can be done by measurement of resistive leakage current. This method is one of the most reliable diagnostic techniques to evaluate whether there has been deterioration in their insulating properties. Using the method of 3rd harmonic with compensation for resistive leakage current measurement, risk of errors due to the presence of harmonics in the network voltage can be eliminated.
Initial measurements carried out over the first 3 years of this particular testing campaign confirmed expected values of resistive leakage current for the type of arrester used widely in the transmission network. At the same time, considerable experience was gained testing, establishing limit values for arresters in good condition and also setting specific assessment criteria. All this created favorable conditions for future condition monitoring of surge arresters in service.
Results from this particular testing campaign showed that there had been an increase in resistive leakage current, which was expected given the age of the arresters by the end of 2014. For those arresters where resistive leakage current increased to more than twice the expected value, subsequent testing cycle interval was reduced to only once a year. Results of this program confirmed that metal-oxide surge arresters are an extremely reliable element in a power system. This is demonstrated by the fact that, during 13 years of monitoring, only 3 units had to be removed from service due to extremely high resistive leakage current. In all cases, this had been the result of long-term exposure to overvoltages.
[inline_ad_block]

