Pollution flashovers of insulator strings have been one of the main causes of line outages under normal operating conditions. In fact, this was a relatively common occurrence years ago across many countries suffering from heavy industrial pollution. The situation began to improve over the past two decades and the main pollution sources impacting overhead lines these days have become mostly natural – either of the marine or desert type. While industrial pollution remains a problem in some developing countries, it typically impacts sections of lines closest to heavy industry. Fortunately, there is already a vast body of international experience on polluted insulators. Therefore, it is fair to say that the problem of pollution and its impact on line insulators is well understood as are the measures by which it can be combated.
Bird-induced line outages have also become more and more an issue in recent years. However, as is the case of pollution, there is now quite a body of knowledge on how these can best be minimized.
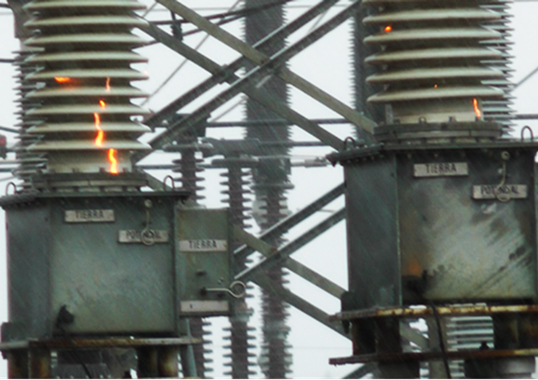
By contrast, there seem a high proportion of outages that cannot easily be attributed to either pollution or birds – or indeed any specific cause. One can describe the same typical scenario for these outages, including affecting clean or only lightly polluted insulators and occurring most often in the early morning, in the presence of dew. Similarly, these outages tend to be single phase rather than three-phase with no evidence of pollution during visual inspection after successful re-closing.
This edited past contribution to INMR by Igor Gutman in Sweden, E. Solomonik in Russia and Wallace Vosloo in South Africa looked to share experience on this category of outage commonly referred to as due to ‘unknown causes’. By all accounts their percentage has been relatively high, as for example in Russia where they once made up some 30% of all line outages at 220 kV and 500 kV. Resolving such unexplained outages is increasingly important as power companies the world over try to establish norms on acceptable levels of outages at each voltage class. To accomplish this, however, they need to better understand what is really be happening to insulators on their lines.
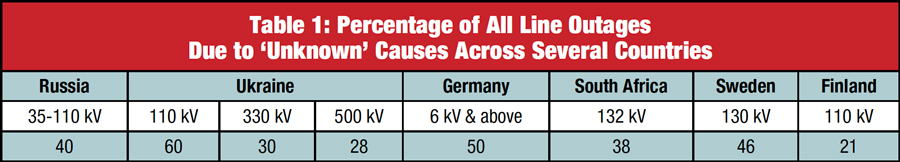
Table 1 below summarizes the unusually high level of outages due to flashover that cannot be directly attributed to either pollution or birds. Depending on country and voltage class, these often represent the single major cause of service interruptions.
Nordic Experience
Renewed interest in this area began a decade ago in Sweden with the unexpected flashover of a porcelain support insulator on the test transformer at a high voltage hall in Ludvika. The affected insulator’s specific creepage distance was 8 mm/kV while relative humidity (RH) at the time was about 80%. This same phenomenon was later successfully simulated during a laboratory test, where high humidity was created in the vicinity of the insulator’s ‘foot’ (i.e. the support insulator) using a continuous spray of water but with no direct spraying to its surface. As such, the presence of water on the insulator could not be visually observed and wetting would rather take place only at the microscopic level. Under these test conditions, flashover occurred at 400 kV, which correlated well with this previous incident. To gain more insight into the problem, the insulator’s E-field profile was measured using special probe at both 100 and 200 kV (see Fig. 1).
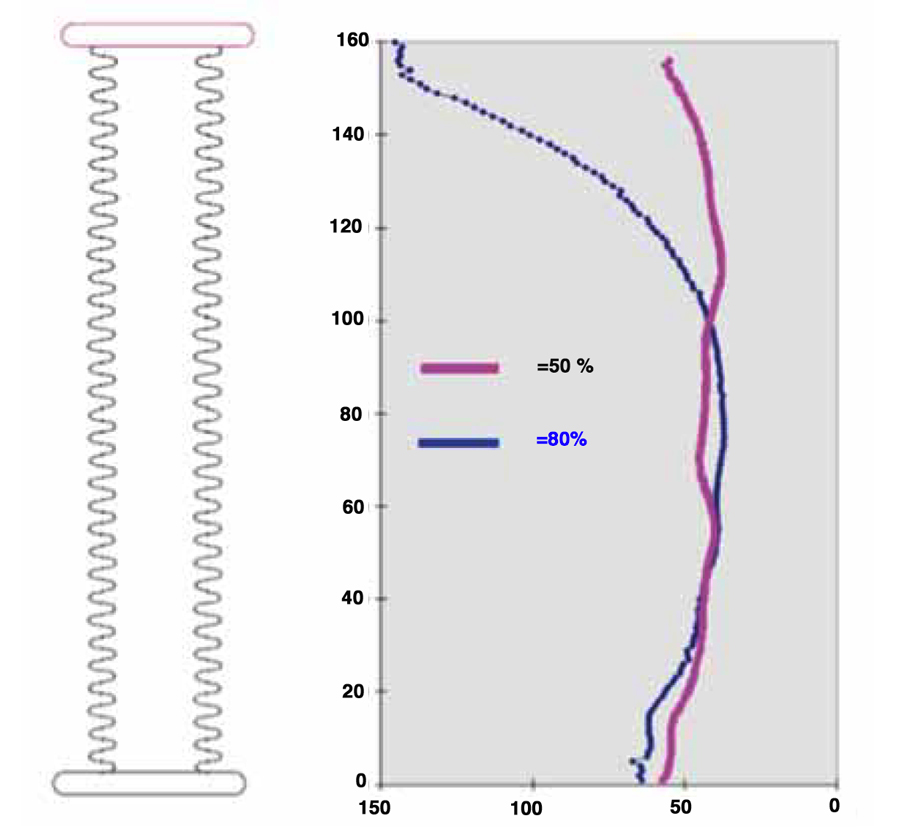
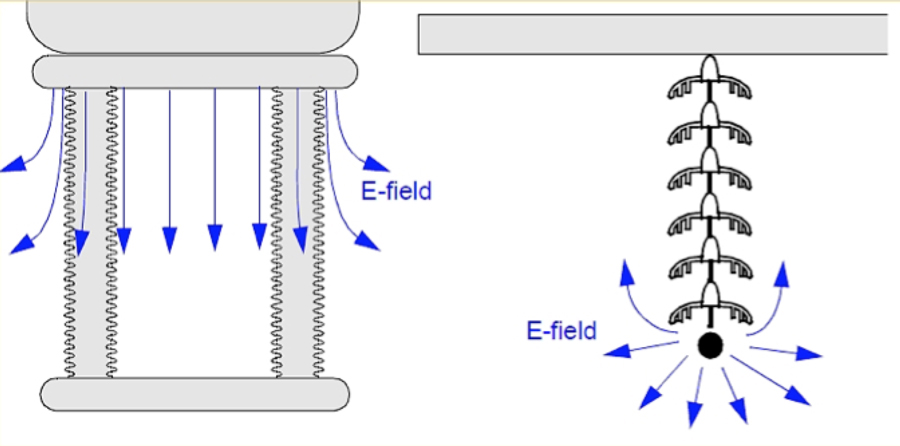
It is obvious that at 80% RH the electrical field stress is concentrated near the top of the support insulator. Higher temperature was also observed here, indicating that moisture was evaporating due to the presence of small leakage currents. Later, a leader-type discharge was initiated, effectively short-circuiting this section of the insulator and resulting in the 400 kV flashover. Asimilar outcome, however, could not be simulated on strings of glass cap & pin insulators and a possible explanation is their different E-field orientation, i.e. not along the insulator (see Fig. 2).
With these considerations in mind, service data began to be collected on several 110 kV to 130 kV overhead lines in Sweden and Finland covering several years. Below are some of the main findings that seem to always apply to outages attributed to ’unknown’ causes:
• These usually take place in areas of very light contamination, i.e. ESDD/NSDD of only 0.01/0.06 mg/cm2
• Outages tend to coincide with an average RH of 91%
• The affected glass cap & pin insulators all have an insulation level of 11-12 mm/kV.
Fingrid, the transmission network operator in Finland, conducted their own investigation into these outages and concluded that light pollution was the best explanation. This is because data from pollution monitoring confirmed that such ’unknown’ faults generally took place when leakage currents were highest – which also correlated with periods of high humidity. Most of the outages, in fact, occurred during the early morning hours, while some of the flashed over insulators were located close to highways. Indeed, pollution tests of insulator strings in the laboratory revealed that, for ESDD levels comparable to those seen in service, flashovers were recorded at only 87 kV (for 110 kV strings). This meant that the safety factor between the test voltage and the maximum operating voltage was only 1.2 and suggested that Finngrid should avoid relying on only six standard profile insulators for its 110 kV lines.

Summary of Nordic Experience
Outages attributed to unknown causes have typically taken place in Nordic countries on short, slightly contaminated glass insulator strings (11-12 mm/kV) during conditions of high humidity. The theory of re-distribution of the normal E-field profile along the insulator due to the presence of a thin layer of moisture was clearly confirmed for porcelain support insulators, but less convincingly so for cap & pin insulators. As a countermeasure, affected lines were eventually refurbished with either longer strings or with silicone rubber insulators.
Russian Experience
One of the very first detailed analyses of service experience involving the practical application of statistical methods for insulator dimensioning was published in a Russian magazine in 1968. As part of this work, the authors collected service experience on outages affecting 110 kV overhead lines located in the southern part of the country. General findings were as follows:
• Affected service areas had only very light contamination
• 15 to 30% of outages were classified as due to ’unknown’ causes
• The great majority of outages coincided with relative humidities of over 85%
• Flashed over porcelain cap & pin insulators had an insulation level 12 mm/kV. Since some 10% of strings were found to contain punctured discs, the effective insulation level for these strings was only 11 mm/kV.
Similar experience was collected in Ukraine at about the same time and again involved areas with only light contamination but with numerous outages whose cause was listed as ’unknown’ (e.g. 50 to 60 per year). Moreover, exactly as in the cases discussed above, these outages took place during the early morning and close to bodies of water. Flashed over porcelain cap & pin insulators had a design insulation of 12 mm/kV and, given the presence of punctured insulators, an effective insulation level of 11 mm/kV.
During the 1980s, a research project on service problems at 110 kV was conducted in the Kaliningrad region of western Russia and yielded the following findings:
• These were very lightly contaminated areas, with average ESDD levels of only0.02 mg/cm2
• More than 90% of such outages were restored with automatic reclosure
• 90% of outages were of ’unknown’ causes and 60% correlated with the presence of dew, fog or light rain.
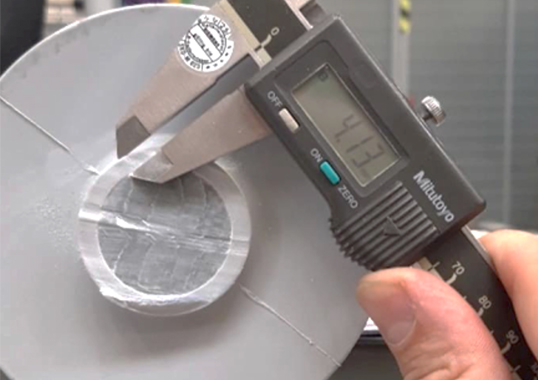
• Several old porcelain insulators were removed after 50 to 60 years of service and typically 1 or 2 discs in the 7 unit string would be punctured. This meant that the effective insulation level was at the ’critical’ level of 11 mm/kV.

Summary of Russian/Soviet Experience
Outages due to unknown causes occurred in the former Soviet Union on very short cap & pin insulator strings (11-12 mm/kV) during conditions of high humidity and where the insulators were only slightly contaminated. While the exact mechanism was not fully investigated, it was believed that for such flashovers to have occurred, the insulators must have been electrically stressed beyond their limit.
South African Experience
Service experience with ’unknown’ outages in South Africa is similar to that described above and well-represented by examining the history of the Hydra-Ruigtevallei line – originally run at 132 kV with very low load at night. A second line was subsequently built in parallel with the first line and both operated at 220 kV to achieve higher, more cost effective load transfer during peak hours. Load during the night for the two lines, however, remained very low. The pollution environment of the lines is generally light and birds are known to be present, sometimes nesting in certain towers.
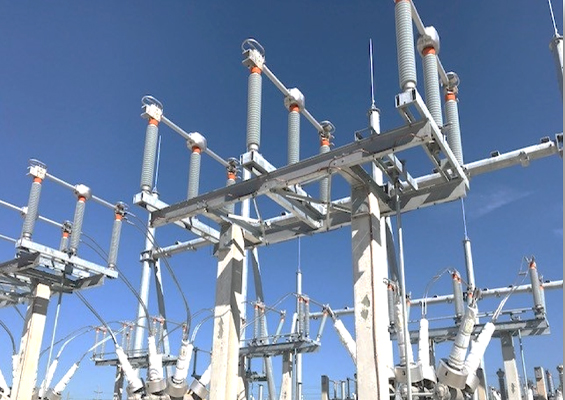
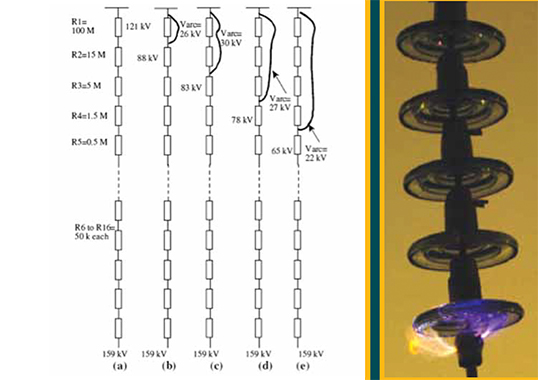
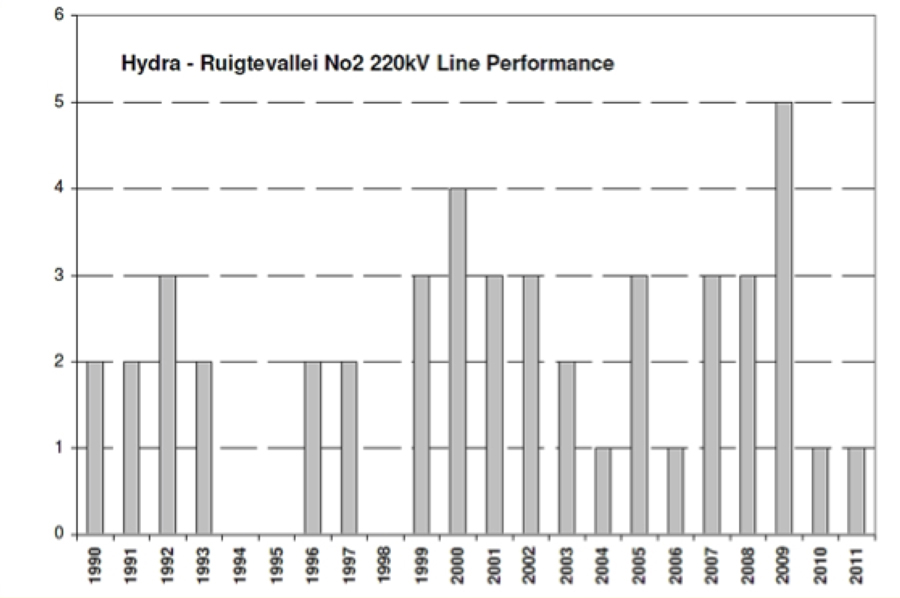
The new line was insulated at 16.0 mm/kV and performed as expected (see Fig. 3).
By contrast, the No. 1 line, with its original insulation level maintained at 11.4 mm/kV in all phases, had an unacceptable outage performance (see Fig. 4).
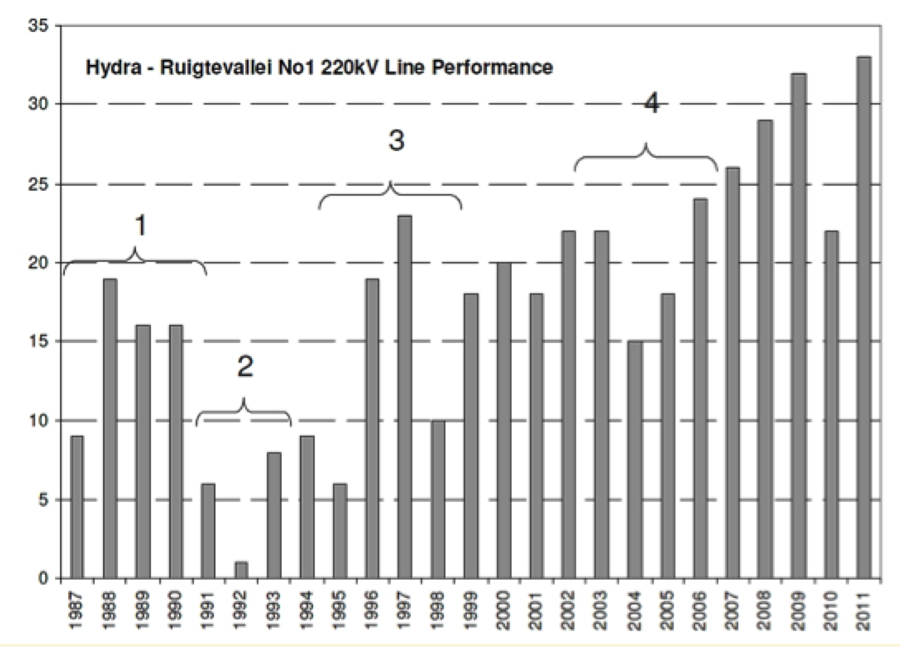
1-operated at 220 kV (11.4 mm/kV);
2-operated at 132 kV (19.3 mm/kV);
3-operated at 220 kV (15.1 mm/kV);
4-operated at 220 kV (17.3 mm/kV).
During 1991 to 1993, the voltage on the No. 1 line was reduced to the original 132 kV and, not surprisingly, service performance improved dramatically. Then, in 1994, two extra U120BS/20 disks were added on the outer phases on suspension towers bringing them to 13.7 mm/kV, while the centre phase was left with only ten such disks (i.e. 11.4 mm/kV). Voltage was then restored to 220 kV and line performance deteriorated to again being unacceptable.
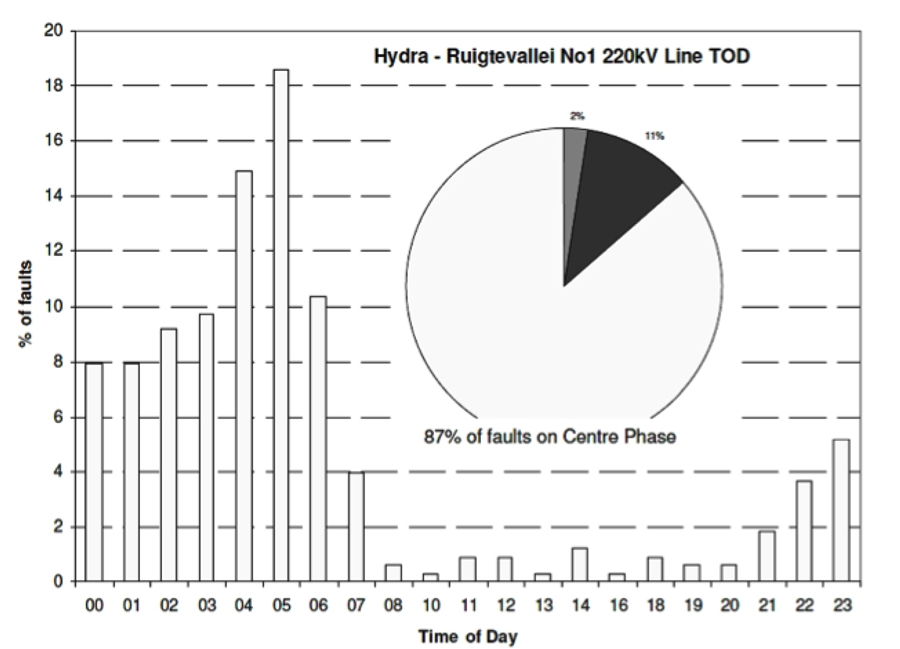
In 2001 bird guards were installed on all the towers of the No. 1 line but no significant improvement in line performance resulted. Therefore, the following year, two fog type F120P/146 disk insulators were added on all phases of this line, bringing the insulation level of the centre phase to 15.1 mm/kV and the outer phases to 17.3 mm/kV. Yet no improvement in performance was observed and in fact it became worse, with almost all outages taking place on the middle phase (see Figure 5). During 2004, additional bird guards were added but had no effect on performance.
The key issue for Eskom engineers became to understand why the centre phase with its 10 x U120BS/20 standard type disks and 2 x F120P/146 fog type discs was flashing over at a specific creepage distance of 15.1 mm/kV. After due analysis, the following hypothesis emerged: Studying the data in Fig. 5, it was proposed that the real problem was not related to birds but rather to pollution. Such a conclusion was supported by the fact that there was no peak of outages at 22:00, as is typical for bird-induced outages in South Africa where birds typically excrete while landing for their night rest. Moreover, all towers were already being protected by bird guards.
In addition, the outer phases had been performing well even at an insulation level of 13.7 mm/kV before the extra two fog type discs were installed. By contrast, the centre phase which was originally insulated at 11.4 mm/kV and then had two extra fog type discs to bring this to 15.1 mm/kV was still flashing over. This seemed to prove that the two extra discs were not working.

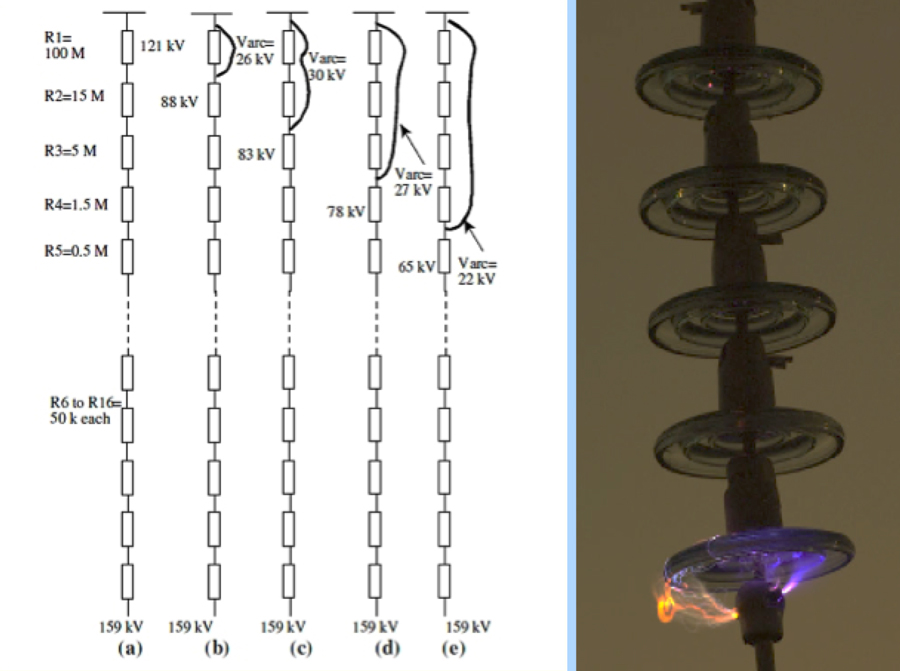
To explore what might be happening, a concept was presented schematically applying to a 275 kV glass cap & pin string (see Figure 6). If the top 10 discs of such a string are wetted while the bottom two fog type discs remain partially dry, the earth potential transfers down the string and becomes applied mainly over the bottom two discs. These flash over and cause a wet switch on the remaining discs, which are insulated at only 11.4 mm/kV. This then results in flashover of the whole string. In effect, worse performance results with the additional two discs as they impede normal dry band formation on the top disks. Thus, the wet switch on condition.
The dry power frequency withstand voltage of two F120P/146 discs is, by simple estimation, 140 kV while their wet withstand voltage is 85 kV. Bearing in mind that the top portion of these two discs is most likely wet and that the line-to-ground voltage is at least 142 kV, there is a high probability that the two discs will flashover. Indeed, flashover marks observed at the bottom of these disks only confirm such a conclusion.
Most of the outages discussed in the scenario described above have taken place on the middle (centre) phase. Quite interestingly, the same is also true for 275 kV and 400 kV lines in South Africa affected by outages attributed to ’unknown causes’. Moreover, some of the outages on 330 kV overhead lines in Russia have apparently taken place exactly in the same manner as in South Africa, i.e. on the V-string in the middle phase only. The middle phase is already 10-15% more electrically stressed than the outer phases. Therefore, in the case of already over-stressed insulators, any slight additional increase in E-field stress might prove critical.
Summary of South African Experience
It appears feasible that, in addition to classical dry-band pollution flashover, a type of air breakdown might be occurring, especially on light, non-uniformly polluted and electrically over-stressed insulators. The proposed mechanism relies on the fact that the disc having the highest resistance will experience the highest voltage. In other words, if the system line-to-ground voltage exceeds the flashover voltage of the one to three discs (depending on the line’s voltage class), it may be possible that these discs will flash over and the voltage transfer to the remaining discs.
Under normal service conditions, the insulators are continuously energized and it is expected that the occurrence of any sudden wetting could trigger this type of flashover mechanism. In this regard, it is also not a good idea to combine insulators of different profiles in the same string since this can lead to higher non-uniformity of pollution and thus higher non-uniformity of E-field distribution.

Conclusions
If one is trying to analyze specific cases of line outages attributed to ‘unknown’ causes, there is perhaps a tendency to search too quickly for the presence of strange phenomena, e.g. sudden sun activity with reduction of electrical strength of the air gap or strange swamp gases which interact with moisture and create electrolytes on insulator surfaces yet leave no trace behind after flashover.
However, when reviewing service experience, it seems clear (even if not well simulated in the laboratory and fully confirmed) that the real explanation lies in some type of unexpectedly high and changed electric stress profile along the insulator due to a high level of moistening of the surface due to morning dew or fog. This, in turn, can lead to flashover of one, two, or even three discs followed soon after by a complete flashover of the string. It is important to note that this process is quite different and should be distinguished from the better-known mechanism of flashover on polluted insulator surfaces that starts with dry band activity.
The above, however, has only been a proposed hypothesis and full-scale tests with representative artificial wetting or video monitoring of lines would be necessary to confirm it. Electricity supply companies faced with poorly performing lines due to flashovers of unknown cause are perhaps best advised to rely on silicone rubber insulators to quickly resolve the problem.