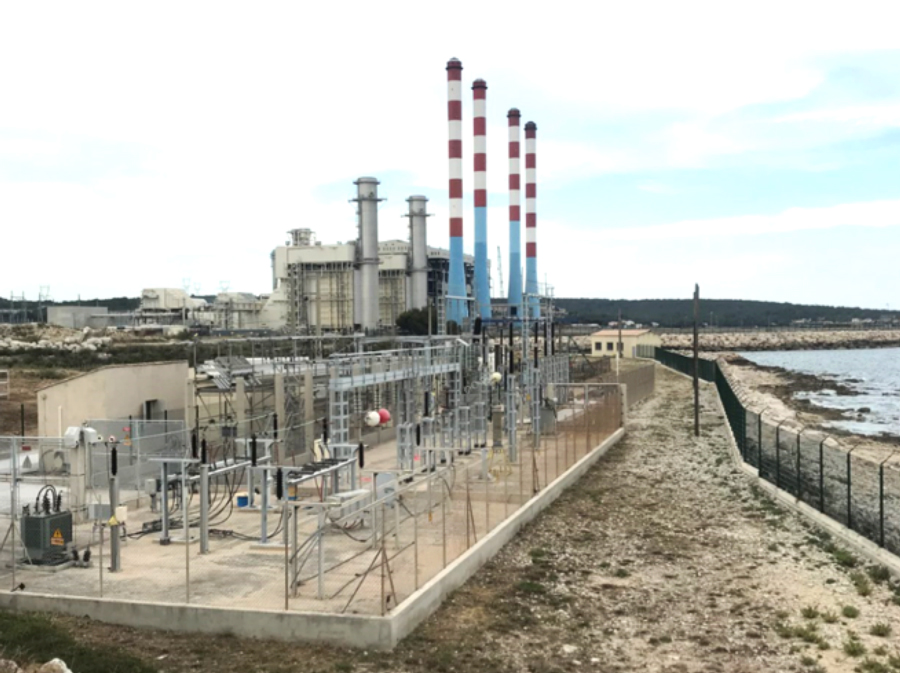
Electricité de France (EDF) first set up a test facility for electrical equipment in the south of the country during the late 1960s. Located alongside the seacoast and near large petrochemical plants, the purpose of this facility was to study behaviour and limits of insulators under harsh service conditions. The site’s capacity and voltage levels expanded over the years due to growing interest in assessing the impact of pollution on insulator performance. Today, the Martigues Test Station is regarded as one of the most important of its type based on number of samples under test as well as available voltage levels. This edited contribution to INMR by Christian Pons of EDF’s Networks Lab offers an overview of the site’s assessment tools to monitor performance of grid components in an aggressive, high pollution environment.
Listen to Online Lecture on Operating a Test Station in a Polluted Environment by Christian Pons
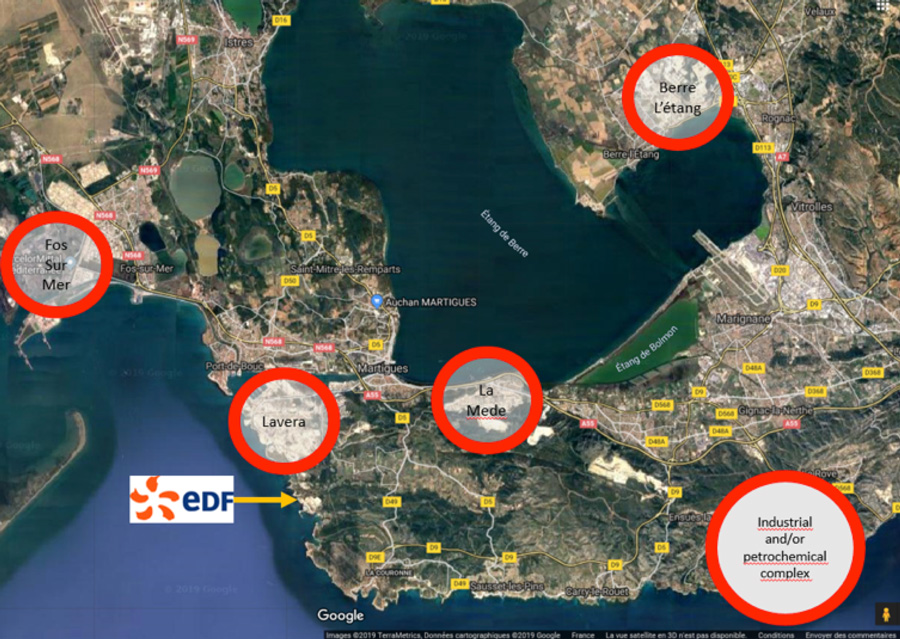
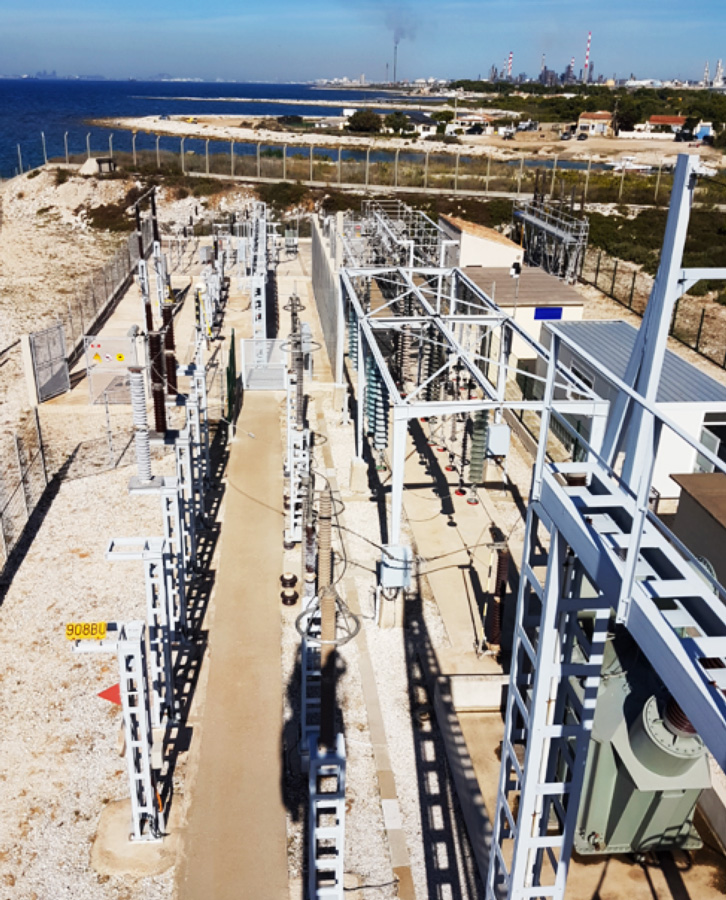
The site of the Martigues Test Station was selected since it is easily accessible and located only metres from the Mediterranean coast, meaning it is exposed to frequent salt spray. The surrounding area, known as Etang de Berre, also contains a heavy concentration of oil refineries and chemical plants (see Fig. 2).
Although industries such as these have strived for years to reduce emissions, pollutants can still reach significant levels depending on atmospheric conditions. An independent body, AtmoSud, has therefore been certified to monitor air quality and, if necessary, give guidance to local authorities to impose temporary production restrictions. Measured data is available on their website and industrial pollution is a regular topic of discussion with staff at EDF R&D. For example, an SO2 analyzer is located only meters from the test station and provides a partial picture of localized industrial pollution.
Martigues is classified ‘CSA’ according to the Köppen-Geiger scale, with a climate that is temperate and warm. The site experiences frequent sunshine, close to 3000 hours per year. July, the hottest month, sees average temperature reach 23°C while the fourth quarter is the rainiest, with an average of nearly 200 mm. December and January are the coldest months with average temperatures around 6°C. Fig. 3 shows local wind orientation at the site over a recent period.
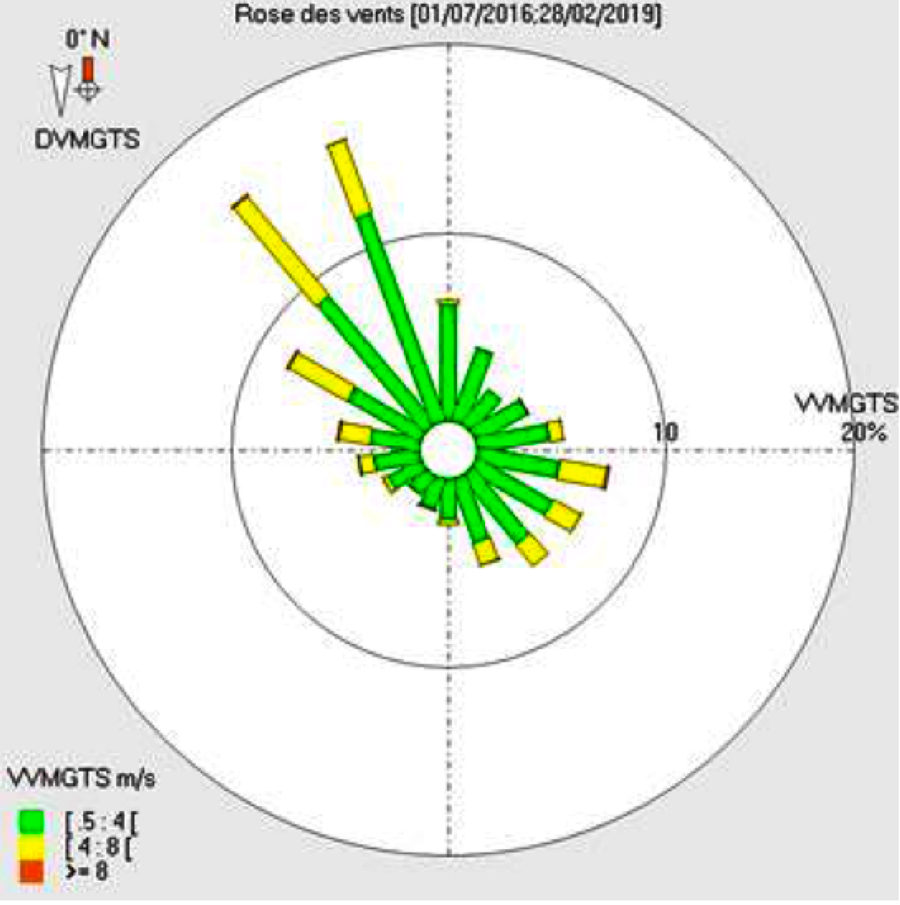
The NNW wind is called ‘Mistral’ and blows 30% of the time while a Sirocco wind occurs about once every two years. This African wind, coming from the southeast, causes a specific type of rain mixed with desert sand. The Mistral blows along the coast and places the test station under a wreath of smoke from the nearby Lavéra petrochemical complex.
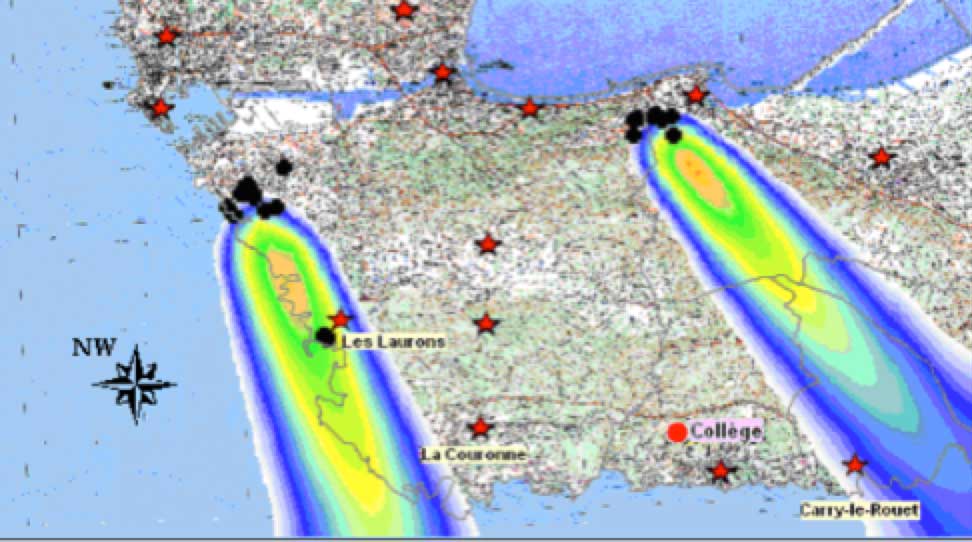
Fig. 4 offers a simulation of the distribution of the pollutant plume (SO2) during Mistral episodes. The test station is located in the most affected area based on AtmoSud data combining wind direction with pollution measurements.
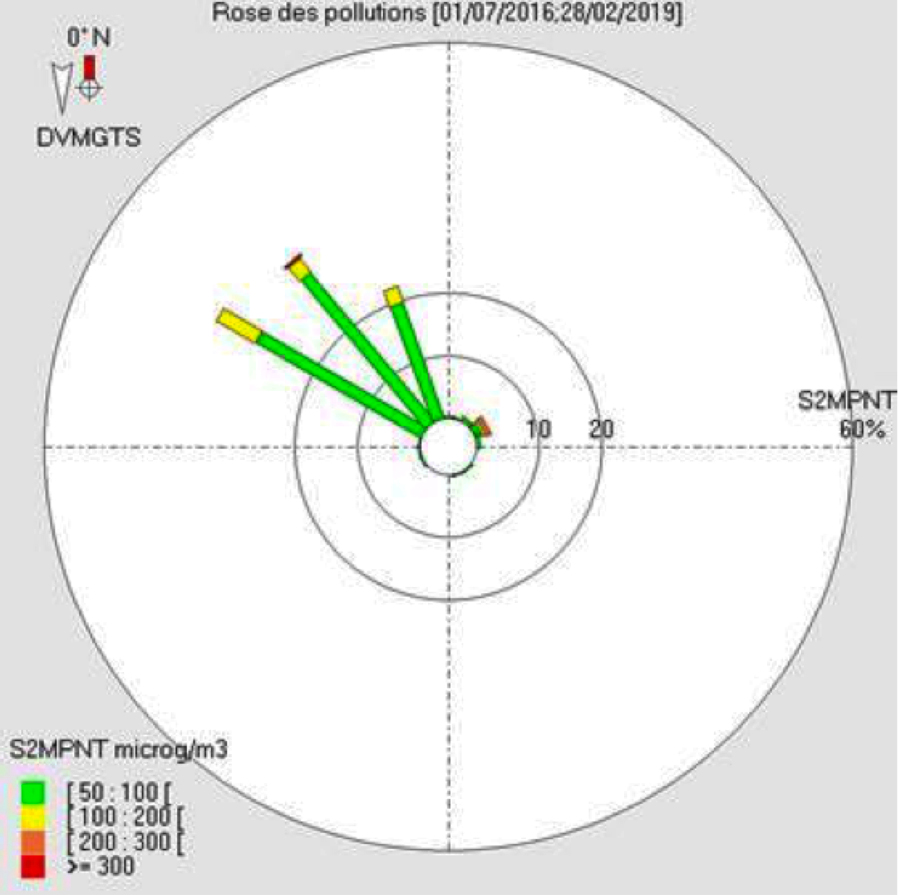

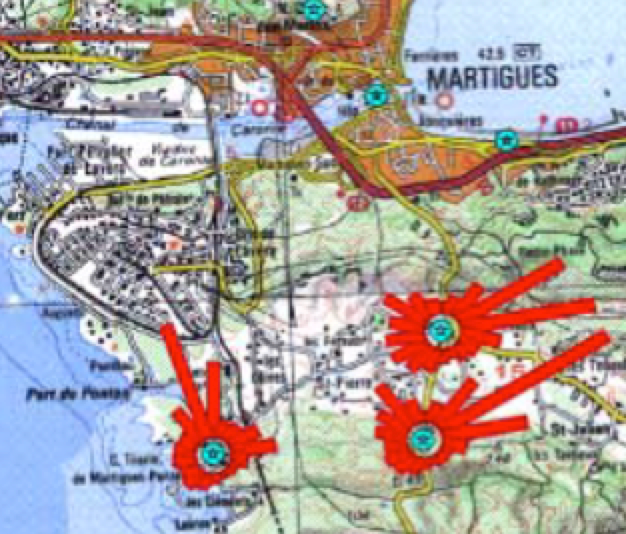
Fig. 5 indicates distribution of SO2 pollution levels in the air as a function of wind direction and shows for example that during Mistral episodes the test station is subjected to industrial pollution. Another approach is to calculate average air content of SO2 as a function of wind direction, as in Fig. 6. This illustration shows important differences in pollution level within only a relatively short distance.
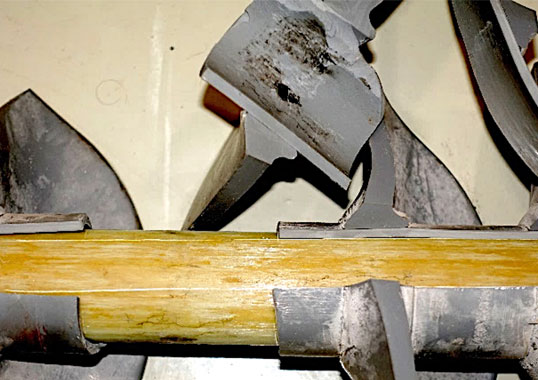
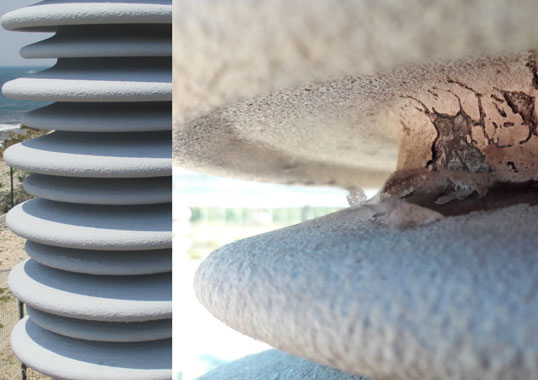
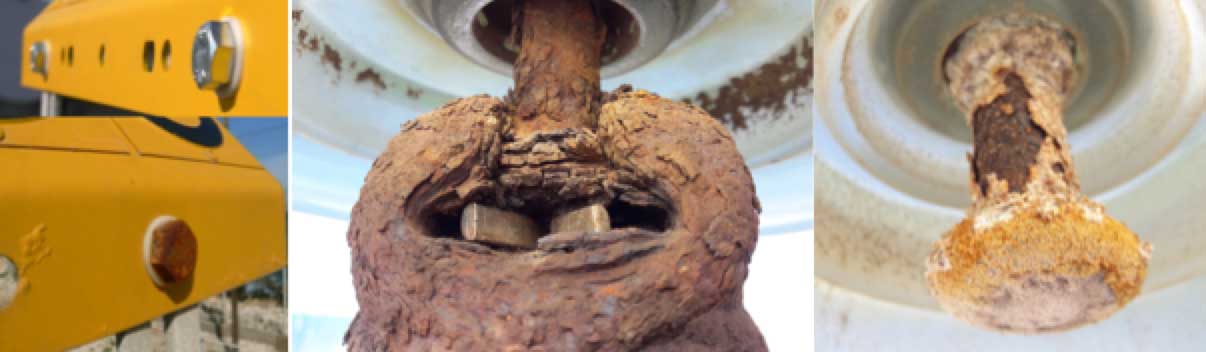
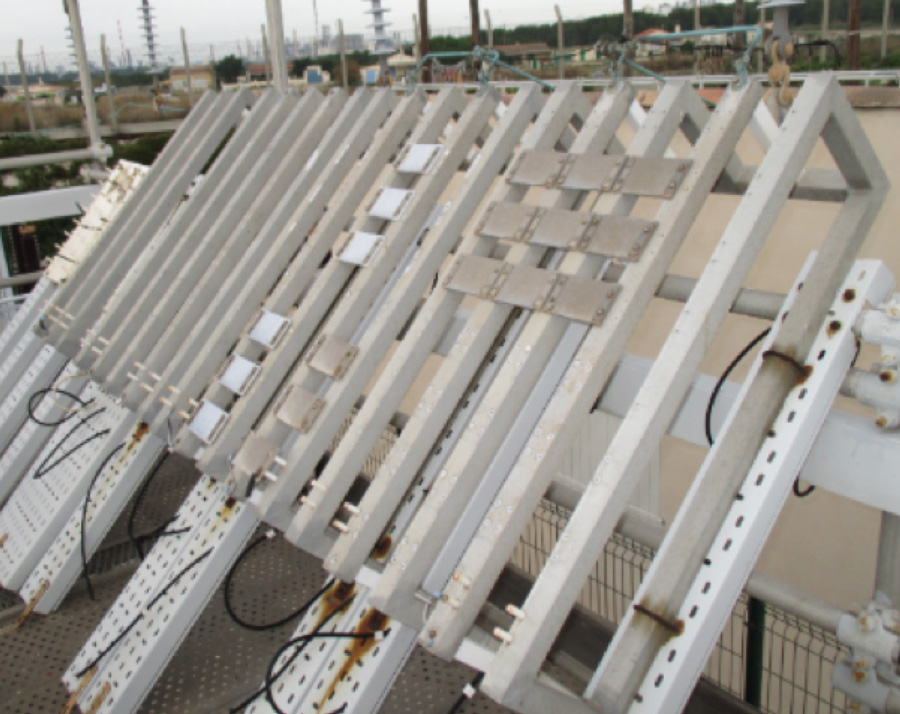
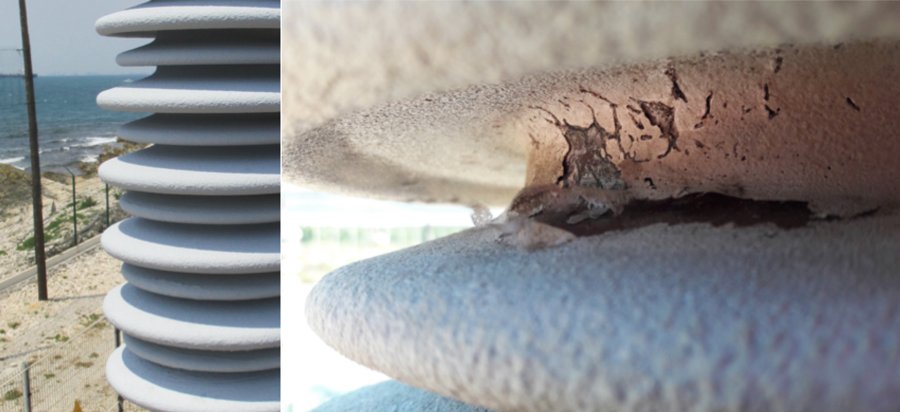
Access to data from monitoring ambient air pollution is critical when operating a test station in a polluted environment. In this case, Martigues Test Station is located exactly where the wreath of smoke from the Lavéra petrochemical industries descends. Moreover, proximity to the seashore combined with nearby sources of industrial emissions quickly leads to corrosion of metal test objects. This allows for at least a Level 4 Classification (i.e. high pollution category) according to standard NF EN ISO 14713. In fact, corrosion of fittings and hardware on components being tested is quickly evident, as shown in Fig. 7.
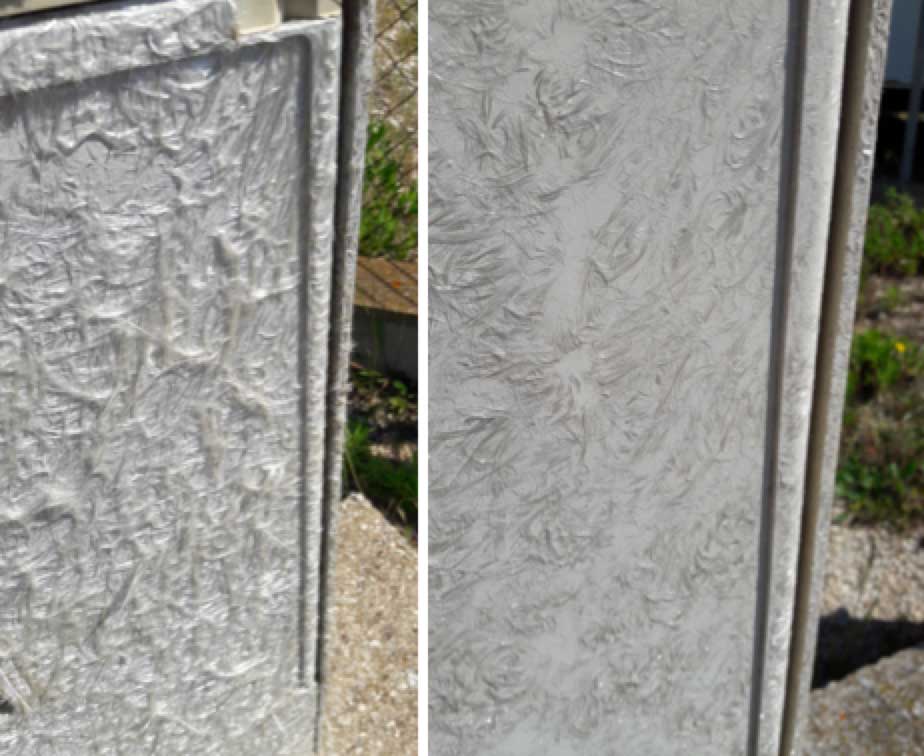
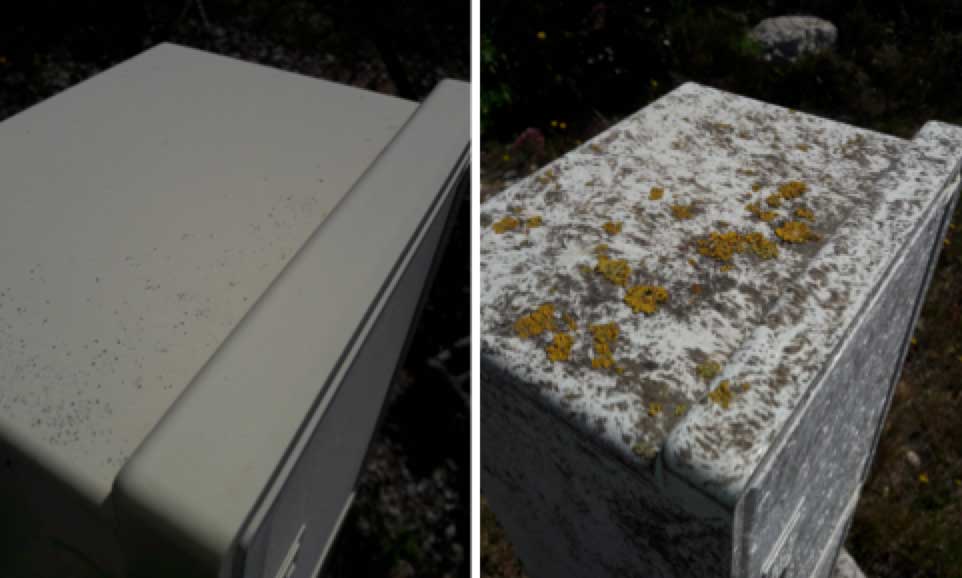
The severe environment of the test station is also useful when assessing comparative quality of items such as outdoor branch boxes. After only a few years of exposure to the local environment, manufacturing differences become obvious and severe degradation in some units can be observed after only 10 years’ exposure (see Figs. 8 & 9). While some branch boxes remain in relatively good condition, others are heavily degraded or colonized by moss and fungi. This illustrates the capacity of the site to discriminate between and select components operating under real-life service conditions. The term ‘Global Acceleration Factor’ was first defined during the 1990s. Based on observation of material degradation on the French grid and specifically in this location, a Global Acceleration Factor of 5 has been accepted for composite insulators installed at Martigues Test Station.

Electric Power Installation
The test station is powered by several levels of alternating voltage, from 13.8 kV to 245 kV phase-to-earth and several dedicated single-phase transformers are used. More than 60 devices can be tested simultaneously. A 2.2 kV-powered platform is also available to test samples of silicone wafers (Fig.11).
Operational Organization
This test facility is operated by staff from the Electrical Equipment Laboratory based at EDF Lab Les Renardières. A team made up of a Test Engineer and four technicians is in charge of operating the station and workers go to Martigues for a 4-day session every 5 weeks. There, they manage relations with external and internal clients, carry out inspections of equipment, calibrate measuring devices and collect data.
A schedule is prepared weeks in advance to coordinate the companies involved during such visits, for reasons of safety and customer confidentiality.
A digital link allows information from the local measuring station to be remotely monitored by a dedicated computer at the Renardières office.
Also, interventions can be implemented in case of special events such as exceptional weather, accidental triggers, etc. For example, a Short Message Service system is sent to operators as soon as an alarm is triggered. An automatic sequence then allows the test station to be powered again. If a defect is permanent, the affected zone is permanently switched off and local intervention by staff becomes necessary.
A maintenance team also takes action twice a year and is in charge of maintaining operating condition and development of the station’s facilities, which change each year as new tests and needs emerge. The test station is fenced off and access controlled with daily patrols by security guards.

Measurement Capabilities
As a research station focused on relative behaviour of insulation materials, the many measurements carried out can be divided into three broad categories:
1. Continuous and permanent measurements;
2. Periodic measurements;
3. Measurements on request.
1. Continuous Measurement
This category is comprised of meteorological parameters (raw data), including
• Wind speed and direction;
• Relative humidity;
• Temperature;
• Atmospheric pressure;
• Accumulated rainfall;
• Solar radiation.
In addition, local hourly data on SO2 pollution is available from AtmoSud’s website (www.atmosud.org), showing measurements some 200 m from the EDF test station. Voltage power supply is also recorded for each transformer used at the test station.
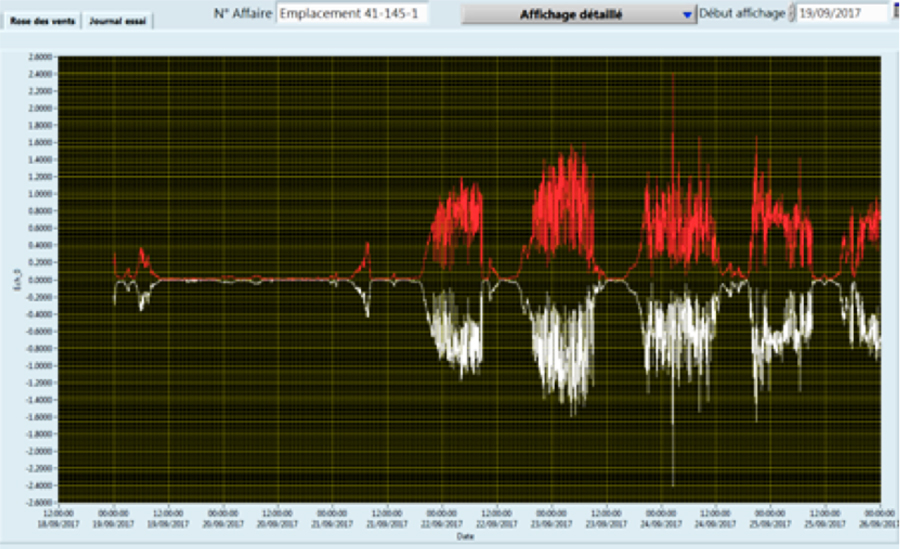
Leakage current is continuously measured on a reference string of insulators and compared to a calibration curve (Current = f (Salinity)) for the specific type of insulator. Peak leakage current on test specimens is also measured (see Fig.12). All these parameters are measured and recorded using a dedicated central measuring unit. Mathematical processing can also be carried out to more accurately analyse results. For example, derived data can be calculated from raw data, e.g. positive charge in Coulombs.
2. Periodic Measurement
Site severity is evaluated during each inspection using a Directional Dust Deposit Gauge according to standard IEC 60815-1. This measurement is simple and economical and results yield multiple types of information. In fact, there is a usually good correlation between the different pollution level assessment systems in place at the test station. In 2019, for example, the site’s pollution index (PI) was measured at level ‘d’ (heavy).

3. Measurements on Request
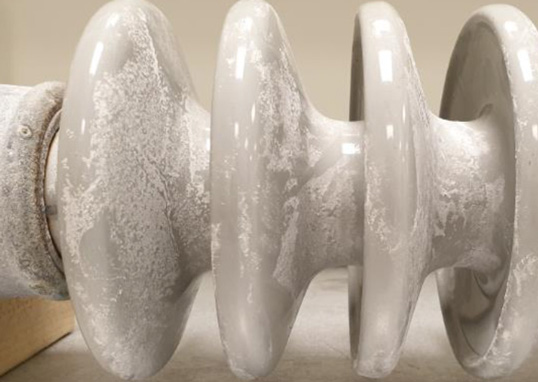
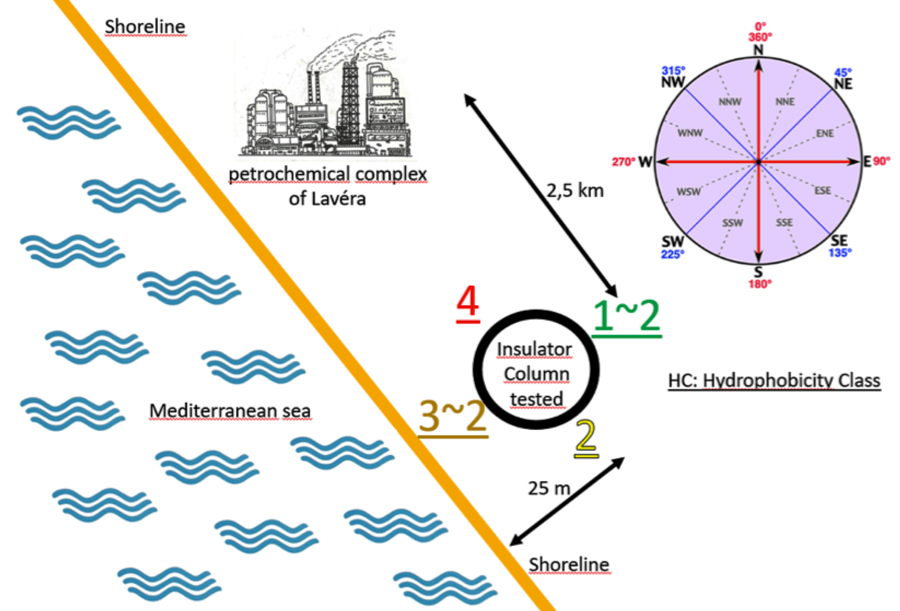
The hydrophobicity of insulators is evaluated according to IEC 62073 Annex C (2016). Fig. 13, for example, provides recent measurements on a large polymeric housing with about 400 mm diameter. This has been set up for approximately 4 years and shows that Hydrophobicity Class (HC) depends on observed direction. On the grounded side, sheds directly facing the petrochemical complex have been assessed at HC 4 while on the side facing the sea HC is between 2 and 3. The best HC score of from 1 to 2 was found on sheds oriented toward the north-northeast. These findings correlate well with local sources of pollution as well as with wind direction. HC level increases from the insulator’s grounded end to the energized top keeping the same gap at the same orientation. In this case, industrial pollution appears to be the critical factor.
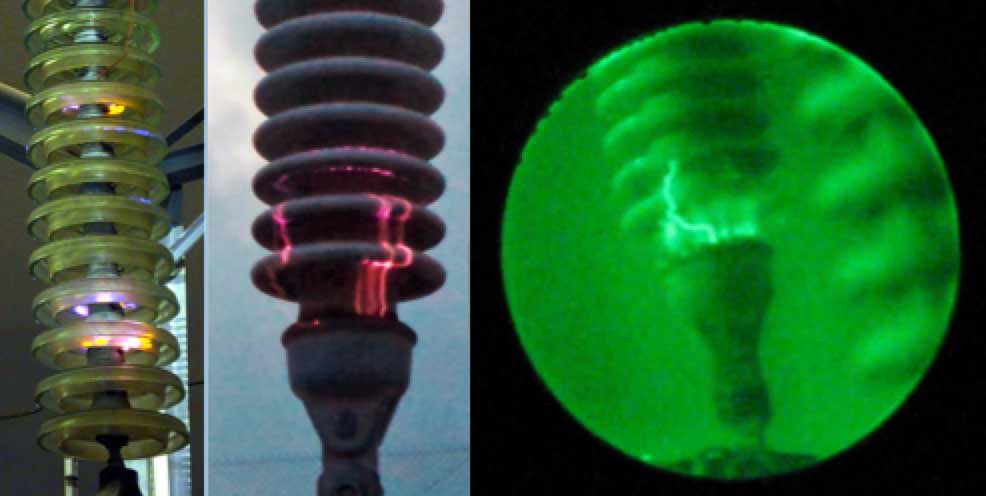
Equivalent Salt Deposit Density (ESDD) measurements are performed by technicians and the water used in washing is sent to an independent chemical laboratory to analyze its composition. For a few months now the station has also been equipped with equipment needed to carry out Non-Soluble Deposit Density (NSDD) measurements. Moreover, technicians also carry out visual inspections of equipment under test during each visit to detect any evidence of damage. Many photos are also taken to monitor ageing. The test station’s laboratory is equipped with imaging tools such as visible domain, infrared and light intensifier (see Fig.14) and it is therefore possible to organize both nighttime and morning investigations. Acoustic studies, however, are difficult to conduct due to proximity of other objects under test. This disturbs such measurements and creates ‘parasitic’ noise.

Discussion
Customers of the test station include different departments within EDF, including production, distribution and research and development. Manufacturers of insulators, cables and accessories are also clients, carrying out tests as part of new product development and also to verify and validate performance under actual extreme conditions.
The past years have seen growing diversification of devices being tested. For example, growing need for monitoring tools has motivated their manufacturers to carry out tests on devices under the same conditions as the objects they are intended to monitor. The station has also been used to reproduce defects observed on the field. Defects on items such as fiber optic accessories, for example, have been reproduced in only a few months, thereby allowing better and quicker understanding of the mechanisms involved. In this regard, the test station has proven a relevant and efficient tool for engineers charged with this type of study.
The station has also been used to evaluate performance of RTV silicone coatings applied on site (see Fig.15). Here, it was highlighted that the process used to apply the RTV material was just as important as the quality of the coating itself.
While the Test Station is not covered by the COFRAC accreditation awarded EDF laboratories, the same quality assurance rules are applied and help ensure quality of results. It is worthwhile noting that tests carried out in a laboratory setting make it possible to control all constraints, ensuring high degree of reproducibility. Such tests can also be performed sequentially and repeatedly. The problem is how representative these constraints are in relation to actual conditions in the field. As such, although laboratory tests do allow easier comparison of different products under the same conditions, it is important to ask whether the constraints applied in the lab actually reflect reality.
Within the framework of the studies conducted at the Martigues Test Station, pollution constraints applied to equipment are based on reality and this is a key advantage. Observation of damage or of poor performance is therefore a valid demonstration of a basically unreliable product. But this also requires testing different products at the same time to allow valid comparison. Still, when this is not possible, precise records of pollution and meteorological variables still make it possible to look for similarities between different test periods in terms of variables such as level of precipitation, distribution of pollution, wind direction, etc.
Looking to the future of the Martigues Test Station, there is the goal of adding a permanent autonomous camera recording system covering visible, IR and UV. This way, electrical activity on an object under test can be better monitored using triggers such as peak leakage current, meteorological parameters or other data. Recently, additional studies have been initiated, in particular dealing with frequency analysis of leakage currents. The objective has been to identify ‘defect signatures’ for different families of insulators wherever possible. Continuous spectral analysis will allow better understanding insulator degradation mechanisms. While this will require further work, it represents an important step forward in studying ageing and performance of insulators under severe pollution conditions.
Reference:
[1]: Studies of the long-term performance of composite insulators and of the representativity of ageing tests – EDF/ SEDIVER – CIGRE 1996.